

Supply and Demand thread 🧵
I'm about to walk you through my process of finding powerful S&D zones for day trading! All examples are zones I found and traded in the past week on $QQQ
Real zones - Real profits! Lets dive in 🤙👇
$spy $iwm $aapl $nvda $amd $tsla
I'm about to walk you through my process of finding powerful S&D zones for day trading! All examples are zones I found and traded in the past week on $QQQ
Real zones - Real profits! Lets dive in 🤙👇
$spy $iwm $aapl $nvda $amd $tsla

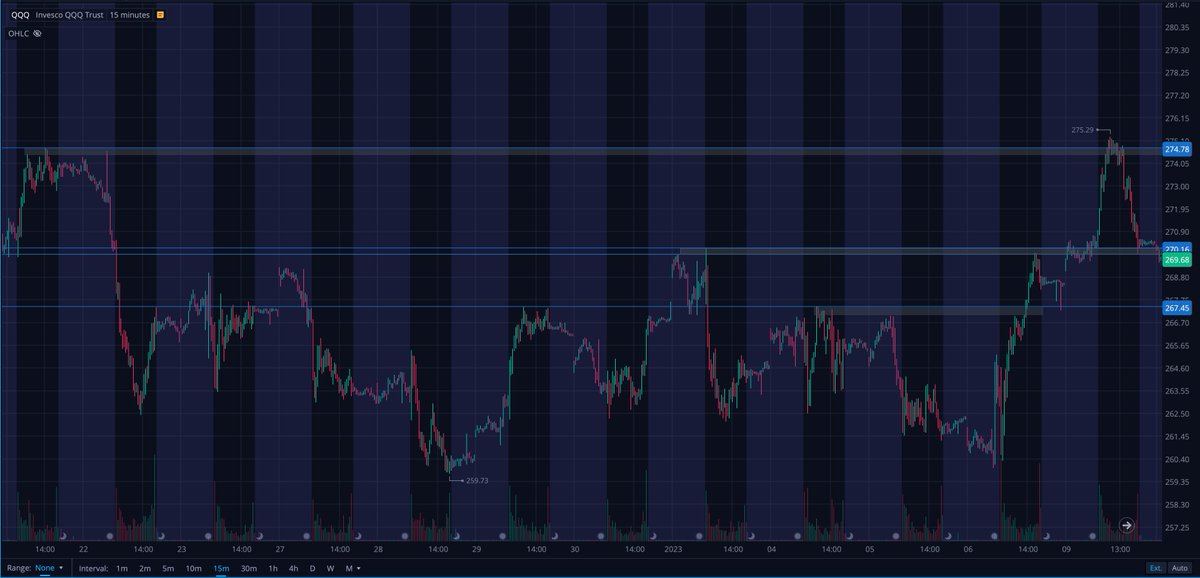
To make it easy to keep track of through each chart I have numbered the Zones in this thread 1-5. I'm going to show you exactly how I found and traded each of them. Starting with these 3 zones below 👇 All 3 had a purpose and I will show you why.
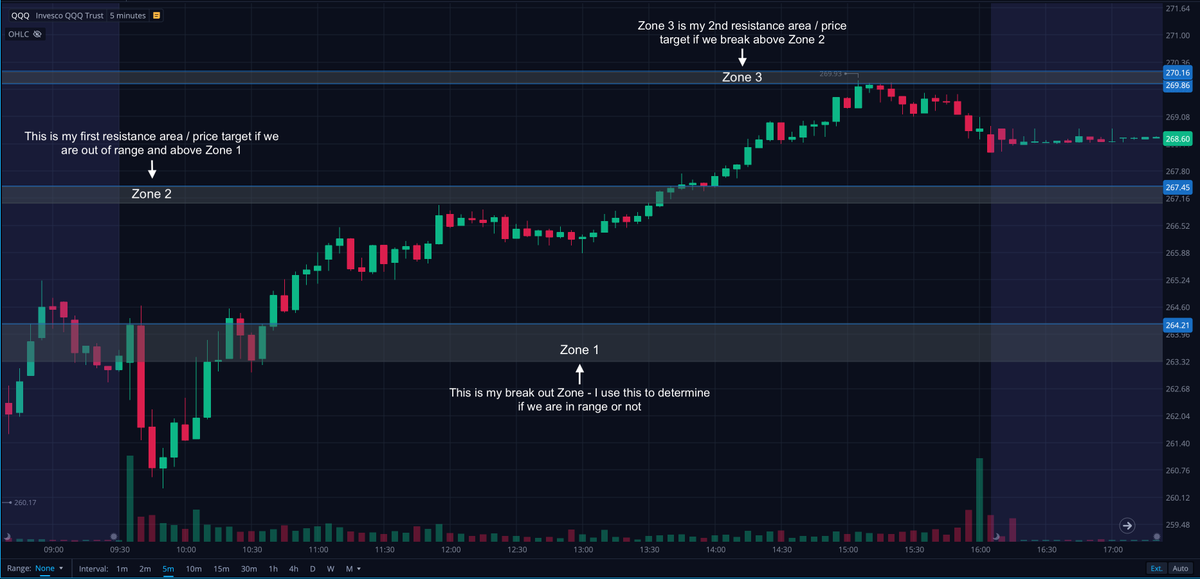
Zone 1 is my breakout point. I get this from the previous days high. I draw a zone from the high of day wick to the following candle body.
Breaking above this zone tells me that we are out of range and putting in a higher high from the day before. This is a good sign of momentum
Breaking above this zone tells me that we are out of range and putting in a higher high from the day before. This is a good sign of momentum
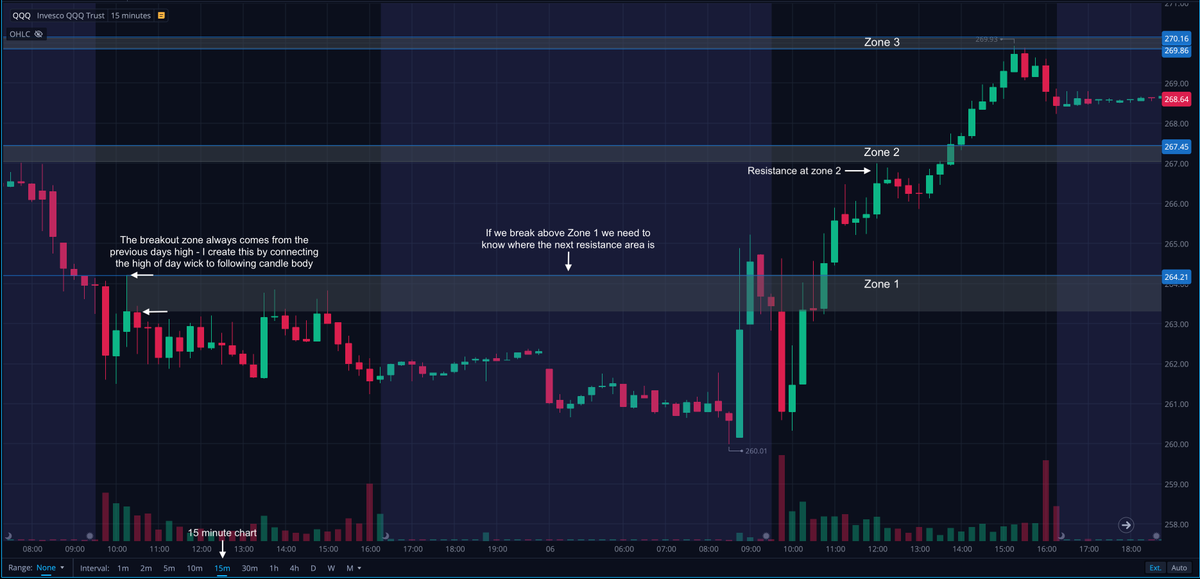
Zone 2 is the next resistance point we will see if we break out of that previous days range. I use this as a price target and a place to be cautious of a rejection/reversal.
To find this zone I look back on the chart and find the place we last saw resistance/reversal happen 👇
To find this zone I look back on the chart and find the place we last saw resistance/reversal happen 👇
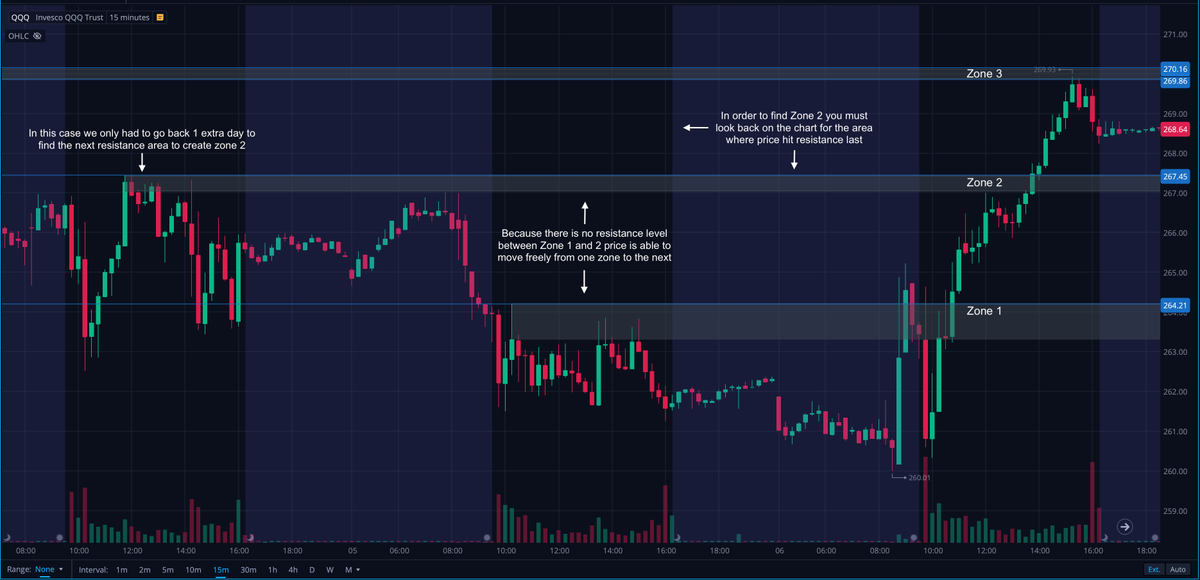
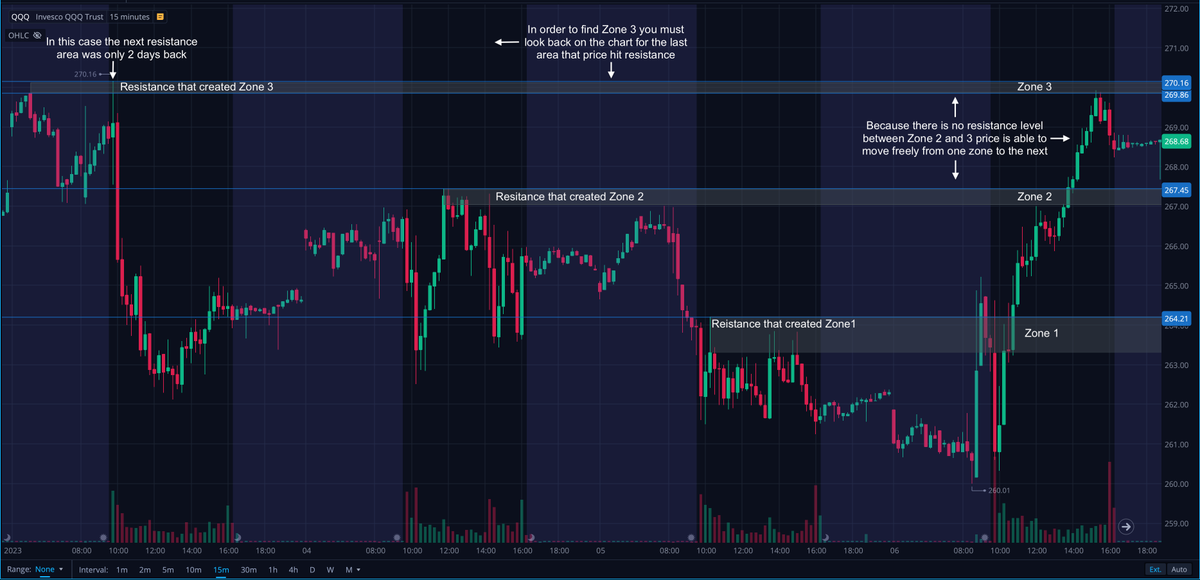
Zone 3 is my next area to watch for a rejection/reversal if we break through Zone 2. I find this area by repeating the above process again
When price hits Zone 2, im watching for a break or rejection. A break likely sends it to Zone 3, Rejection likely sends it back to Zone 1👇
When price hits Zone 2, im watching for a break or rejection. A break likely sends it to Zone 3, Rejection likely sends it back to Zone 1👇
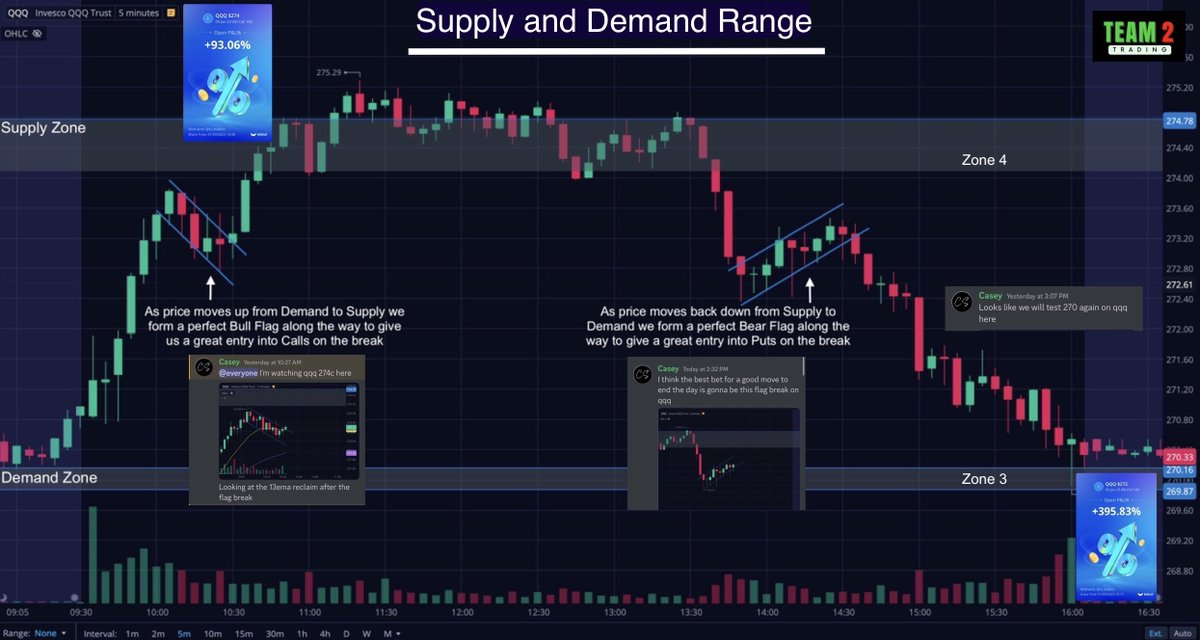
Here's a look at how I played these zones this day 👇
I missed the the move from Zone 1 to 2. I watched Zone 2 for a break or rejection. Because I have these Zones charted, I know that a break of 2 will likely lead to 3. So when it breaks I enter long and aim for Zone 3.
I missed the the move from Zone 1 to 2. I watched Zone 2 for a break or rejection. Because I have these Zones charted, I know that a break of 2 will likely lead to 3. So when it breaks I enter long and aim for Zone 3.

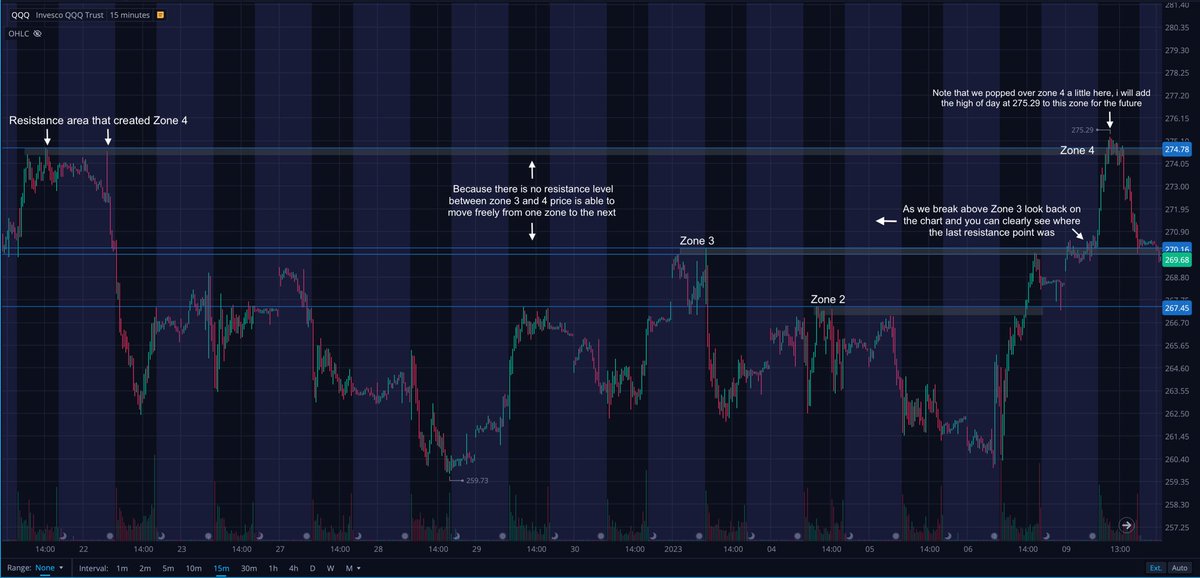
Coming into the following day I need another zone to aim for if Zone 3 Breaks. This is where Zone 4 comes in. I found this Zone using the same simple process I used to find 2 and 3.
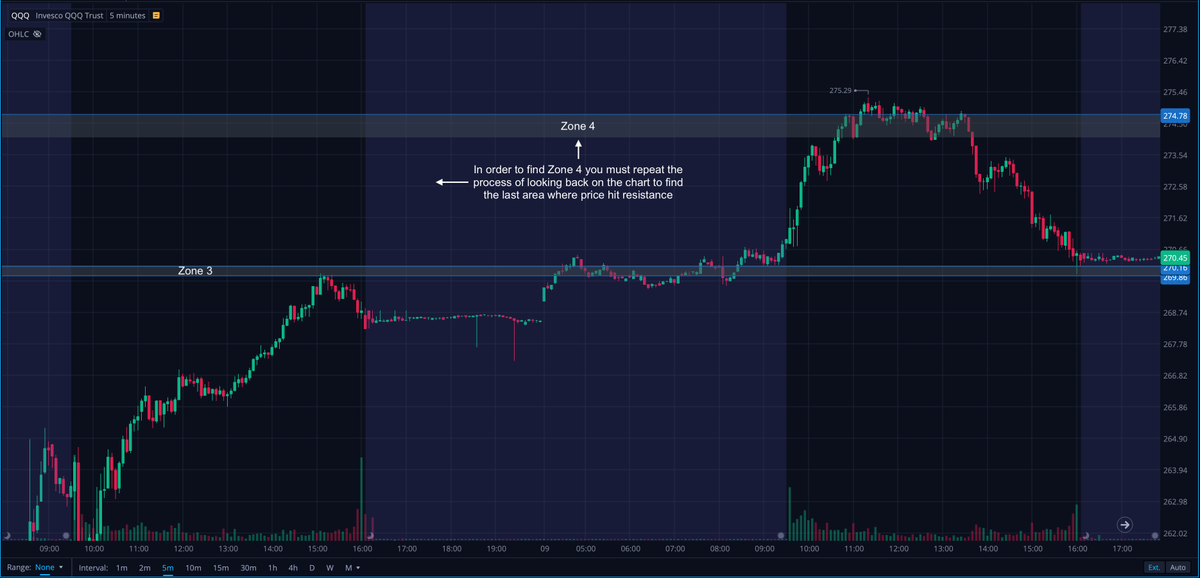
I look back as far as I need in order to find the next area where price got rejected. In this case it was about 2 weeks back. When there is large gaps between resistance levels it creates smooth price action as price is able to move freely from one zone to the next.
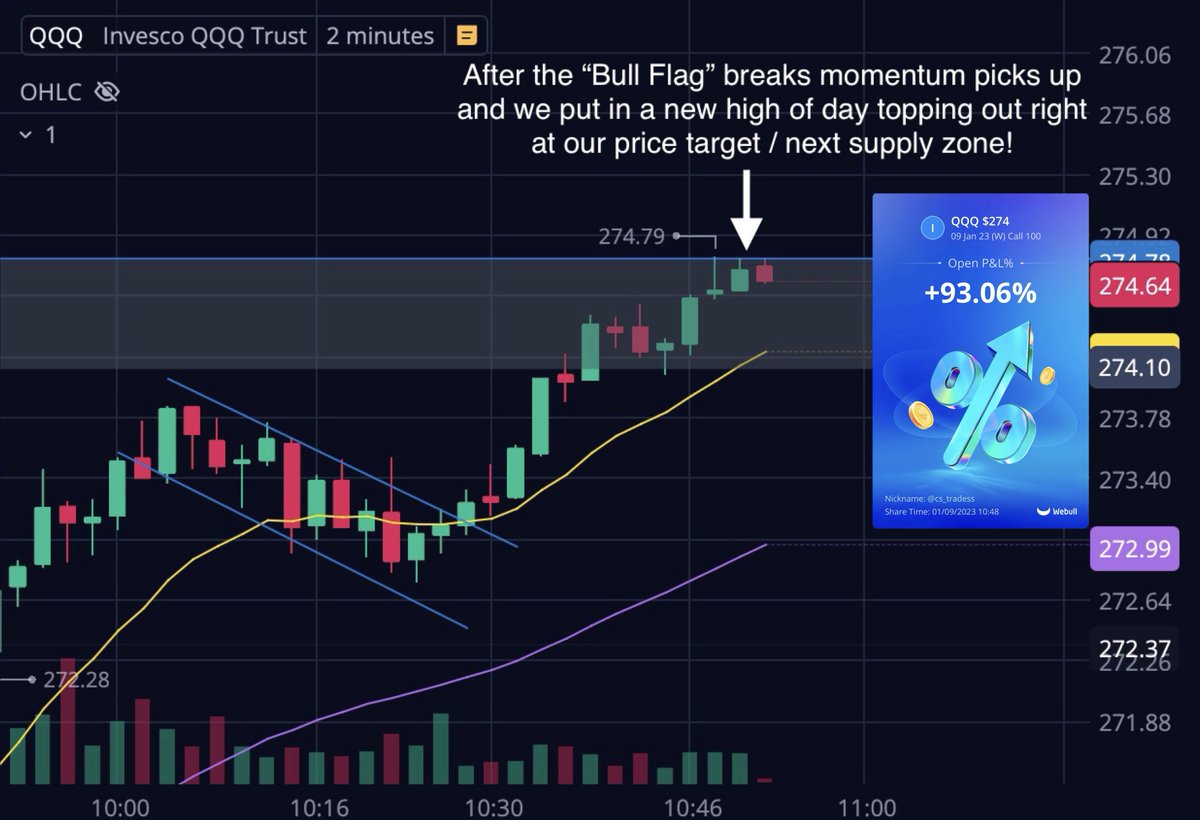
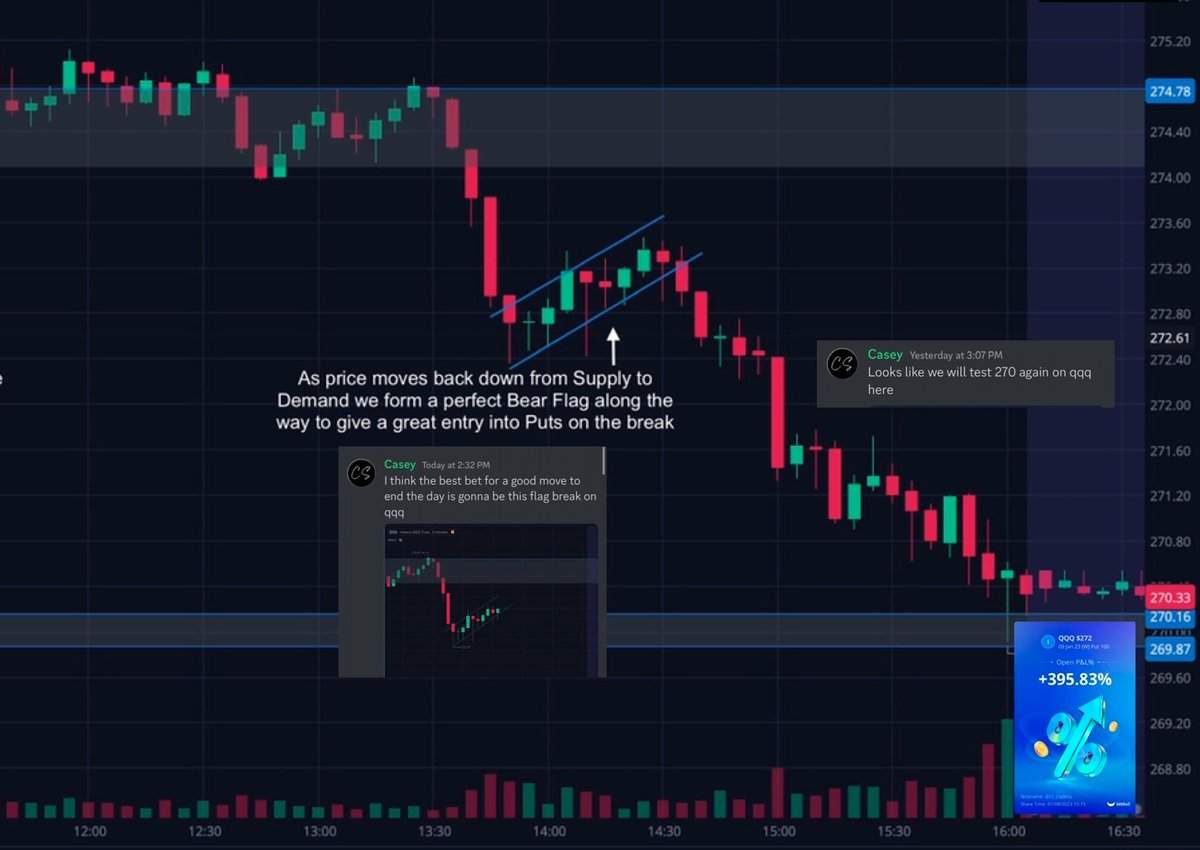
Here is a closer look at the price action of that day. Again because I had these Zones on my chart I had a good idea of where price may be headed next. Catching 100% move up into Zone 4, then a 400% move on the rejection back to Zone 3 👇
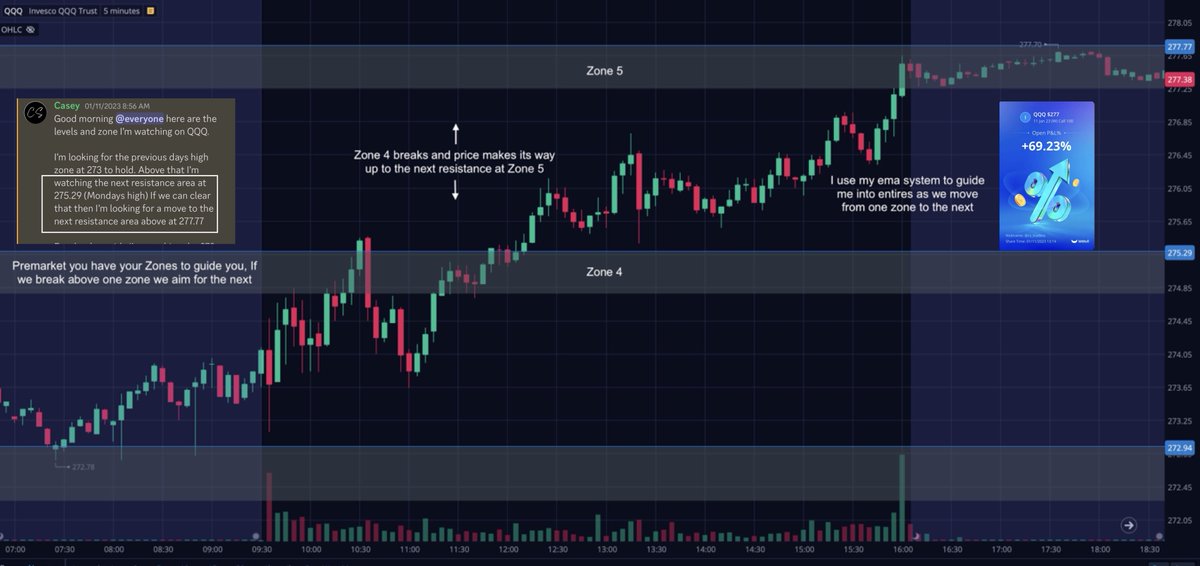
The following day we stayed in range under Zone 4. So now I know that a break of Zone 4 will bring momentum in the future. Time to find another price target for when that happens 👇
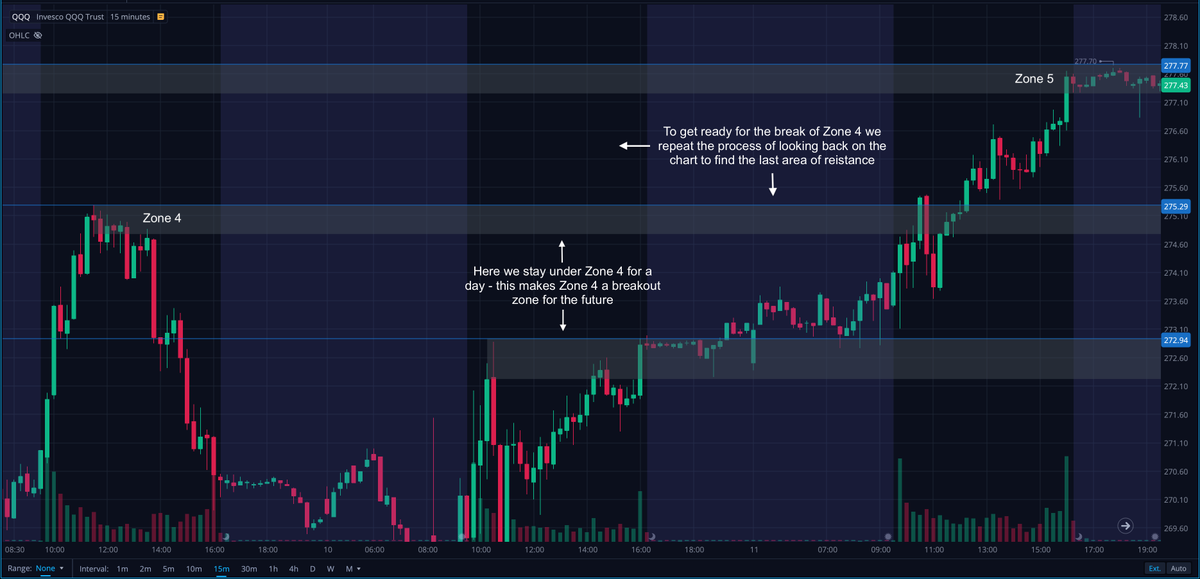
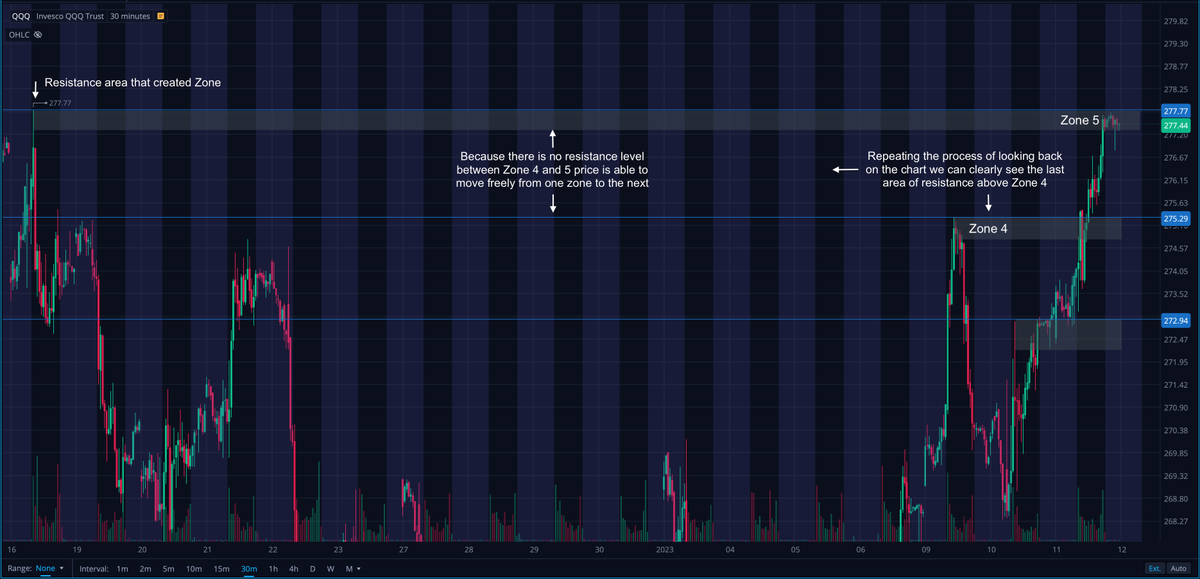
Repeating the same process like clockwork, I look back on the chart at the last place price was rejected over Zone 4. This is where I got Zone 5 from.
And again by observing the lack of resistance in between Zone 4 and 5 I know that price will likely move freely between the two.
And again by observing the lack of resistance in between Zone 4 and 5 I know that price will likely move freely between the two.
Once again coming into the day I have my Zones to watch. If we break Zone 4 I'm looking at going long and aiming for Zone 5. This keeps me on the right side of the momentum so i'm not fighting against the trend.

Thanks for reading! I hope this thread helps give you an understanding of how to find these Levels and Zones for yourself 🤙
Please give it a ❤️ & ♻️ so everyone can start learning to chart and find zones to improve their trading.
Please give it a ❤️ & ♻️ so everyone can start learning to chart and find zones to improve their trading.
Subscribe to my YouTube channel so you don't miss part 2 of my Levels and Zones video 🙏
youtube.com
youtube.com
If you're interested in trading with a supportive community that focuses on teaching simple effective trading techniques then come join the team! There are still spots available 👇
patreon.com
patreon.com

For playing the downside it’s the same process in reverse. I look for key support levels instead of resistance 🤙
Here the chart for Zone 4, I uploaded the blank one in the thread 👍
Loading suggestions...