

@tokenterminal aggregates financial data of blockchains and decentralized applications.
Knowing how to use it can increase your portfolio performance due to a better on-chain understanding.
Here is my guide on how to properly use this tool and find your next 10x +
👇🧵1/22
Knowing how to use it can increase your portfolio performance due to a better on-chain understanding.
Here is my guide on how to properly use this tool and find your next 10x +
👇🧵1/22

1.
As said, Tokenterminal is a platform that aggregates different financial data coming from blockchains and decentralized applications.
This is crucial if you want to stay updated knowing what’s happening on your favorite project and valuating other assets.
As said, Tokenterminal is a platform that aggregates different financial data coming from blockchains and decentralized applications.
This is crucial if you want to stay updated knowing what’s happening on your favorite project and valuating other assets.
2.
With the free dashboard you can do 3 main things:
• Search new projects based on multiple different financial metrics and market sectors.
• View data & metrics of projects.
• Compare data blockchains to gauge the strongest/weakest.
With the free dashboard you can do 3 main things:
• Search new projects based on multiple different financial metrics and market sectors.
• View data & metrics of projects.
• Compare data blockchains to gauge the strongest/weakest.
3.
If you launch the dashboard you can scroll through different metrics:
• Total value locked.
• Fees
• Revenue
• Earnings
• P/F
• P/S
• Treasury
• Daily active users
• Daily developers
Let’s analyze them 1 by 1.
If you launch the dashboard you can scroll through different metrics:
• Total value locked.
• Fees
• Revenue
• Earnings
• P/F
• P/S
• Treasury
• Daily active users
• Daily developers
Let’s analyze them 1 by 1.

4.
▫️Total value locked.
TVL measures the total value of all assets locked into DeFi protocols, including all the coins deposited in all the functions of DeFi protocols: staking, lending, and liquidity pools.
• Why it is important?👇
▫️Total value locked.
TVL measures the total value of all assets locked into DeFi protocols, including all the coins deposited in all the functions of DeFi protocols: staking, lending, and liquidity pools.
• Why it is important?👇
5.
• You can gauge the size/growth/strenght of a DeFi ecosystem.
• The higher the TVL, the higher the interest into that protocol and probably the correlation with the token.
• Higher TVL also means more liquidity resulting in more benefits for users.
• You can gauge the size/growth/strenght of a DeFi ecosystem.
• The higher the TVL, the higher the interest into that protocol and probably the correlation with the token.
• Higher TVL also means more liquidity resulting in more benefits for users.
6.
▫️Fees.
This is a metric that tells you how much users are willing to pay for the protocol’s services.
Different types of markets, different types of fees.
• NFT marketplace 👉 Royalties
• DEX 👉 trading fees
• Blockchain 👉 txs fees
▫️Fees.
This is a metric that tells you how much users are willing to pay for the protocol’s services.
Different types of markets, different types of fees.
• NFT marketplace 👉 Royalties
• DEX 👉 trading fees
• Blockchain 👉 txs fees
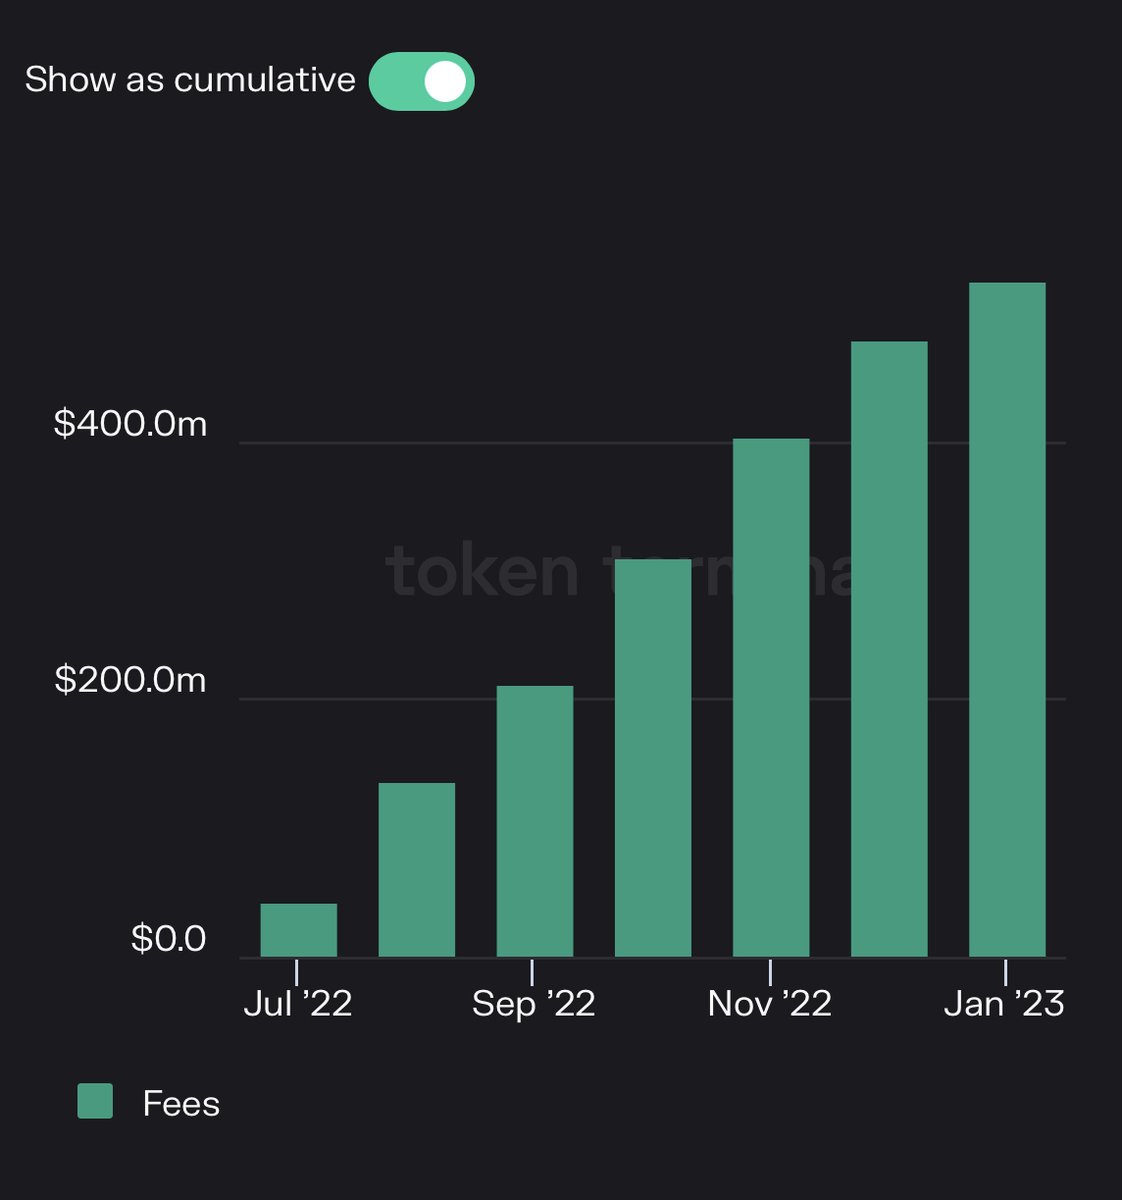
7.
Checking the fees of each type of market can give you an edge knowing where the interest is shifting and where the money are flowing.
More fees 👉 more interest 👉 market type can soar.
Monthly cumulative fees of $ETH 👇
Checking the fees of each type of market can give you an edge knowing where the interest is shifting and where the money are flowing.
More fees 👉 more interest 👉 market type can soar.
Monthly cumulative fees of $ETH 👇
8.
▫️Revenues.
Revenues indicate how much a specific protocol captures of the fees paid by users.
It’s linked to the fees as it’s always a % of them.
Simple to understand the importance:
no interest 👉 no revenues 👉 protocol might fail.
▫️Revenues.
Revenues indicate how much a specific protocol captures of the fees paid by users.
It’s linked to the fees as it’s always a % of them.
Simple to understand the importance:
no interest 👉 no revenues 👉 protocol might fail.
9.
▫️Earnings.
Revenues aren’t net as protocols need to shave them off by paying token incentives.
Earnings are the result coming from Revenues - token incentives.
This is a clearer outlook on money generated by protocols so keep a big eye on this one.
▫️Earnings.
Revenues aren’t net as protocols need to shave them off by paying token incentives.
Earnings are the result coming from Revenues - token incentives.
This is a clearer outlook on money generated by protocols so keep a big eye on this one.
10.
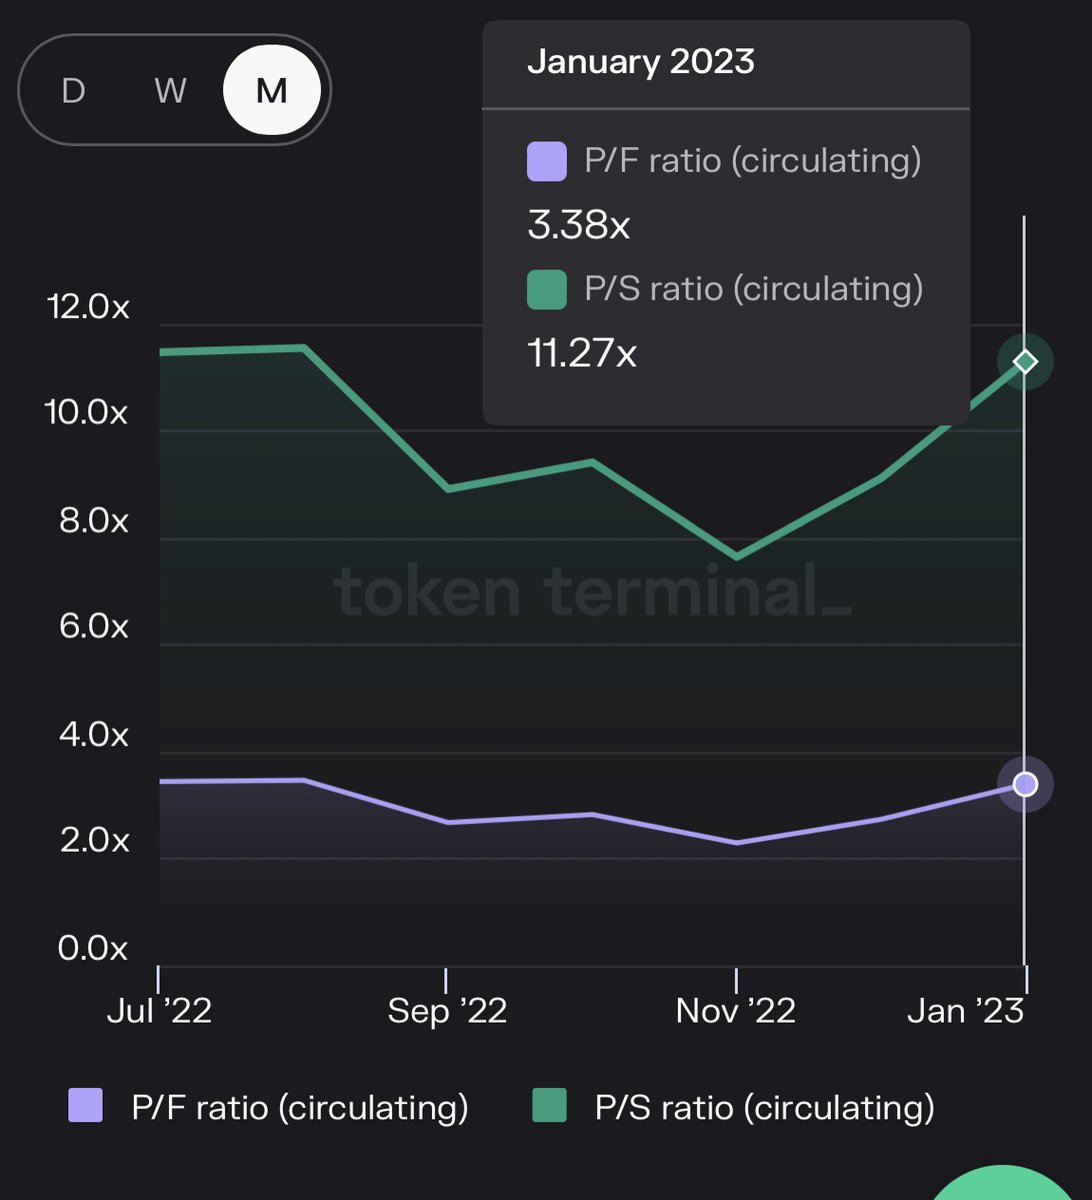
▫️P/F & P/S
If you’re looking for new investment opportunities you should look at the price to fees and price to sales ratio.
• P/F shows the correlation marketcap/fees generated.
• P/S shows the correlation marketcap/revenues generated.
$GMX monthly in the example.👇
▫️P/F & P/S
If you’re looking for new investment opportunities you should look at the price to fees and price to sales ratio.
• P/F shows the correlation marketcap/fees generated.
• P/S shows the correlation marketcap/revenues generated.
$GMX monthly in the example.👇
11.
• Why are they important?
Because they can help us to identify protocols that are used by people and are generating fees + revenues, allowing us to scan small ones and of course hidden opportunities.
Lower ratios are better from our investment perspective.
• Why are they important?
Because they can help us to identify protocols that are used by people and are generating fees + revenues, allowing us to scan small ones and of course hidden opportunities.
Lower ratios are better from our investment perspective.
12.
▫️Treasury.
It is the total reserve funds used for many things such as marketing, fees redistribution, edge for risks etc
A ramping up Treasury is always a great sign as it gives more strength to the protocol.
Make sure to give it a check.
▫️Treasury.
It is the total reserve funds used for many things such as marketing, fees redistribution, edge for risks etc
A ramping up Treasury is always a great sign as it gives more strength to the protocol.
Make sure to give it a check.
13.
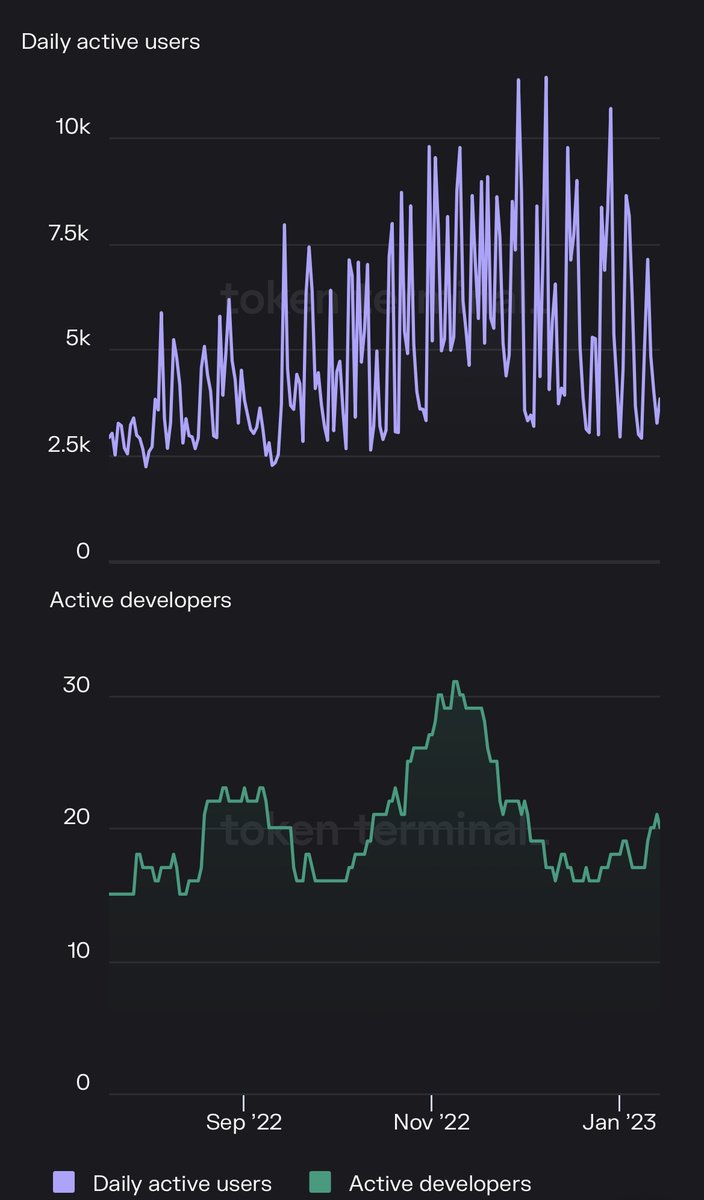
▫️Daily active users & daily active developers.
• Daily active users is a metric useful for assessing which dapps and blockchains have more usage.
• Daily active developers show us how many of them are working on a specific protocol.
This is $AAVE, for example. 👇
▫️Daily active users & daily active developers.
• Daily active users is a metric useful for assessing which dapps and blockchains have more usage.
• Daily active developers show us how many of them are working on a specific protocol.
This is $AAVE, for example. 👇
14.
As you can imagine, these 2 metrics are important.
A blockchain without users and developers is a no man’s land.
Seeing organic growth in both can be used to gauge the prospects of a project and its possible appreciation.
Never invest in dead chains.
As you can imagine, these 2 metrics are important.
A blockchain without users and developers is a no man’s land.
Seeing organic growth in both can be used to gauge the prospects of a project and its possible appreciation.
Never invest in dead chains.
15.
▫️ Tips & final info.
• All of the metrics must be combined to have a clearer outlook on a project.
Never rely on few metrics but mix them.
• Use the “Show as cumulative” button and change timeframes to have more insights.
▫️ Tips & final info.
• All of the metrics must be combined to have a clearer outlook on a project.
Never rely on few metrics but mix them.
• Use the “Show as cumulative” button and change timeframes to have more insights.
16.
Example:
In analyzing revenues you might see that protocol “x” outperforms protocol “y” on the daily ones.
But if you switch to cumulative you might see that “y” has generated more revenues than “x” on a longer timeframe.
This is why you should use that button.
Example:
In analyzing revenues you might see that protocol “x” outperforms protocol “y” on the daily ones.
But if you switch to cumulative you might see that “y” has generated more revenues than “x” on a longer timeframe.
This is why you should use that button.
17.
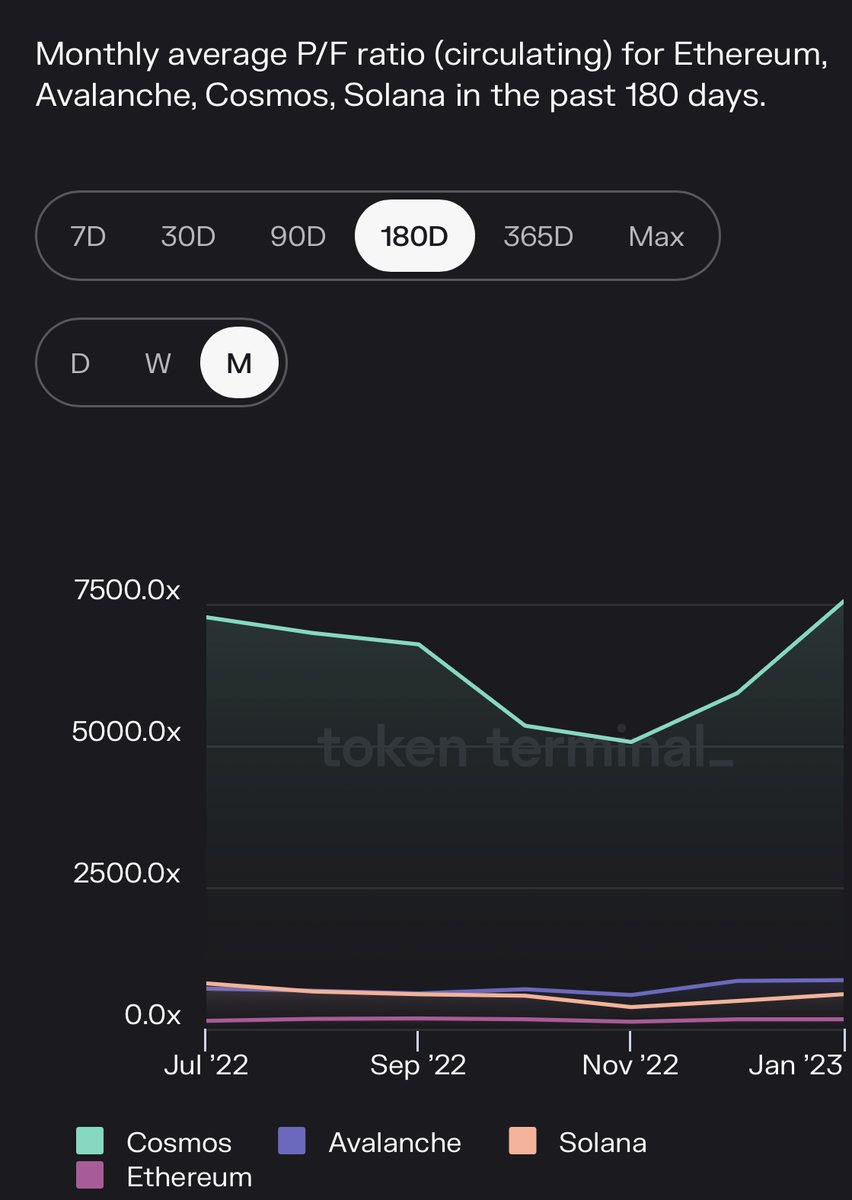
• Use the “Competitive Landscape” feature.
It's very important from an investor's point of view to be able to compare different protocols to see which is performing better.
You can compare all of the metrics and projects.
P/F ratio between $ATOM $AVAX $SOL $ETH
• Use the “Competitive Landscape” feature.
It's very important from an investor's point of view to be able to compare different protocols to see which is performing better.
You can compare all of the metrics and projects.
P/F ratio between $ATOM $AVAX $SOL $ETH
18.
• You’ll find fully diluted marketcap metric:
In simple terms it’s the marketcap of a project calculated on the max supply of tokens which means un-released ones also.
It is substantially an estimation of a project's future market capitalization.
• You’ll find fully diluted marketcap metric:
In simple terms it’s the marketcap of a project calculated on the max supply of tokens which means un-released ones also.
It is substantially an estimation of a project's future market capitalization.
19.
• I use Tokenterminal to predominantly evaluate DeFi projects as the involvement of capital is more “active” and DeFi tokens are more inclined to classic metrics. (market conditions apart)
• I use Tokenterminal to predominantly evaluate DeFi projects as the involvement of capital is more “active” and DeFi tokens are more inclined to classic metrics. (market conditions apart)
20.
To conclude, I want to point out that this tool is very useful if you want to fundamentally analyze projects and imight become one of your favorites, if used properly.
Always remember to match different metrics with the traditional laws of project evaluation.
To conclude, I want to point out that this tool is very useful if you want to fundamentally analyze projects and imight become one of your favorites, if used properly.
Always remember to match different metrics with the traditional laws of project evaluation.
21.
Remember to follow the greatest analysts for more insights:
• @CryptoGirlNova
• @cyrilXBT
• @rektdiomedes
• @MercyDeGreat
• @crypthoem
• @Teaching_Crypto
• @crypto_linn
• @i_am_jackis
• @chirocrypto
• @cryptoskullx
• @LouisCooper_
• @CryptoShiro_
Remember to follow the greatest analysts for more insights:
• @CryptoGirlNova
• @cyrilXBT
• @rektdiomedes
• @MercyDeGreat
• @crypthoem
• @Teaching_Crypto
• @crypto_linn
• @i_am_jackis
• @chirocrypto
• @cryptoskullx
• @LouisCooper_
• @CryptoShiro_
22.
That's it.
• If you found value in my thread follow me @IamZeroIka for more crypto insights.
• A like + RT is always appreciated.
Thanks for reading, Zero.
That's it.
• If you found value in my thread follow me @IamZeroIka for more crypto insights.
• A like + RT is always appreciated.
Thanks for reading, Zero.

Loading suggestions...