

Where are we & how am I playing it?
- My cycle ideas & how I'll scale back in.
- Medium time frame plan.
1/? 🧵👇
- My cycle ideas & how I'll scale back in.
- Medium time frame plan.
1/? 🧵👇

First of all. It's important to remember that nobody knows where the bottom will be. Everyone who talks in certainties is engagement farming.
Stay open-minded for any outcome!
Oke enough, let's take a look at a few relevant things;👇
Stay open-minded for any outcome!
Oke enough, let's take a look at a few relevant things;👇
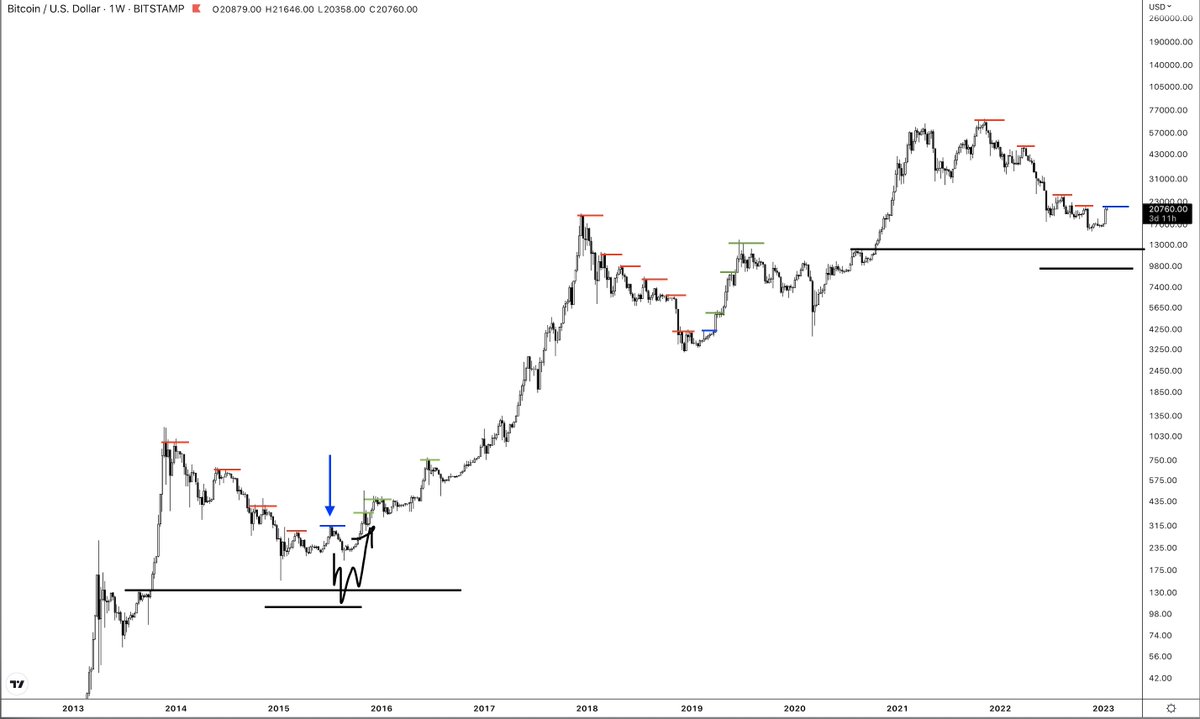
1. Horizontals.
$BTC finds bottoms around HTF key levels.
Two key HTF horizontal levels I'm watching are;
- The previous ATH/Range high
- The mid-range/Monthly demand.
Eventually, if this mid-range goes, we could look at the range low but not relevant right now.
$BTC finds bottoms around HTF key levels.
Two key HTF horizontal levels I'm watching are;
- The previous ATH/Range high
- The mid-range/Monthly demand.
Eventually, if this mid-range goes, we could look at the range low but not relevant right now.
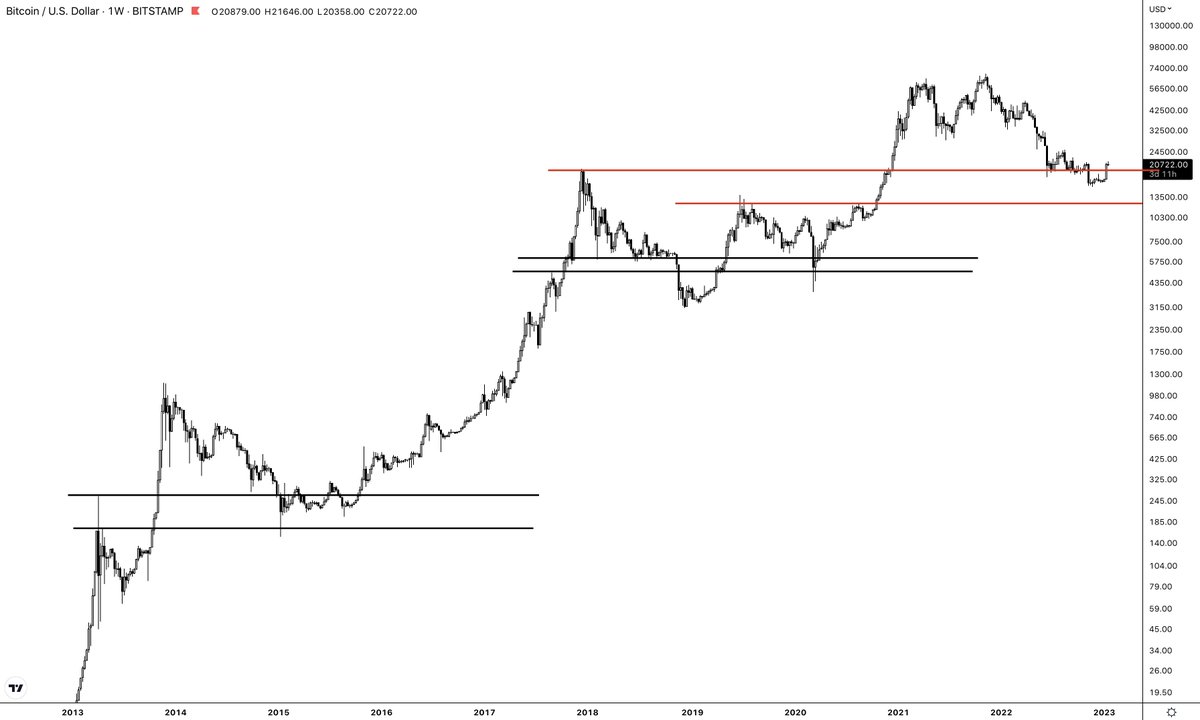
Did I knife catch this level? No, I'm watching the structure unfold around them to determine where we are in the cycle.
Currently, we do form a deviation around this key level.
Currently, we do form a deviation around this key level.
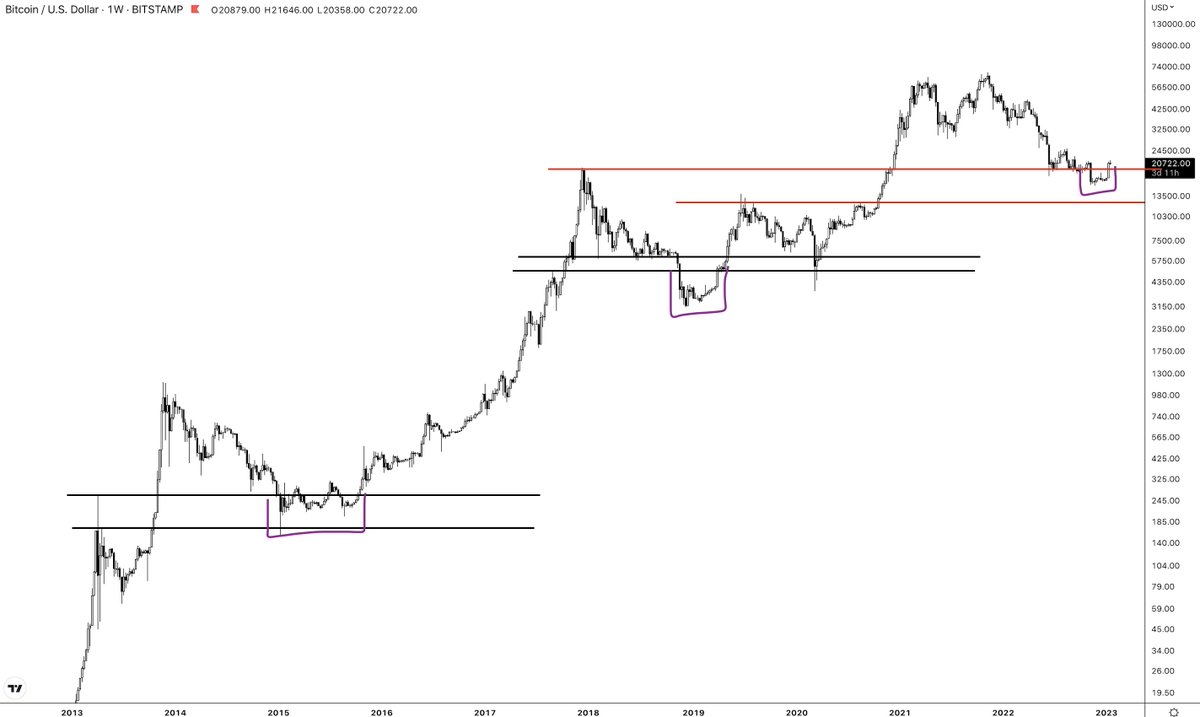
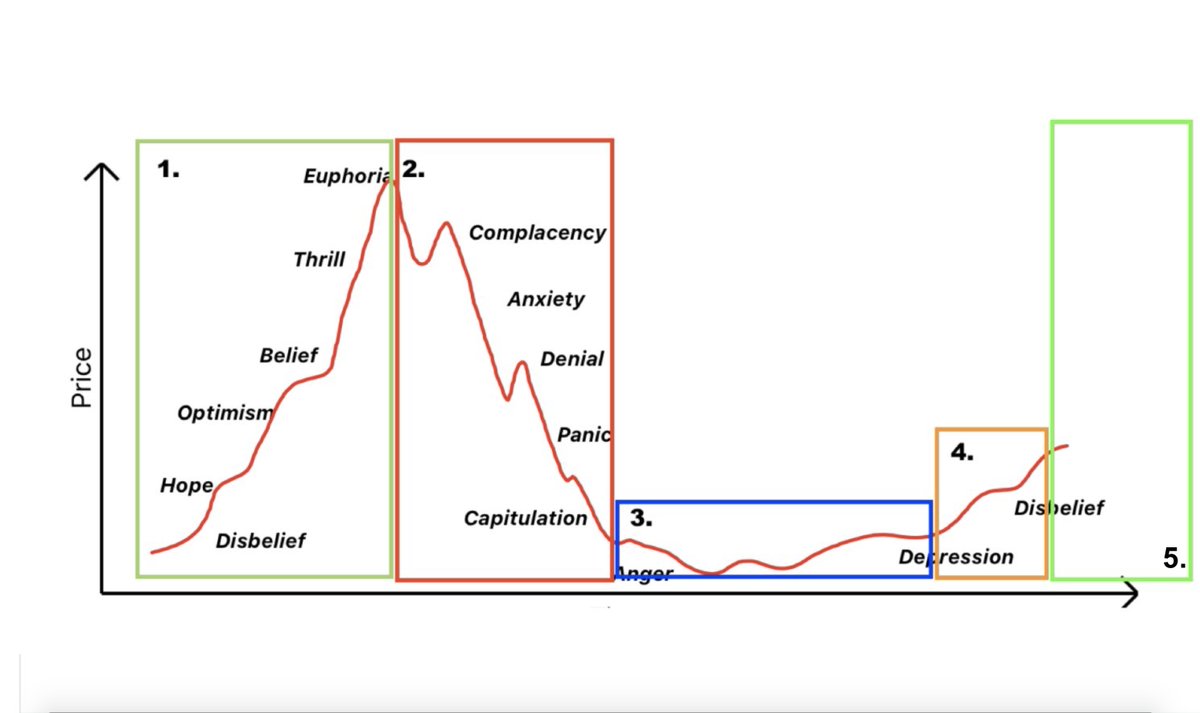
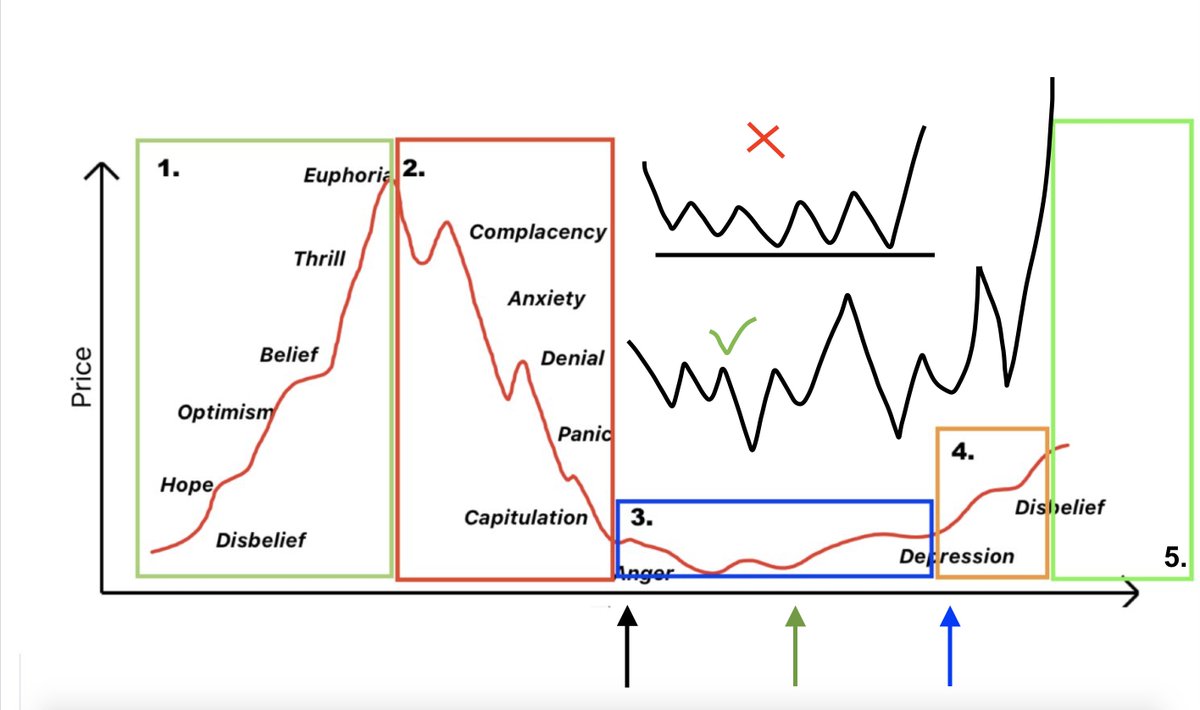
2. Market structure/cycle phases
The initial phase of the bear cycle is the most vertical. Bearish-ms with steep lower lows and lower highs. At some point, bear markets flat out and transition into a more sideways/ranging market structure. The bear trend gets exhausted.
The initial phase of the bear cycle is the most vertical. Bearish-ms with steep lower lows and lower highs. At some point, bear markets flat out and transition into a more sideways/ranging market structure. The bear trend gets exhausted.
Our current market structure doesn't print that much of a lower high. Instead feels like an equal high. In the past, you can see that at the bottom, this is one of the early signs of trend exhaustion.
'Does that means the bottom is here?'👇
'Does that means the bottom is here?'👇
No, at max, it gives us a sign of potentially being in phase 3 and possibly even going into phase 4. It will get more clear over time. And also, phase 3 can involve new lows and fake-outs and not be as clean as our textbook cycle showcase and, in hindsight, still be phase 3.

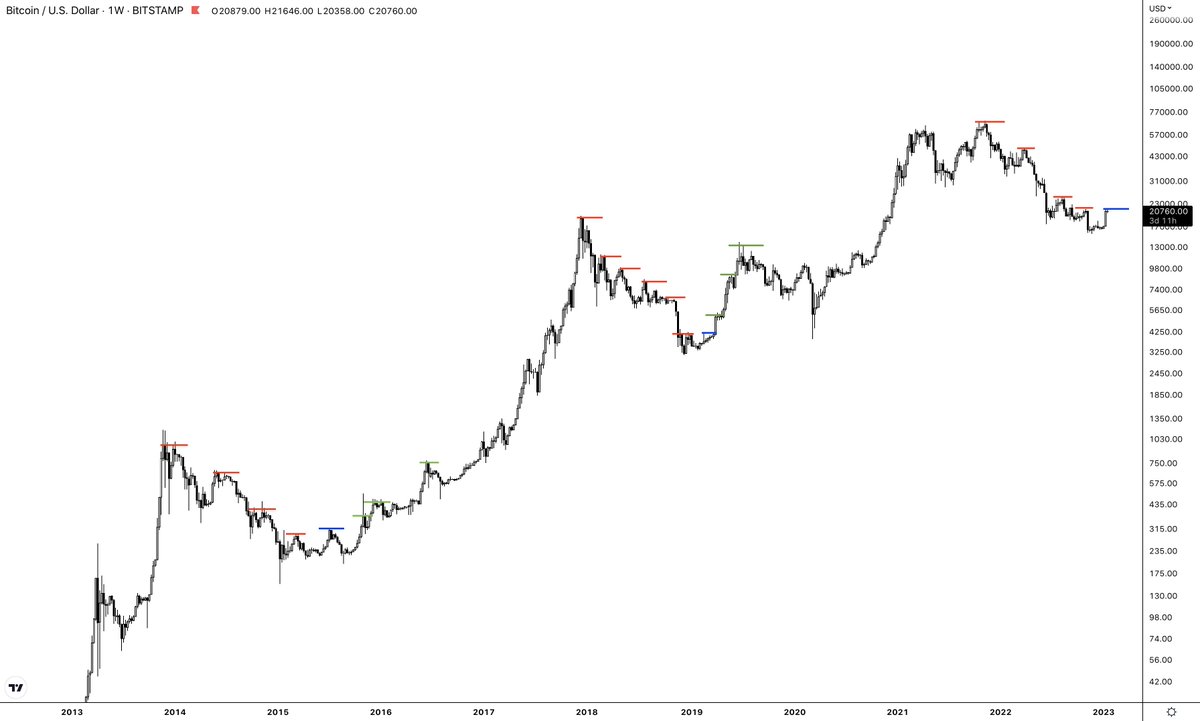
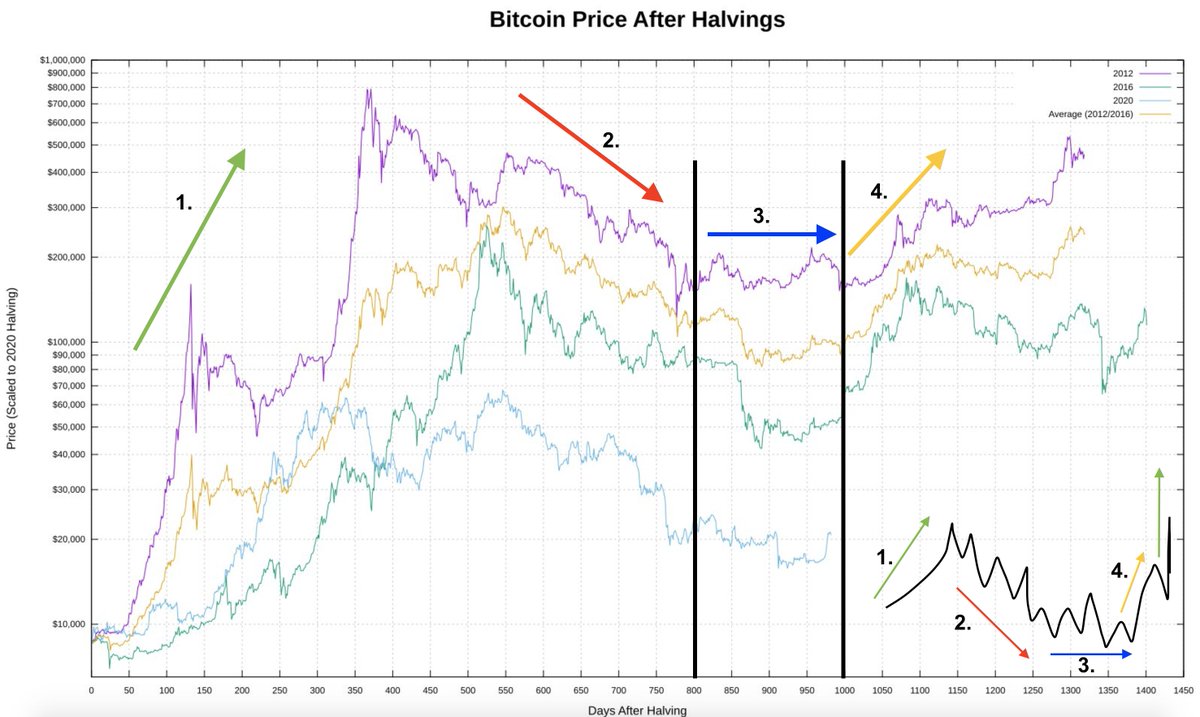
3. The Halvings
As you can see, you can spot the clear, typical market cycle stages shown earlier in this thread on this price and the 'days after halvings chart.'
Historically, we've found a bottom and shift in the cycle phase between 800-1000 days after the last halving.
As you can see, you can spot the clear, typical market cycle stages shown earlier in this thread on this price and the 'days after halvings chart.'
Historically, we've found a bottom and shift in the cycle phase between 800-1000 days after the last halving.
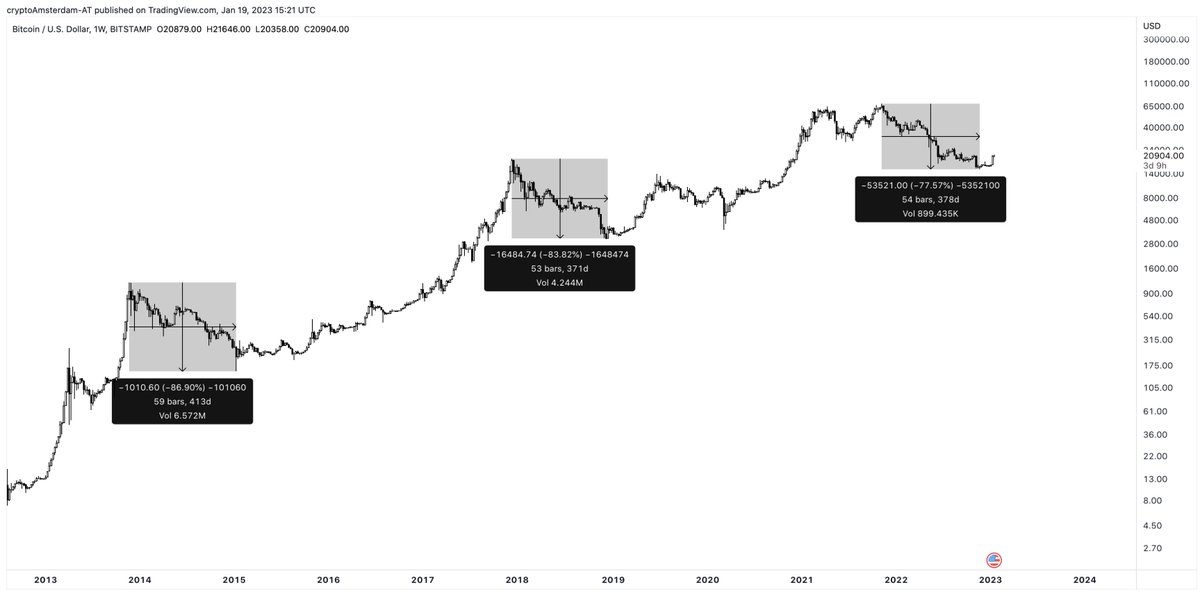
4. Time and percentages down.
- 2013 cycle top to bottom.
It took around 413 days and went down -86.90%.
- 2017 cycle top to bottom.
It took around 371 days and went down -83.82%.
- 2021 top to our current bottom.
378 days and -77.52% (current bottom)
- 2013 cycle top to bottom.
It took around 413 days and went down -86.90%.
- 2017 cycle top to bottom.
It took around 371 days and went down -83.82%.
- 2021 top to our current bottom.
378 days and -77.52% (current bottom)
Recap;
- First key HTF horizontal of interest.
- Potential early signs of vertical downside trend exhausting.
- Historical timing between the halving where usually bottoms form.
- Time and downside after the top are historically in the zone of interest.
- First key HTF horizontal of interest.
- Potential early signs of vertical downside trend exhausting.
- Historical timing between the halving where usually bottoms form.
- Time and downside after the top are historically in the zone of interest.
The odds of being in and around phases 3 & 4 are increasing IMO. The bear markets tail where it might take more time but where the most vertical downside is behind us.
Previous cycle example; 👇
Previous cycle example; 👇
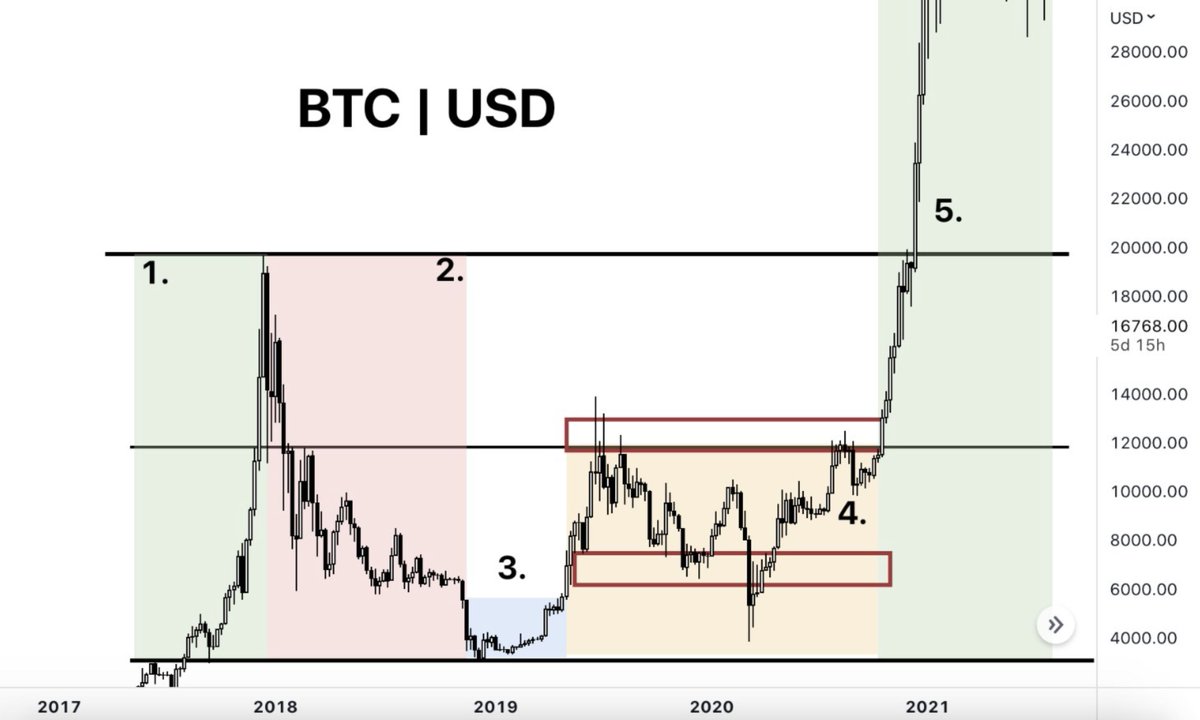
Just like in the example of the previous cycle, it's likely not gonna be as clean as in our textbook example.
It'll likely become more evident over time, so I'd scale in a while, letting the structure unfold rather than trying to knife-catch the bottom.
3 arrows on the chart;👇
It'll likely become more evident over time, so I'd scale in a while, letting the structure unfold rather than trying to knife-catch the bottom.
3 arrows on the chart;👇
Loading suggestions...