

𝑯𝒐𝒘 𝒕𝒐 𝒇𝒊𝒏𝒅 𝒎𝒖𝒍𝒕𝒊𝒃𝒂𝒈𝒈𝒆𝒓𝒔 𝒊𝒏 𝒔𝒕𝒐𝒄𝒌 𝒎𝒂𝒓𝒌𝒆𝒕?
What is a good business?
Is a good business, a good investment too?
Read a 13 year study only based on Data in this thread🧵
1/n
What is a good business?
Is a good business, a good investment too?
Read a 13 year study only based on Data in this thread🧵
1/n
In 2018, i listed down all the parameters every alpha generator has ever talked about and extracted that data for all the companies in Indian market, I back-tested all parameters against the performance of stock price for 10 year period. 2/n
I didn’t just stop there. As any fundamental investor should do, I forward tested the same for next 3 years. when I found it working continuously through thick and thin of market, I made it as one of my main frame work in investing.
Starting my study from ground zero 3/n
Starting my study from ground zero 3/n
Below is the list of some of those parameters i took from the successful investor's newsletter/Memo/Books . 4/n
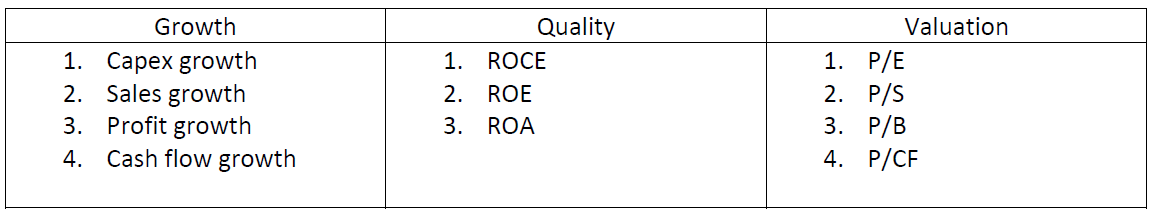
Apart from them, some parameters like Promoter holding, D/E, Equity capital, and current ratio were also made part of this study.
Out of more than 100 plot tht i made I hav shared significant ones in this thread.
1.𝑺𝒂𝒍𝒆𝒔 𝒈𝒓𝒐𝒘𝒕𝒉 𝒗𝒔 10 𝒀𝒓 𝑪𝑨𝑮𝑹 𝒓𝒆𝒕𝒖𝒓𝒏𝒔
5/n
Out of more than 100 plot tht i made I hav shared significant ones in this thread.
1.𝑺𝒂𝒍𝒆𝒔 𝒈𝒓𝒐𝒘𝒕𝒉 𝒗𝒔 10 𝒀𝒓 𝑪𝑨𝑮𝑹 𝒓𝒆𝒕𝒖𝒓𝒏𝒔
5/n
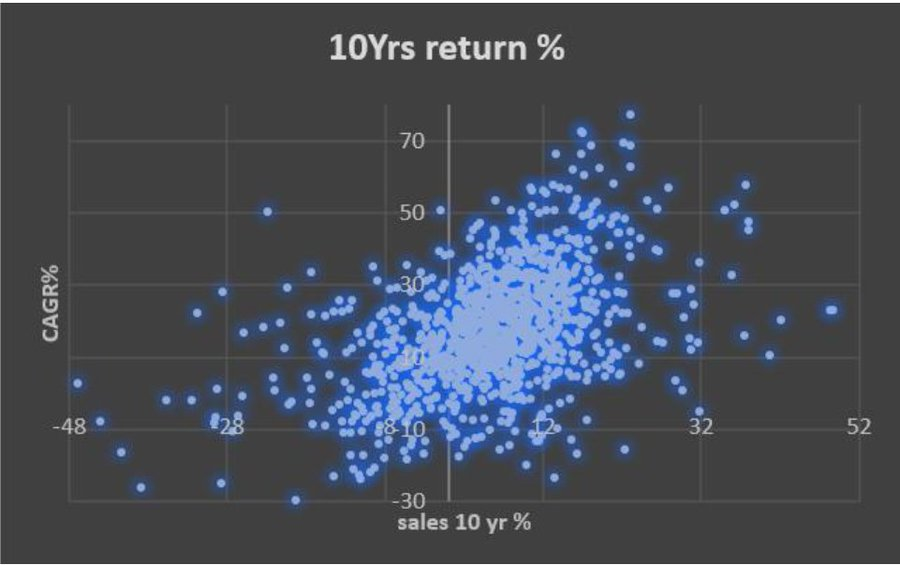
This plot is setting a good tone. As the Sales is growing so is 10-year CAGR.
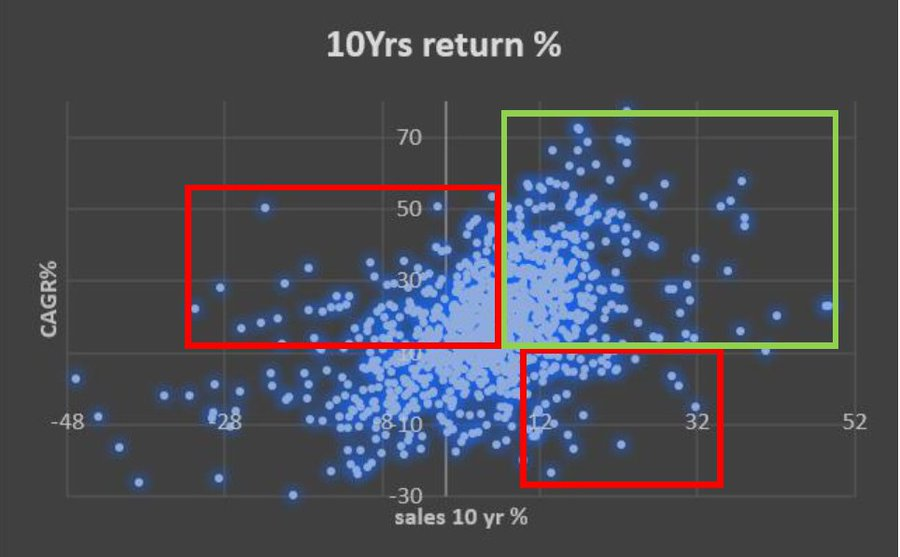
Win areas are in Green. But clearly, this does not follow through, a lot of -ve sale growth co have done well and a lot of good sales growth co have underperformed.
Missed areas are in Red.6/n
Win areas are in Green. But clearly, this does not follow through, a lot of -ve sale growth co have done well and a lot of good sales growth co have underperformed.
Missed areas are in Red.6/n
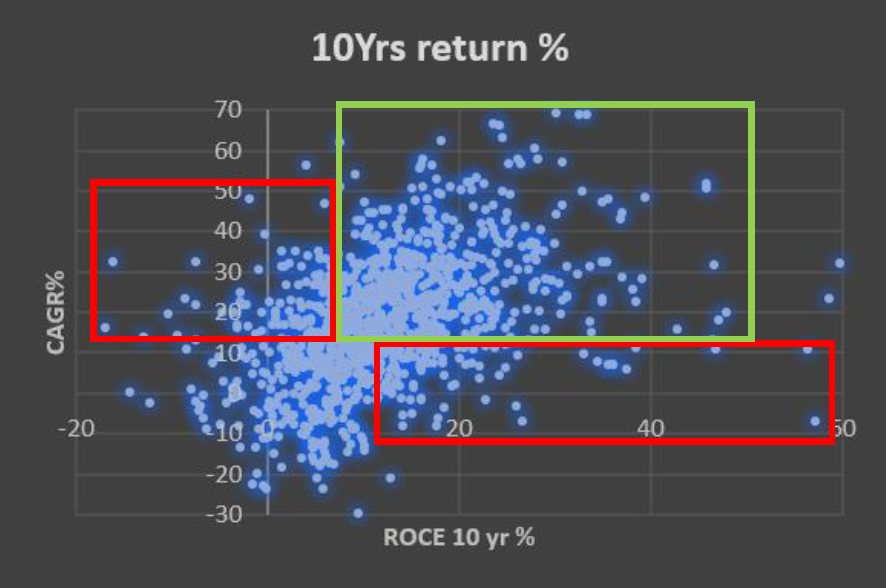
2. 𝑹𝑶𝑪𝑬% 𝒗𝒔 10-𝒚𝒆𝒂𝒓 𝑪𝑨𝑮𝑹 𝒓𝒆𝒕𝒖𝒓𝒏𝒔-
The quality/Effeciency of a company is what is considered the most important aspect of any financial study. 7/n
The quality/Effeciency of a company is what is considered the most important aspect of any financial study. 7/n
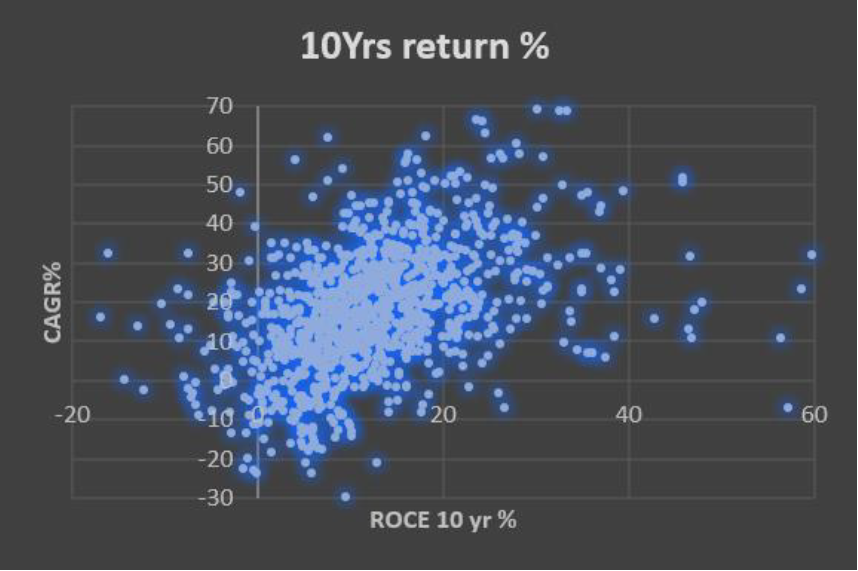
Again a very good parameter. But with a lot of blind spots. Spots where ROCE is high but returns are not and Returns are high despite having less ROCE are highlighted in Red. 8/n
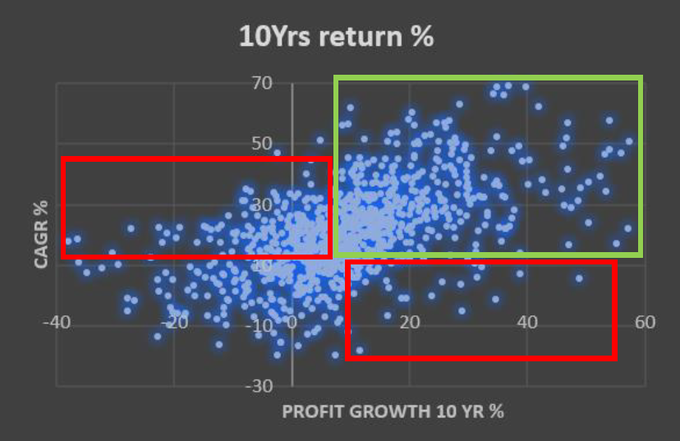
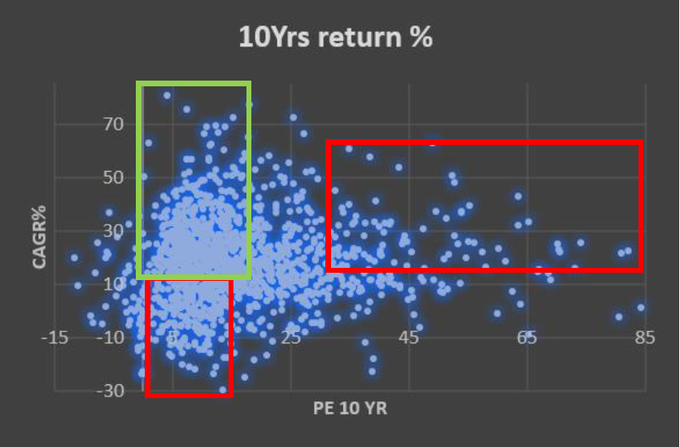
Here are the other Parameter with their wins and loses highlighted. 9/n
𝑷𝒓𝒐𝒇𝒊𝒕 𝑮𝒓𝒐𝒘𝒕𝒉 𝒗𝒔 𝑪𝑨𝑮𝑹
𝑷/𝑬 𝒓𝒂𝒕𝒊𝒐 𝒗𝒔 𝑪𝑨𝑮𝑹
𝑷𝒓𝒐𝒇𝒊𝒕 𝑮𝒓𝒐𝒘𝒕𝒉 𝒗𝒔 𝑪𝑨𝑮𝑹
𝑷/𝑬 𝒓𝒂𝒕𝒊𝒐 𝒗𝒔 𝑪𝑨𝑮𝑹
I compared 30-40 such parameters but I have only reported the good ones (Reasonable Green area).
Moving forward
Some of you might know a famous value investor Joel Greenblat. He used a fusion of Quality and Valuation (magic formula). His ranking system works as following. 10/n
Moving forward
Some of you might know a famous value investor Joel Greenblat. He used a fusion of Quality and Valuation (magic formula). His ranking system works as following. 10/n
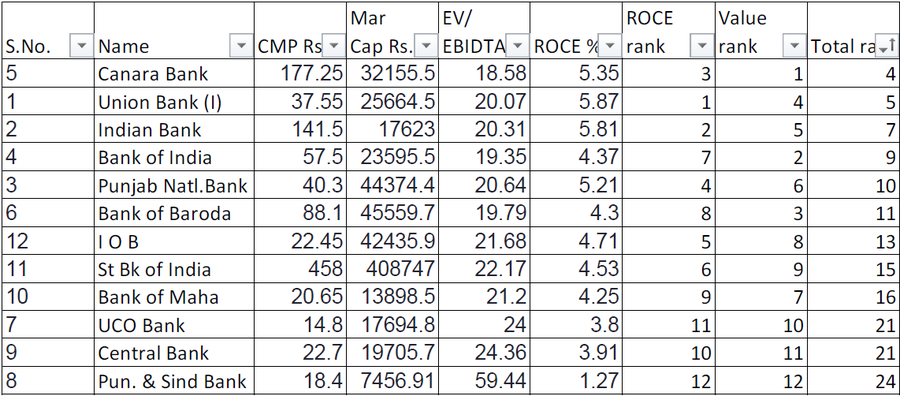
a.Rank all the companies based on ROCE (higher the ROCE better the rank)
b.Rank all the companies based on EV/EBIDTA (Lower the EV/EBIDTA better the rank)
c.Add both ranks, Pick the top ones, do your due diligence and Buy them.
11/n
b.Rank all the companies based on EV/EBIDTA (Lower the EV/EBIDTA better the rank)
c.Add both ranks, Pick the top ones, do your due diligence and Buy them.
11/n
So for illustrative purpose if I want to rank 12 Public sector banks according to magic formula this is how it would look like
12/n
12/n
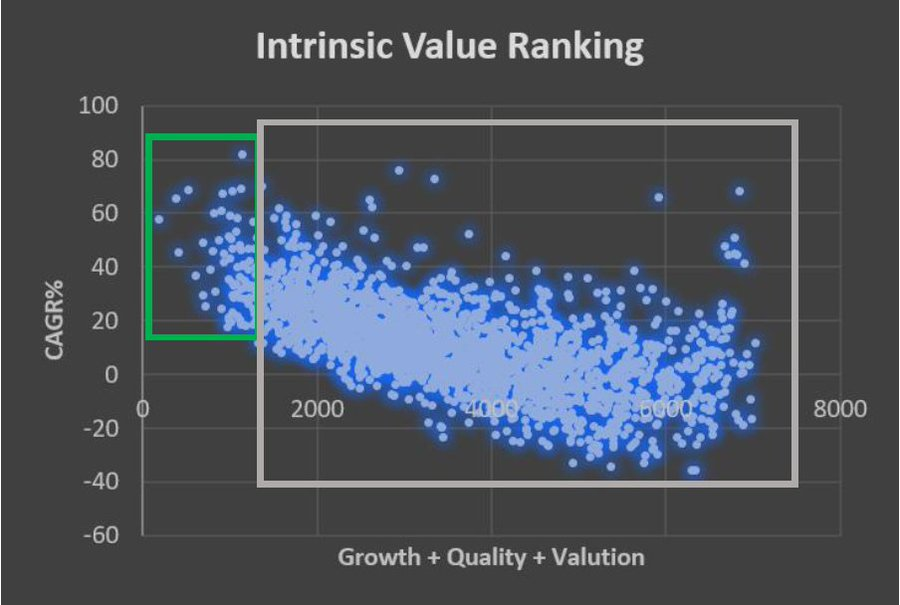
Given below 𝑴𝒂𝒈𝒊𝒄 𝒇𝒐𝒓𝒎𝒖𝒍𝒂 𝒗𝒔 10-𝒚𝒆𝒂𝒓 𝑪𝑨𝑮𝑹 𝒓𝒆𝒕𝒖𝒓𝒏𝒔 for all stocks.
One good thing about ranking systems is that you don’t have to care about low-ranking companies (Grey zone) and their performance. Bcz you wouldnt invest in them anyway. 13/n
One good thing about ranking systems is that you don’t have to care about low-ranking companies (Grey zone) and their performance. Bcz you wouldnt invest in them anyway. 13/n
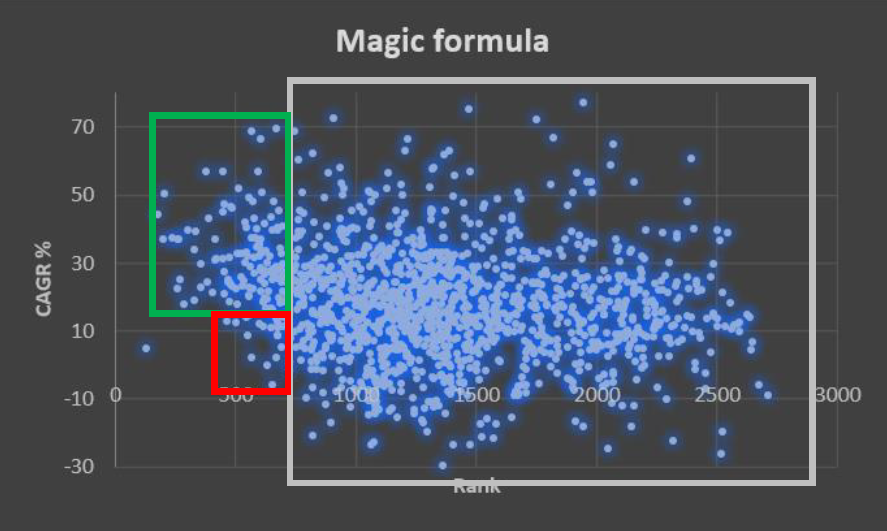
Though I see some of the low-ranking stocks giving 40%+ CAGR also in above plot, I will only focus on the ones with better ranking.
so if I had bought based on this formula I would have the least amount of losers in my PF & some great wealth creators 14/n
so if I had bought based on this formula I would have the least amount of losers in my PF & some great wealth creators 14/n
But let’s face it, we are creating these plots in Hindsight and Estimating future ROCE and returns are next to impossible so a value investor takes a great amount of margin of safety. Thus our end goal is to reduce the Red highlighted portion (loses) close to zero. 15/n
So what can be the other combinations to rank companies and get better outcomes?
𝑮𝒓𝒐𝒘𝒕𝒉 + 𝑸𝒖𝒂𝒍𝒊𝒕𝒚
(16/n)
𝑮𝒓𝒐𝒘𝒕𝒉 + 𝑸𝒖𝒂𝒍𝒊𝒕𝒚
(16/n)
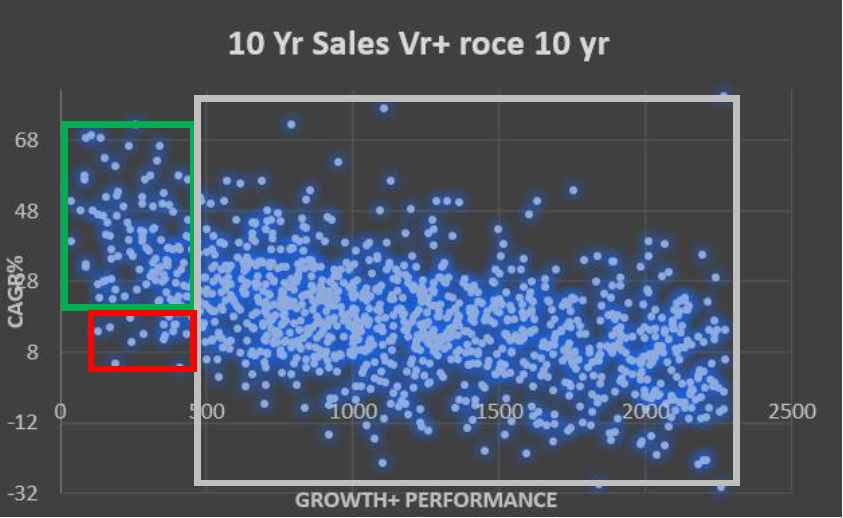
I did such 40-50 combinations where I put 4 growth parameters with 3 quality and 4 Valuation parameters (shown in start of thread) in pair of 2s and then 3s to get better picture.
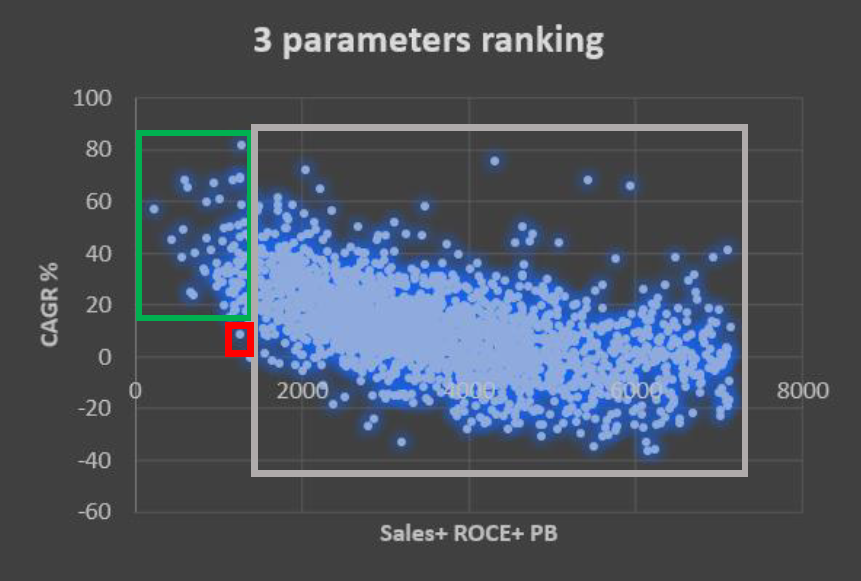
One combination that intrigued me is
𝑺𝒂𝒍𝒆𝒔 𝒈𝒓𝒐𝒘𝒕𝒉
𝑹𝑶𝑪𝑬
𝑷/𝑩 𝒓𝒂𝒕𝒊𝒐
17/n
One combination that intrigued me is
𝑺𝒂𝒍𝒆𝒔 𝒈𝒓𝒐𝒘𝒕𝒉
𝑹𝑶𝑪𝑬
𝑷/𝑩 𝒓𝒂𝒕𝒊𝒐
17/n
Results were excellent not only 95% of the stocks were beating the market but also 50% of them were above 40% CAGR. The top 50 stocks average CAGR was 37% (18/n)
If i add a secret ingredient called Due diligence the Average returns are 40.7% CAGR.
40.7% CAGR means investments will become 30X in 10 years.
Portfolios giving Such returns are extraordinary. (19/n)
40.7% CAGR means investments will become 30X in 10 years.
Portfolios giving Such returns are extraordinary. (19/n)
As I have already mentioned these plots are made in Hindsight, a value investor does not rely on Back-testing results.
So I decided to forward test it for the next 3 years in 2018.
I extracted the below data and started my ranking.
3-year sales growth
3-year ROCE
PB ratio
(20/n)
So I decided to forward test it for the next 3 years in 2018.
I extracted the below data and started my ranking.
3-year sales growth
3-year ROCE
PB ratio
(20/n)
The CAGR of the first 50 stocks is 73%
Now this is EXTRA ORDINARY
It does include returns from 20-21 Bull market, but 19-21, the Nifty was up by 17.5% CAGR and these stocks by 73% CAGR so even if the market doesn’t give any returns over next 2-3 years....
21/n
Now this is EXTRA ORDINARY
It does include returns from 20-21 Bull market, but 19-21, the Nifty was up by 17.5% CAGR and these stocks by 73% CAGR so even if the market doesn’t give any returns over next 2-3 years....
21/n
Expecting 15-18% would not be asking too much.
Also penny stocks were not excluded from this study deliberately bcz 10 yr is a long horizon ,many stks became penny stocks to mid caps and mid cap to penny cap in this time period.
22/n
Also penny stocks were not excluded from this study deliberately bcz 10 yr is a long horizon ,many stks became penny stocks to mid caps and mid cap to penny cap in this time period.
22/n
Though we improvised the formula to suit for our requirement of value investing.
Now we rank companies which belong to sectors which are undervalued and less talked about.
We use this at everyday basis at "Intrinsic Value Equity advisors"
23/n
Now we rank companies which belong to sectors which are undervalued and less talked about.
We use this at everyday basis at "Intrinsic Value Equity advisors"
23/n
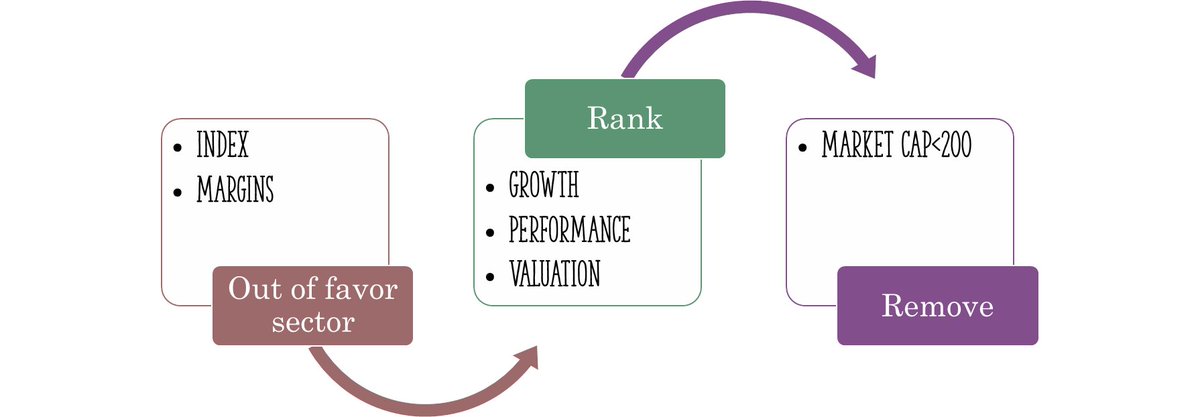
Summary-
1. Find Non Hot/Down cycle sectors.
2.Rank the companies based on Growth+ performance+ Valuation
3 Remove companies having history lesser then 7 years and Mcap <200 Cr
4 Do your due diligence.
24/24
Thanks for reading Do Retweet with others.
1. Find Non Hot/Down cycle sectors.
2.Rank the companies based on Growth+ performance+ Valuation
3 Remove companies having history lesser then 7 years and Mcap <200 Cr
4 Do your due diligence.
24/24
Thanks for reading Do Retweet with others.
Loading suggestions...