

1/19
There's a single tool that I haven't stopped using for probably over a year, and that's volume profile.
I don't use it too much either, but it plays a fundamental role in my market perspective.
Let's dive in with a trade example.
There's a single tool that I haven't stopped using for probably over a year, and that's volume profile.
I don't use it too much either, but it plays a fundamental role in my market perspective.
Let's dive in with a trade example.
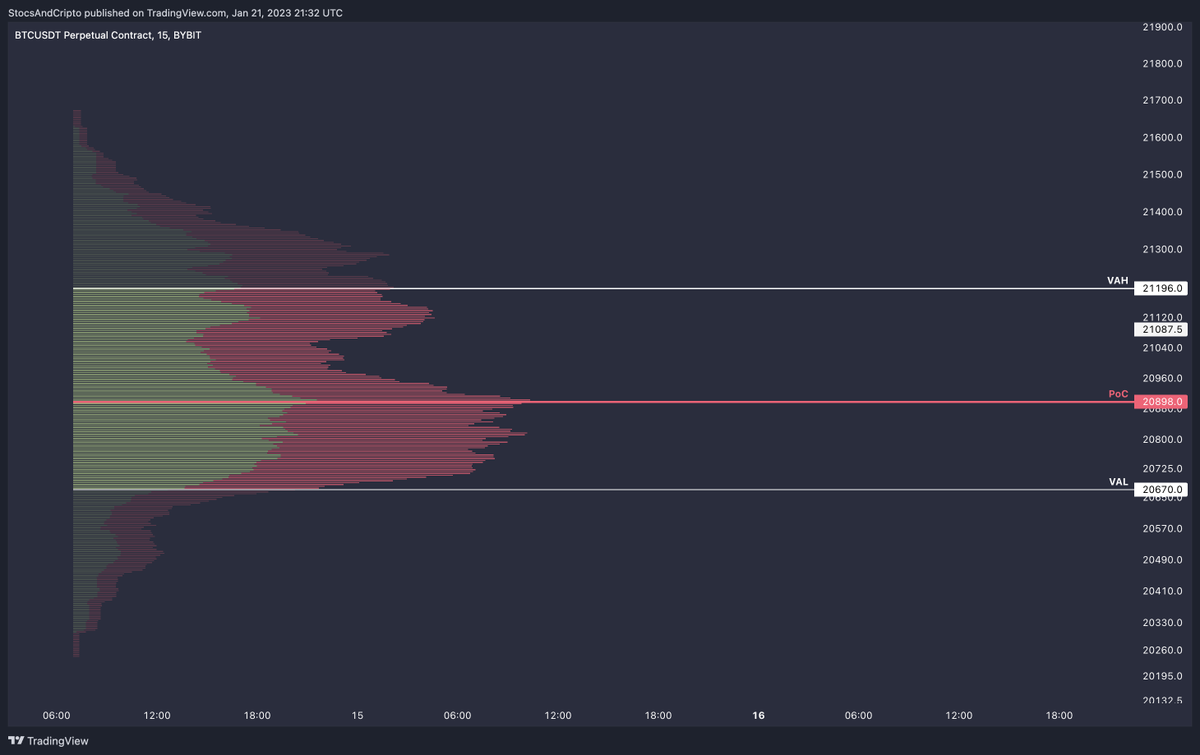
So first, I need to introduce the concept of volume profile.
Put in a simple way, it's just like a normal volume indicator, just that it measures it by price instead of by time. There's no more essence to the definition.
Inside the profile, you can find two main things:
Put in a simple way, it's just like a normal volume indicator, just that it measures it by price instead of by time. There's no more essence to the definition.
Inside the profile, you can find two main things:
Point of Control (PoC): price where most of the volume was traded at.
Value Area (VA): represents 1 standard deviation (STD) from the PoC. This figure is about 70% of the total volume. Since VA is a range, it has a high (VAH) and a low (VAL).
Value Area (VA): represents 1 standard deviation (STD) from the PoC. This figure is about 70% of the total volume. Since VA is a range, it has a high (VAH) and a low (VAL).
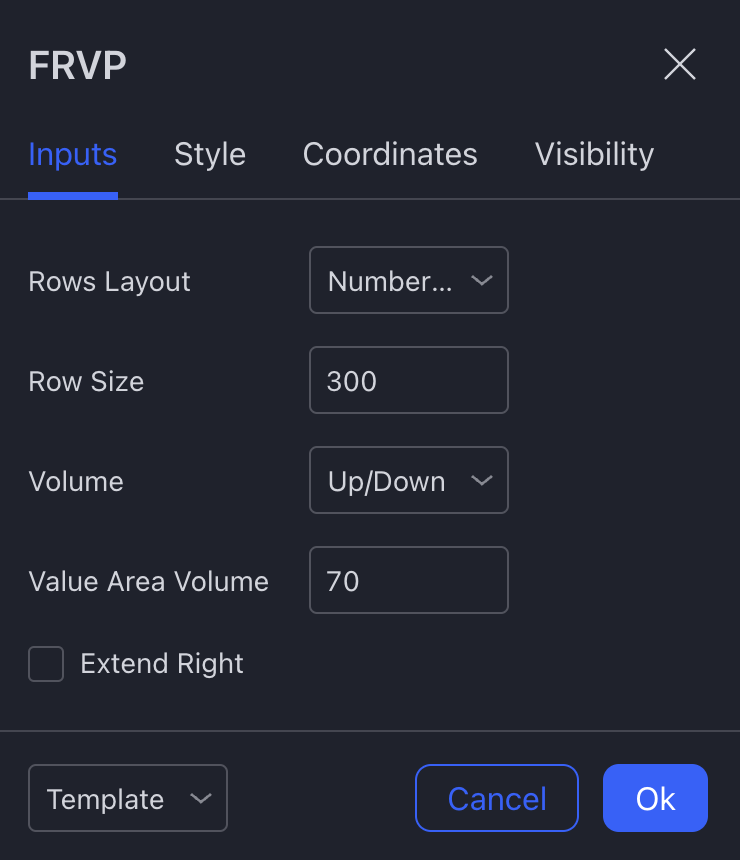
Before anything else, if you're using volume profile on TV, please change the row settings to something that shows more detail (default is 24)
Also, don't search for it in indicators, but in drawings.
Also, don't search for it in indicators, but in drawings.
Now that the base is clear, it's time to go into details. There are two particular scenarios in which I see myself using it the most, so as I do with all my educational content, I'll comment on those:
1. Ranges. Unlike VWAP (for example), ranges are perfect for volume profile
1. Ranges. Unlike VWAP (for example), ranges are perfect for volume profile
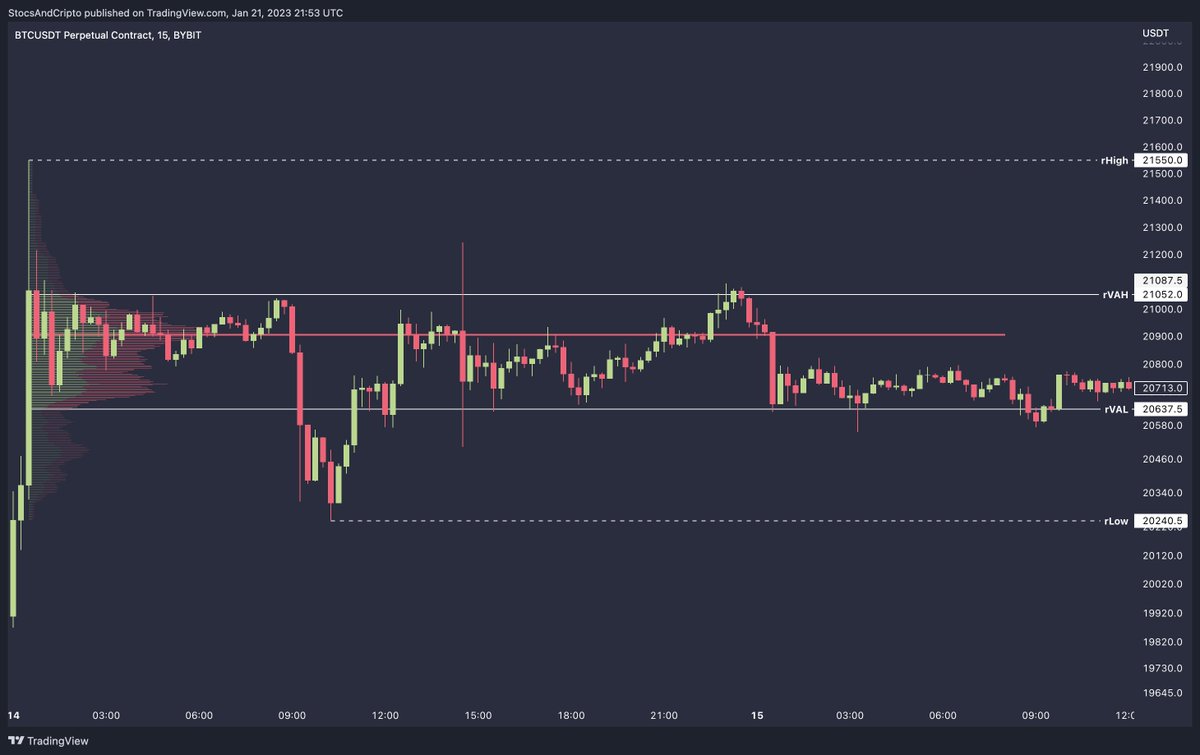
[Remember to use confluence for your trades]
Whether it's on lower or higher timeframe, after a strong impulse (either up or down) there's always a consolidation.
Before doing anything, wait until a high/low are set. Chart below meets these requirements:
Whether it's on lower or higher timeframe, after a strong impulse (either up or down) there's always a consolidation.
Before doing anything, wait until a high/low are set. Chart below meets these requirements:
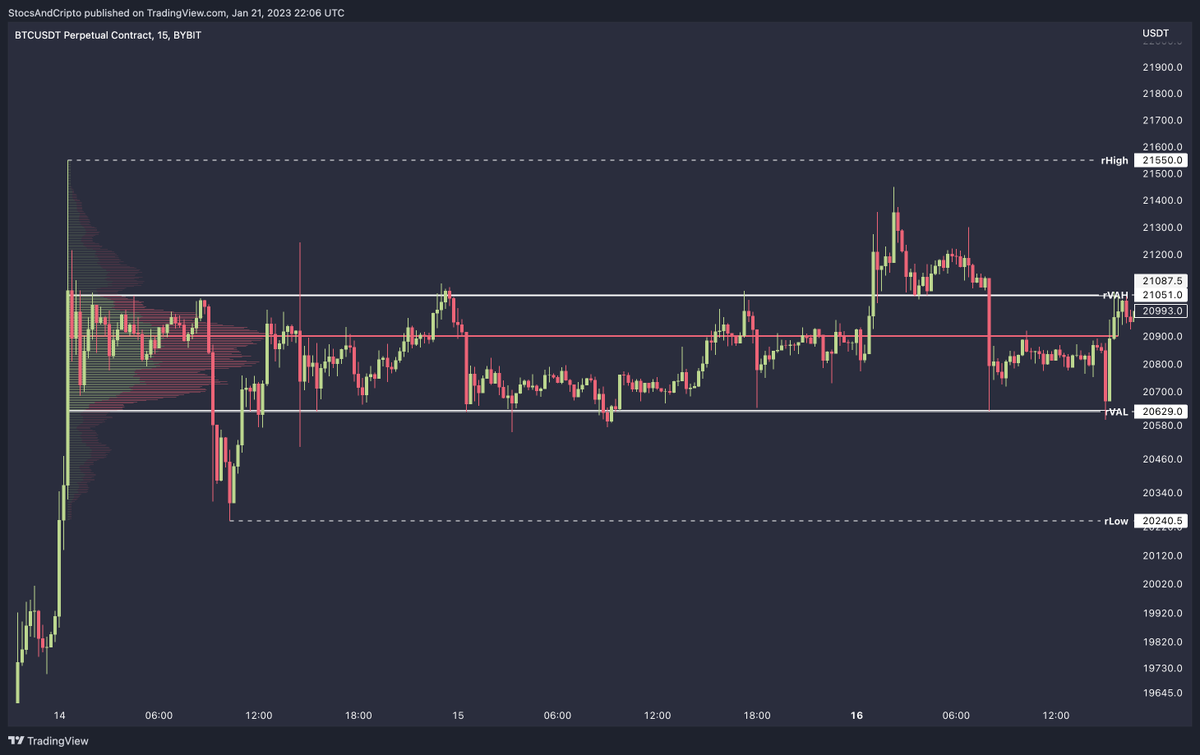
![[Remember to use confluence for your trades]
Whether it's on lower or higher timeframe, after a str...](https://pbs.twimg.com/media/FnB-_IZXwAAYvvf.jpg)
Inside the range, VA represents a small part. There haven't been deviations from it besides high/low formation.
Here you look for breaks on any side and trade a reversion back to VA.
Here you look for breaks on any side and trade a reversion back to VA.
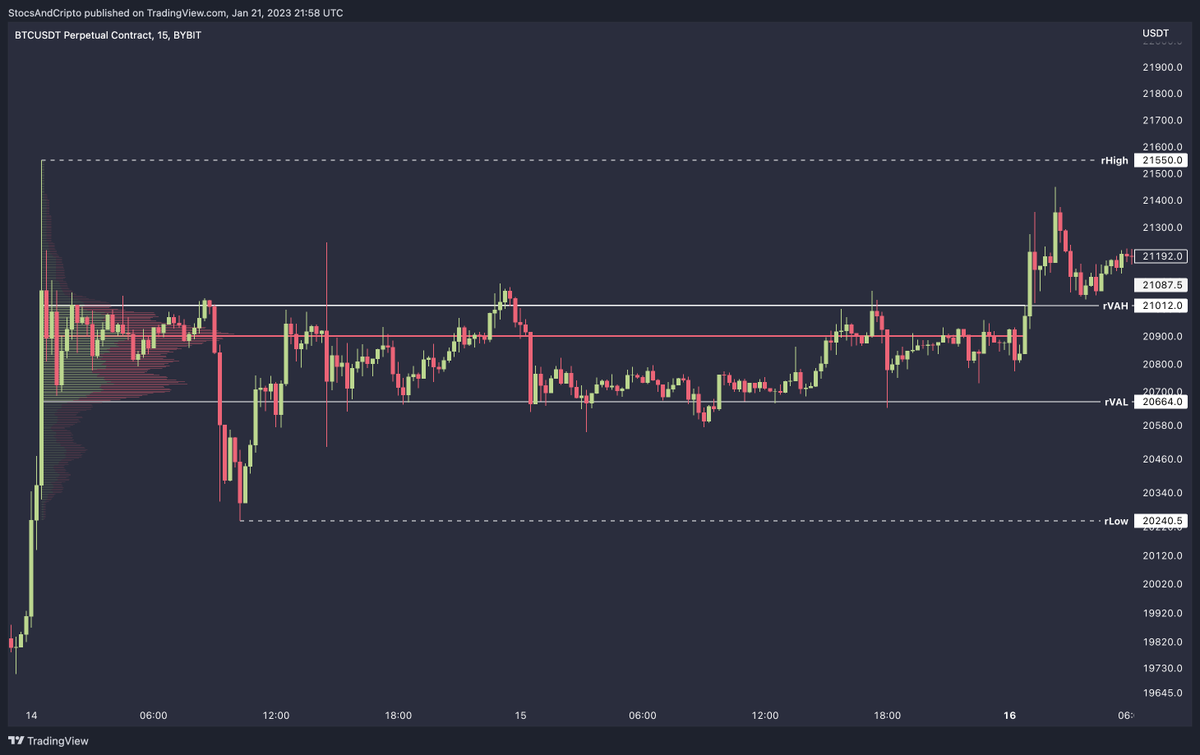
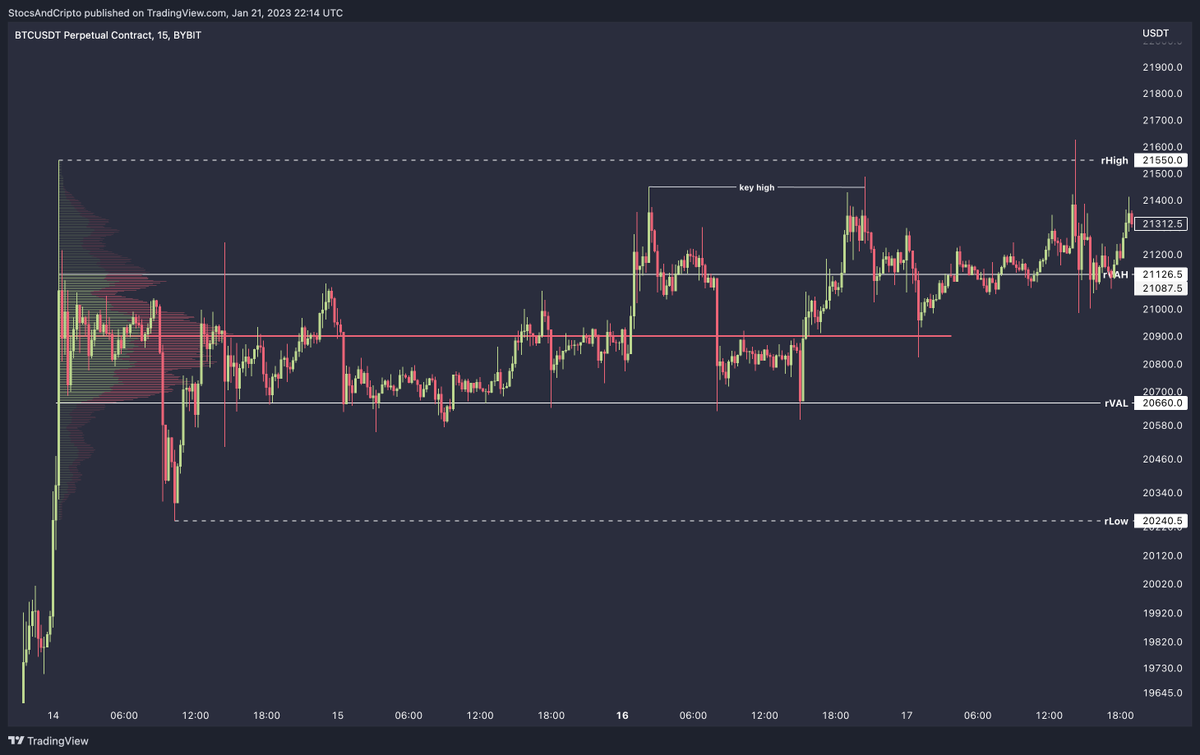
Here VAH broke, I re-anchored the VP until present and looking for an entry. Here you can use any other criteria —maybe a momentum cease on lower timeframe— to enter.
As TP1 you can use PoC, VAH as TP2 and rHigh break as SL
As TP1 you can use PoC, VAH as TP2 and rHigh break as SL
After price reached VAL again, it still shows support. Maybe there's a strong uptrend cooking? Wrong. From what I've seen, price tends to go after both sides before choosing continuation or reversal.
Next potential trade would be looking for a sweep of the previous high. That gives a nice short which hits TP1 at PoC, but not TP2. Now you see even clearer uptrend and eventually the range high is swept.
Open another short, this time it goes against you and your TP is not hit.
Open another short, this time it goes against you and your TP is not hit.
> Key observation here: resistance is first at VAL, then at PoC and finally at VAH, basically it scales up. I've seen this multiple times.
Back to the chart, you're left with a uptrend inside the range, lows are barely swept, until you get a massive candle down.
Back to the chart, you're left with a uptrend inside the range, lows are barely swept, until you get a massive candle down.

Now most lows are cleared (expect rLow) and price trades again above VAL. At this point you just wait for a break on either side or a sweep of rLow
Until then, you can trade from VAL to VAH and vice versa as well
Until then, you can trade from VAL to VAH and vice versa as well
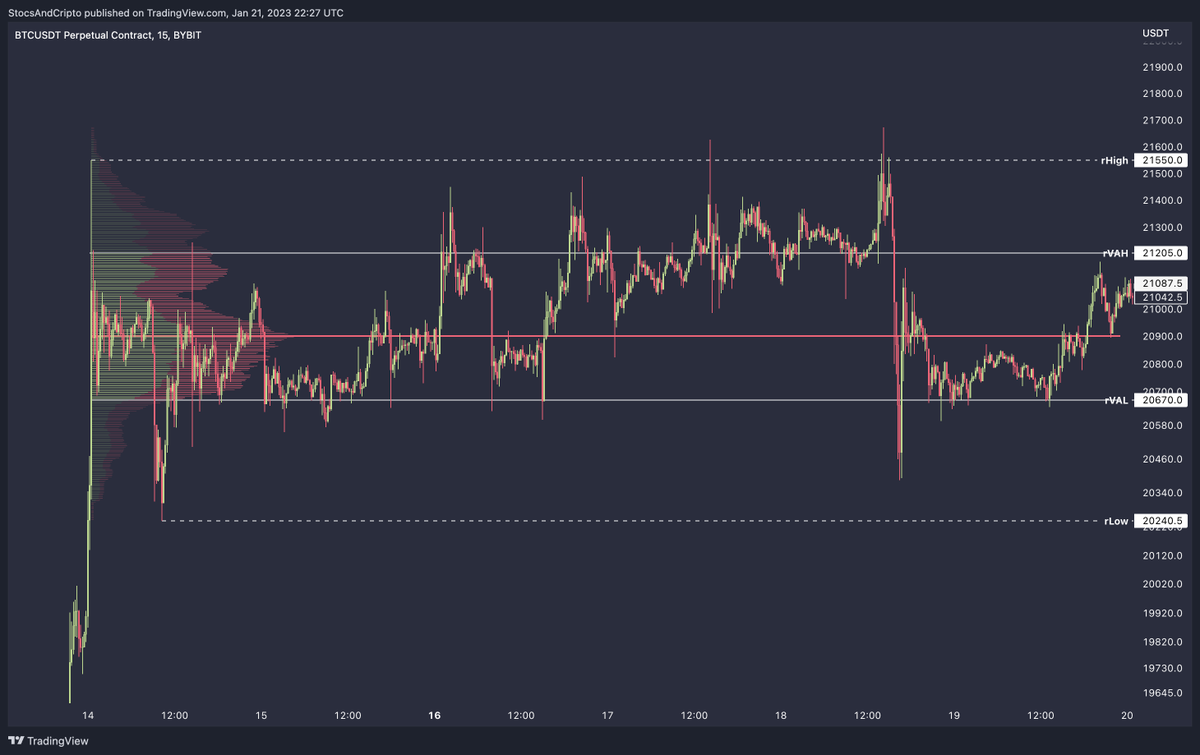
But you actually trade from VAL to VAH when there is less volume outside the value area itself (like at the start of the range)
I'd just stay flat and wait for the next move to ride momentum.
I'd just stay flat and wait for the next move to ride momentum.
So bulls woke up and chose violence on this one. Now you just anchor your profile from start to end and take the only value that matters now: PoC
This brings me to point 2 of my use cases
This brings me to point 2 of my use cases
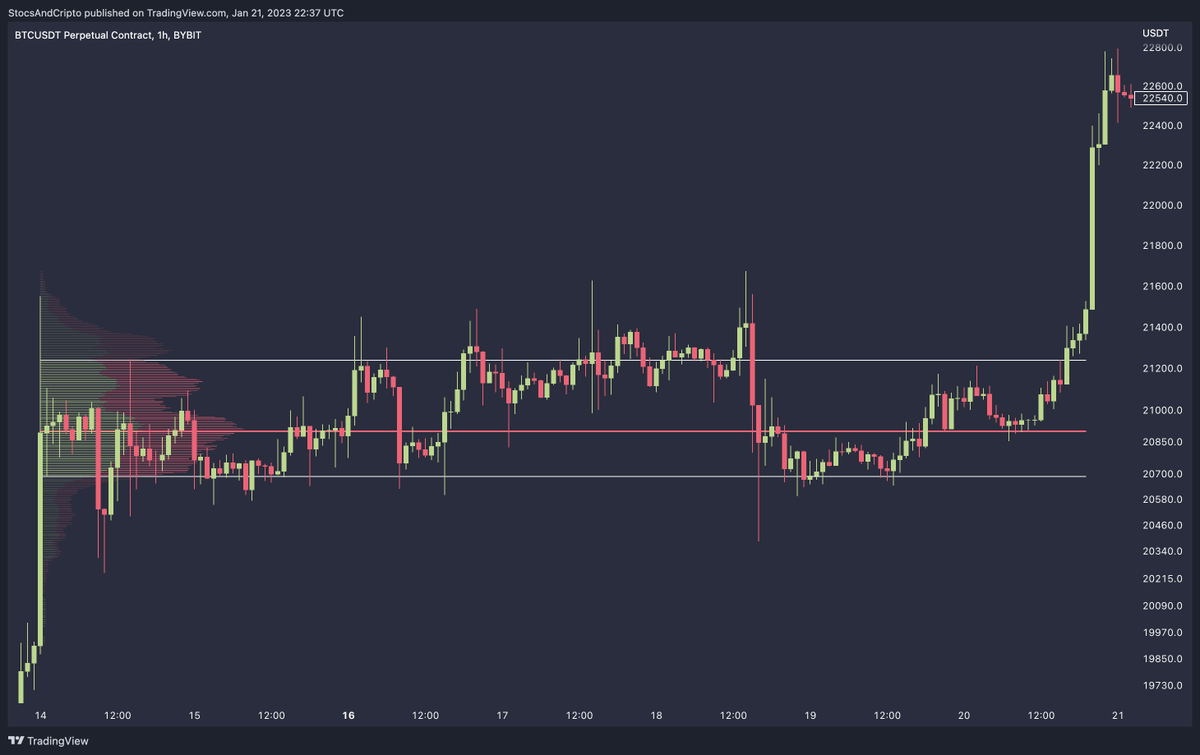
2. Naked PoC (nPoC)
> If a PoC is not hit after the anchor period, it's a naked PoC. When it's retested, the nPoC is invalidated.
So when the range broke up, a nPoC was intrinsically created. This is more mechanical than trading just ranges, and also what I use more personally.
> If a PoC is not hit after the anchor period, it's a naked PoC. When it's retested, the nPoC is invalidated.
So when the range broke up, a nPoC was intrinsically created. This is more mechanical than trading just ranges, and also what I use more personally.
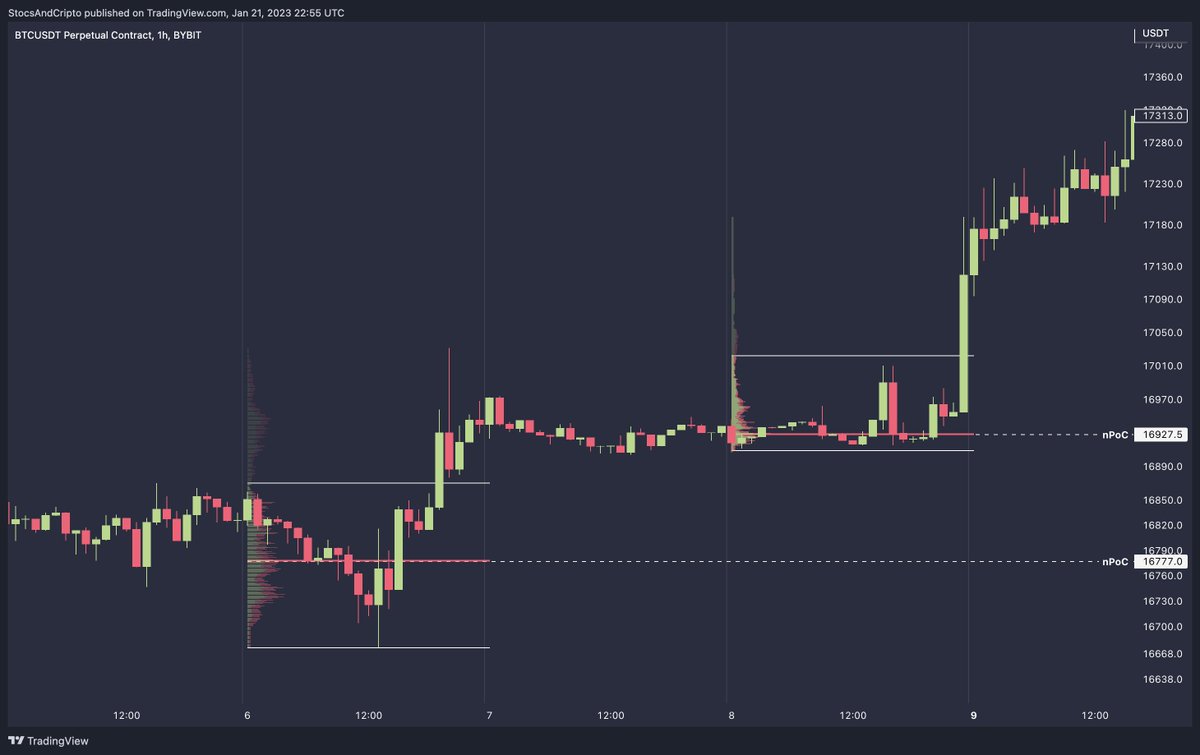
The only thing is, I don't actually anchor VP to ranges to find nPoCs to trade. I anchor it to sessions instead (0:00 UTC to 0:00 UTC next day in crypto)
You can see here how I anchored it to two sessions which resulted in nPoCs.
You can see here how I anchored it to two sessions which resulted in nPoCs.
Most of the time, and especially the older ones, give insanely accurate reactions (see this Tweet posted during FTX collapse which nailed 15.3k local low)
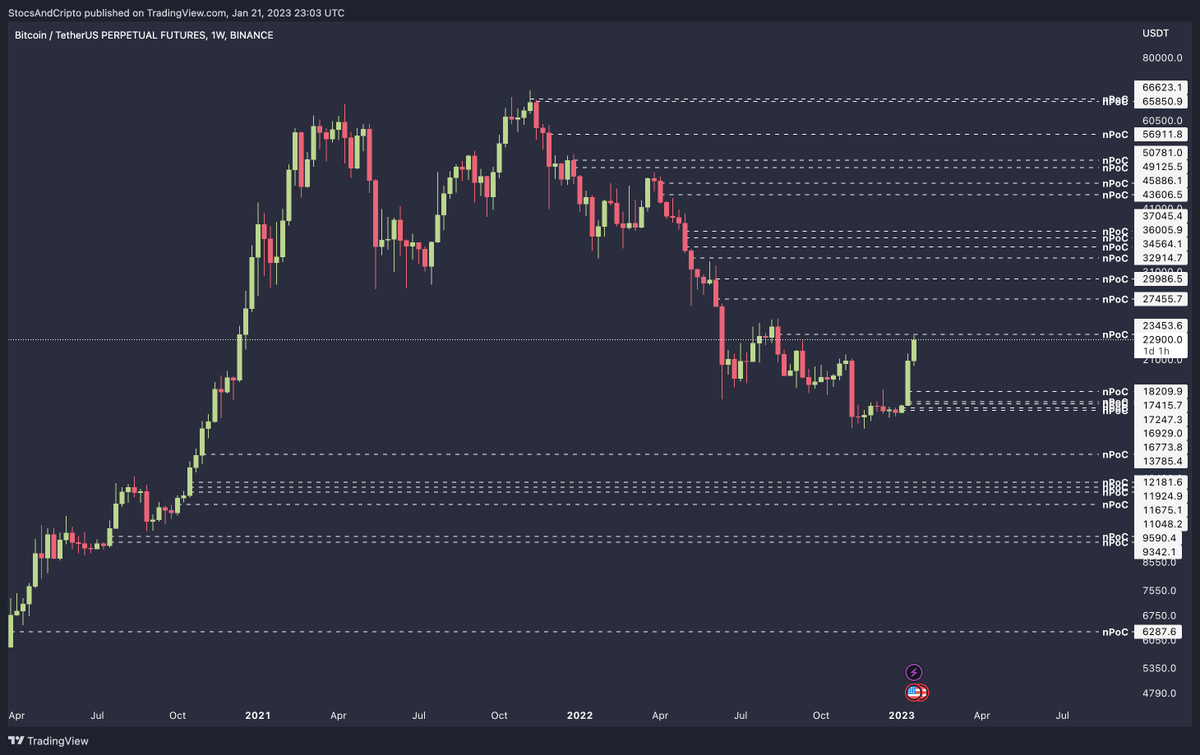
And for BTC, I have marked every single from all the way down to 9k to ATH.
And for BTC, I have marked every single from all the way down to 9k to ATH.
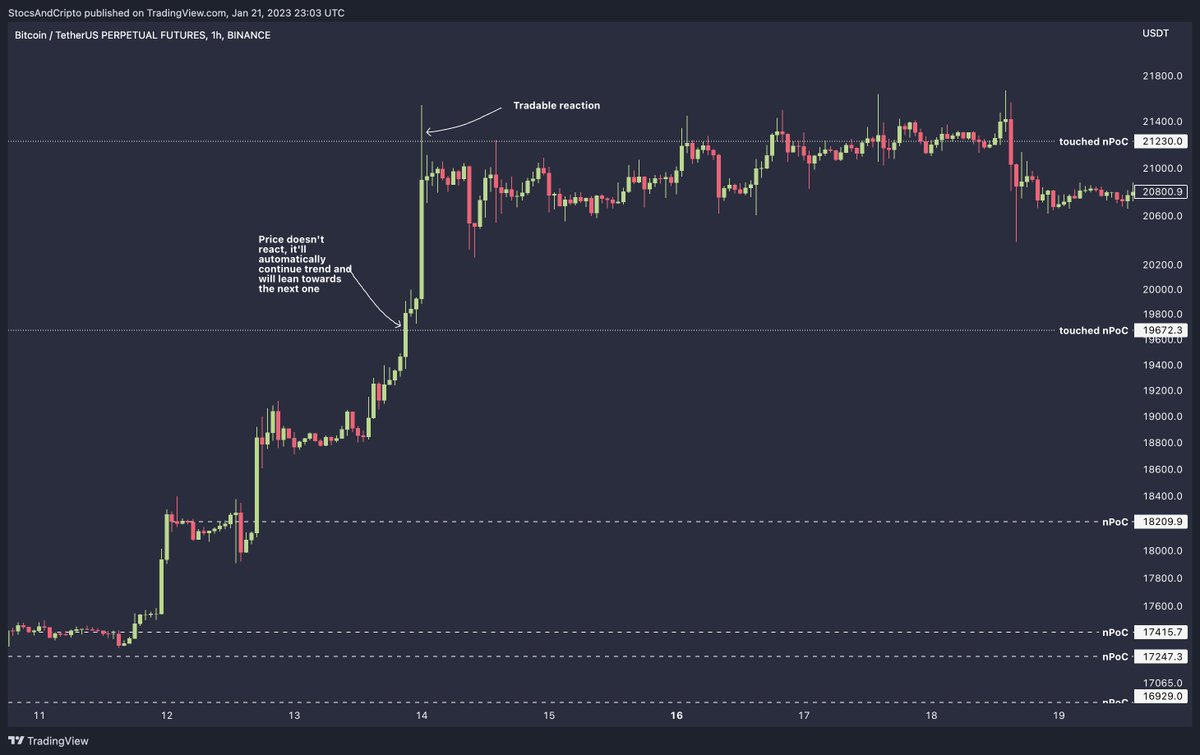
Rules are also really simple:
- Trade rejection with tight stops, better if there's a wick above the nPoC like in the example
- If there's no reaction, ride momentum until the next nPoC
- After the nPoC is tested, it's not valid anymore
There's no more to it
- Trade rejection with tight stops, better if there's a wick above the nPoC like in the example
- If there's no reaction, ride momentum until the next nPoC
- After the nPoC is tested, it's not valid anymore
There's no more to it
Of course, when there are many nPoCs around the same price, it can be harder to determine which one will act as HTF support/resistance
I can probably conclude this thread here. Would appreciate a like/RT and as always, my DMs are open for doubts etc.
I can probably conclude this thread here. Would appreciate a like/RT and as always, my DMs are open for doubts etc.
Loading suggestions...