

The thread about the SFP/Sweeps ( got some nice positive feedback so let's have a talk about another extremely popular and misunderstood trading concept.
Orderblocks, Supply and Demand Blocks, Clusters, and so on.
/cont
Orderblocks, Supply and Demand Blocks, Clusters, and so on.
/cont
Why do these work? If anything, the "smart money" trapping retail traders logic is nothing more than a marketing trick. The reality of it is much more boring, but it was tested and proven.
The research paper "Why is equity order flow so persistent?" tested these reactions and came up with two major explanations. You can read the whole thing here - arxiv.org

Order splitting - The main reason why these work, large players use the same areas for resting orders, as they are not able to position to the moves in one go due to their large size.
Herding - people seeing the same reaction and follow the price (minor cause)
Herding - people seeing the same reaction and follow the price (minor cause)
In the simplest way, we can validate these areas using something like a volume profile. As you can see the "orderblock" happened at the area where the most volume was traded on the down leg.
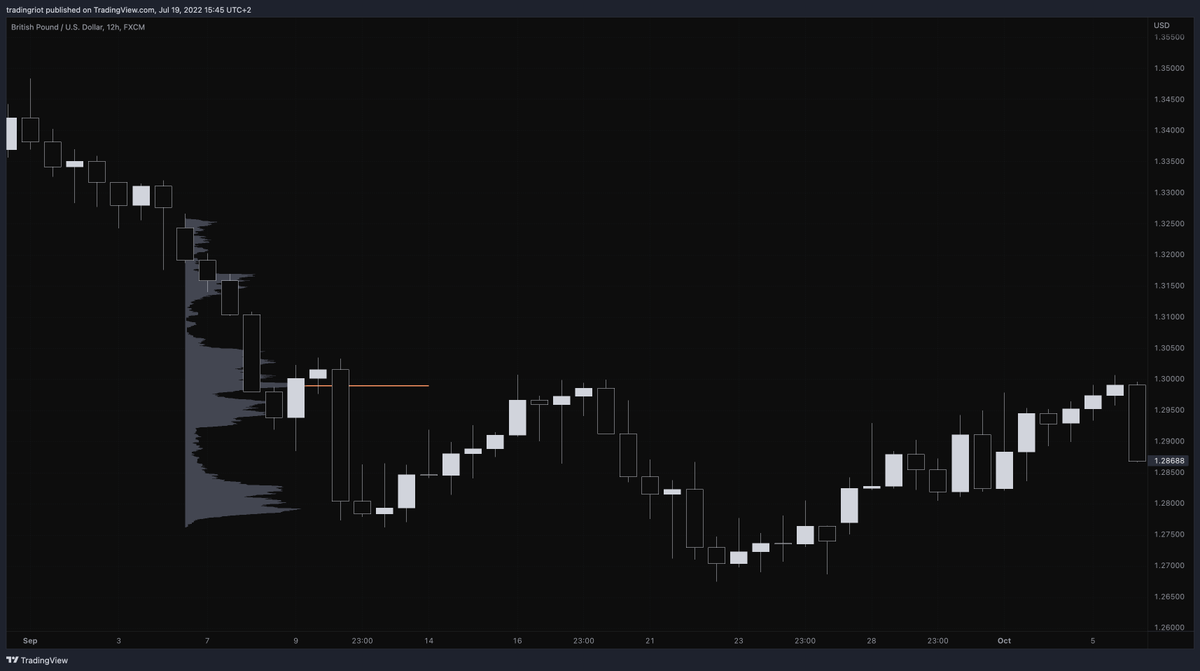
In other words, a lot of contracts changed hands, and there are still unfilled orders from large players that initiated the continuation lower, and they will defend their positions on the retest.
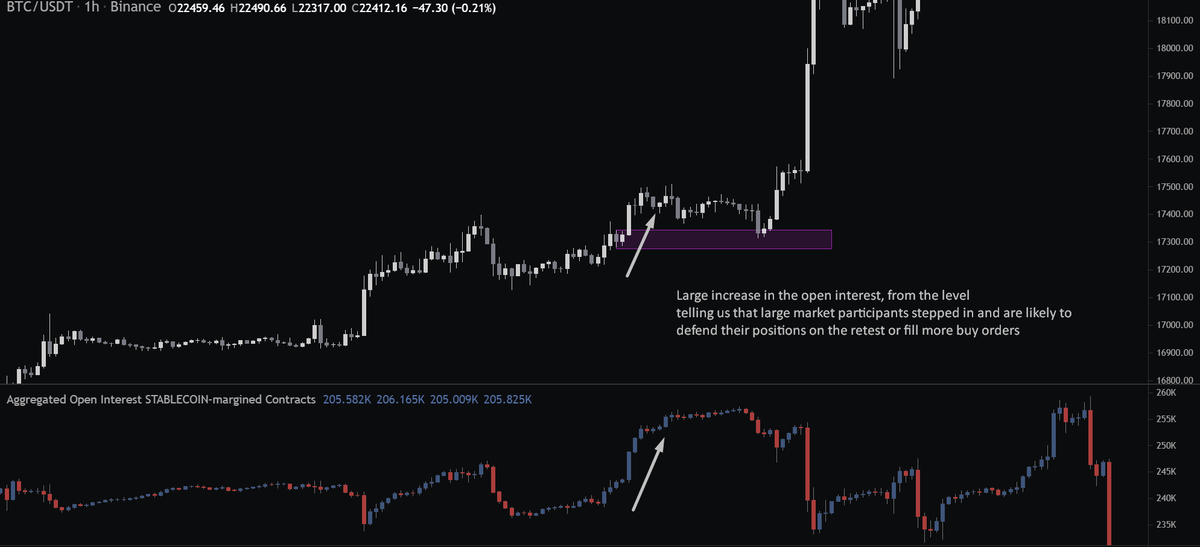
If you want to dig a little deeper, the orderflow is a great tool to do it. As you can see we had a high rise of open interest telling us large buyers stepped in, on retest they fill more of their orders and also defend their positions.
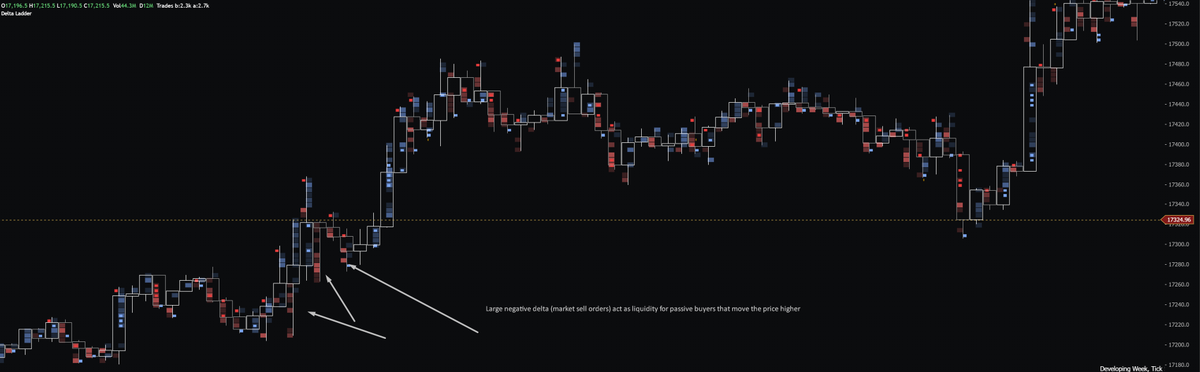
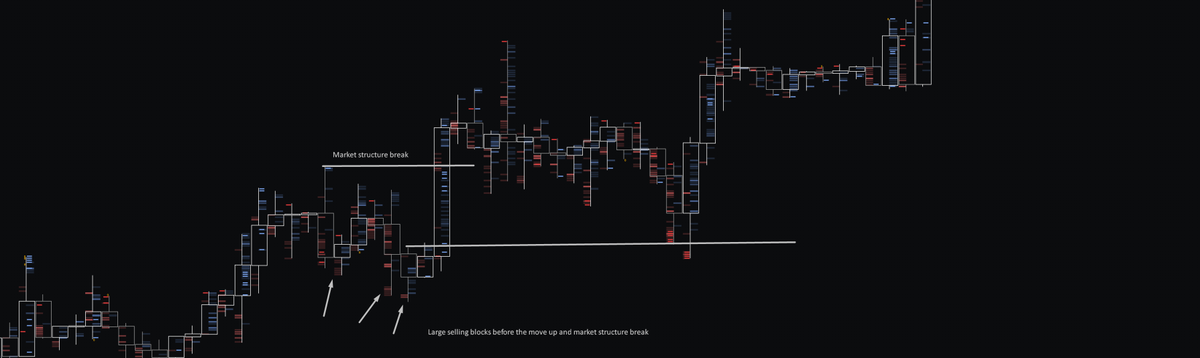
So why is there a down candle before the up move and vice versa? Well, if you are a large trader, you do not smack market orders left and right. That would be a very dumb and expensive way of doing things. You need to execute in areas where you find a sufficient counterparty.
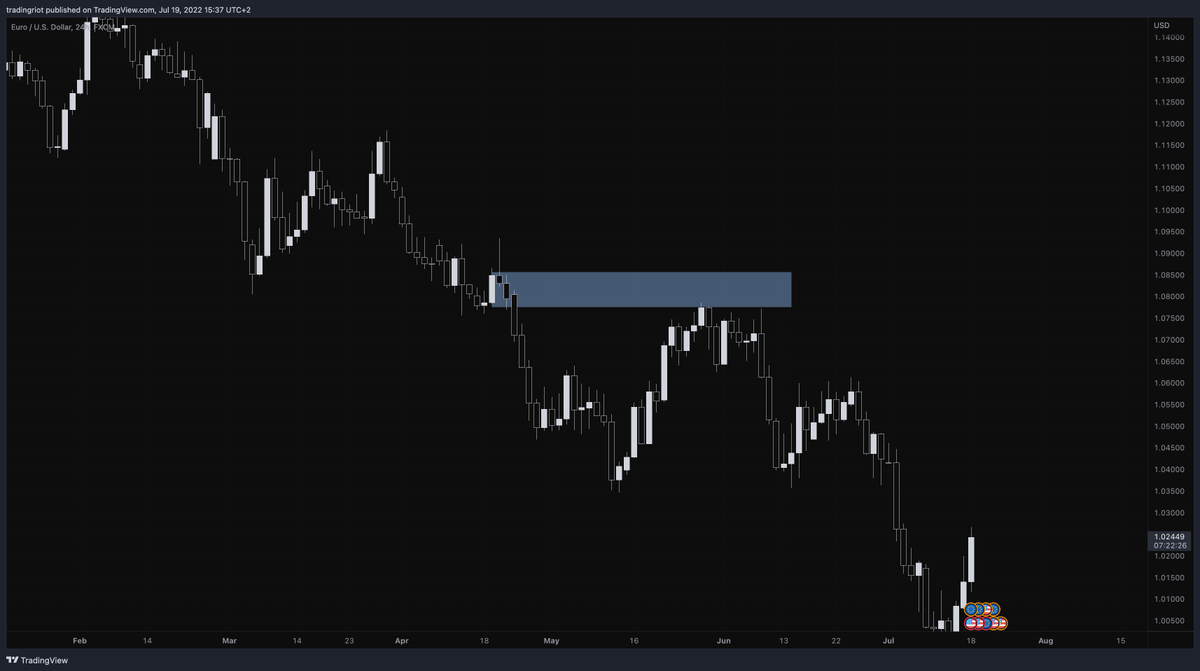
For people who use price action solely, the market structure break is a key factor for a valid orderblock.
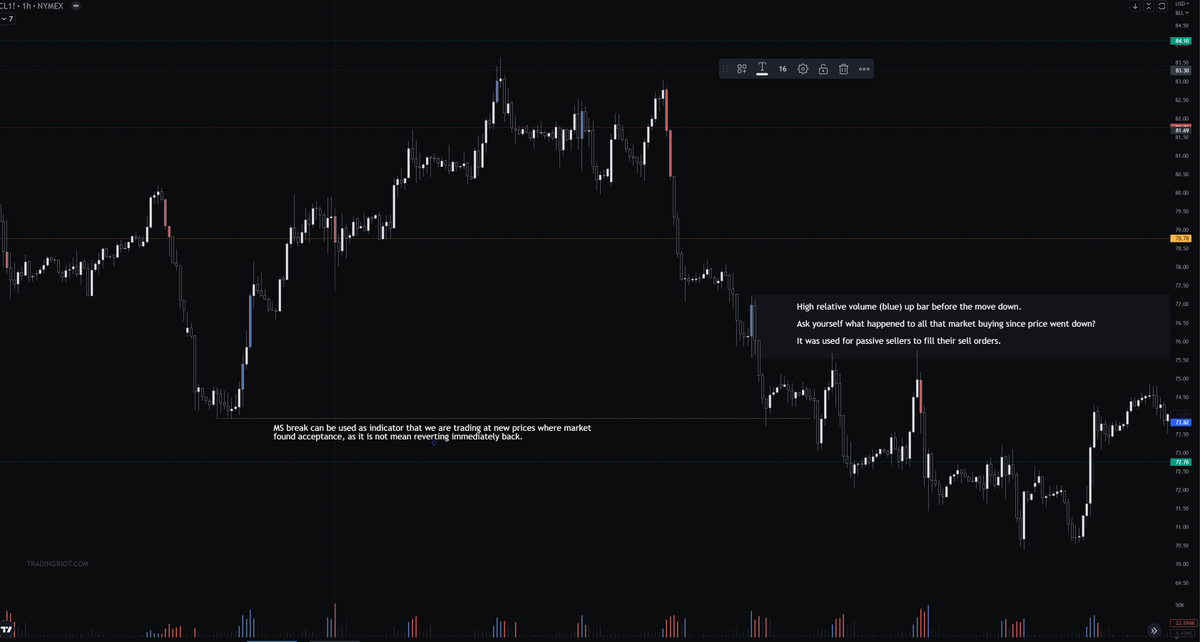
In my opinion, the market structure break is not that relevant and can sometimes be subjective. It mostly tells us that the market traded to new prices and found acceptance
In my opinion, the market structure break is not that relevant and can sometimes be subjective. It mostly tells us that the market traded to new prices and found acceptance
But it can be a simple validation of your idea. One of the simplest and my favourite tools is a relative volume that colours candles based on volume above std deviation.
This is the easiest way of finding areas with high participation, I use free indicator by @Koalafied3 on TV.
This is the easiest way of finding areas with high participation, I use free indicator by @Koalafied3 on TV.
That is kinda it for the thread, to sum things up.
There is no magic manipulation behind the price moves. It is all about following the increase in market participation and especially among larger players.
There is no magic manipulation behind the price moves. It is all about following the increase in market participation and especially among larger players.
Using things such as Volume, Footprint charts, or Open Interest can be a great help.
You can learn more about these on my blog which is free at tradingriot.com
You can learn more about these on my blog which is free at tradingriot.com

If you are interested in which of these I actually trade and what my rules are for location, structure and execution, you can pick up the Bootcamp tradingriot.com

If you found this useful, RT is always appreciated and let me know if there are any other popular concepts you would like to get covered next.
Loading suggestions...