

Let’s look at a few notable bear markets and see how they compare to today's market. First up, the Great Recession (2007-09): 🧵
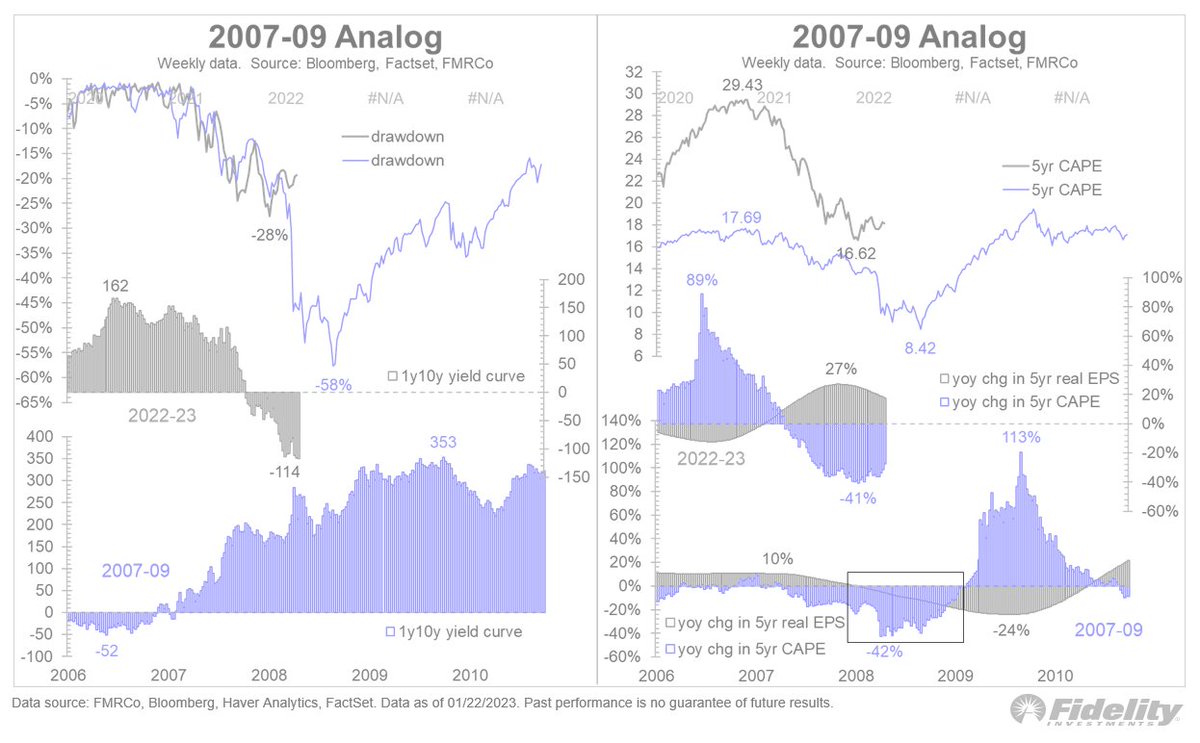
This was a double whammy of declining earnings and contracting multiples, both happening concurrently. This is highlighted in the box at the bottom right. It is literally the worst-case outcome, and it produced a 57% decline. /2
The price analog is a little scary to say the least, and hopefully the similarities end here. If they don’t, earnings would have to fall off a cliff right about now. /3
Next up is the 1946-49 cycle, which has been a favorite price analog of mine. Earnings accelerated after the initial low (even in real terms), but it was more than offset by ongoing P/E compression. /4
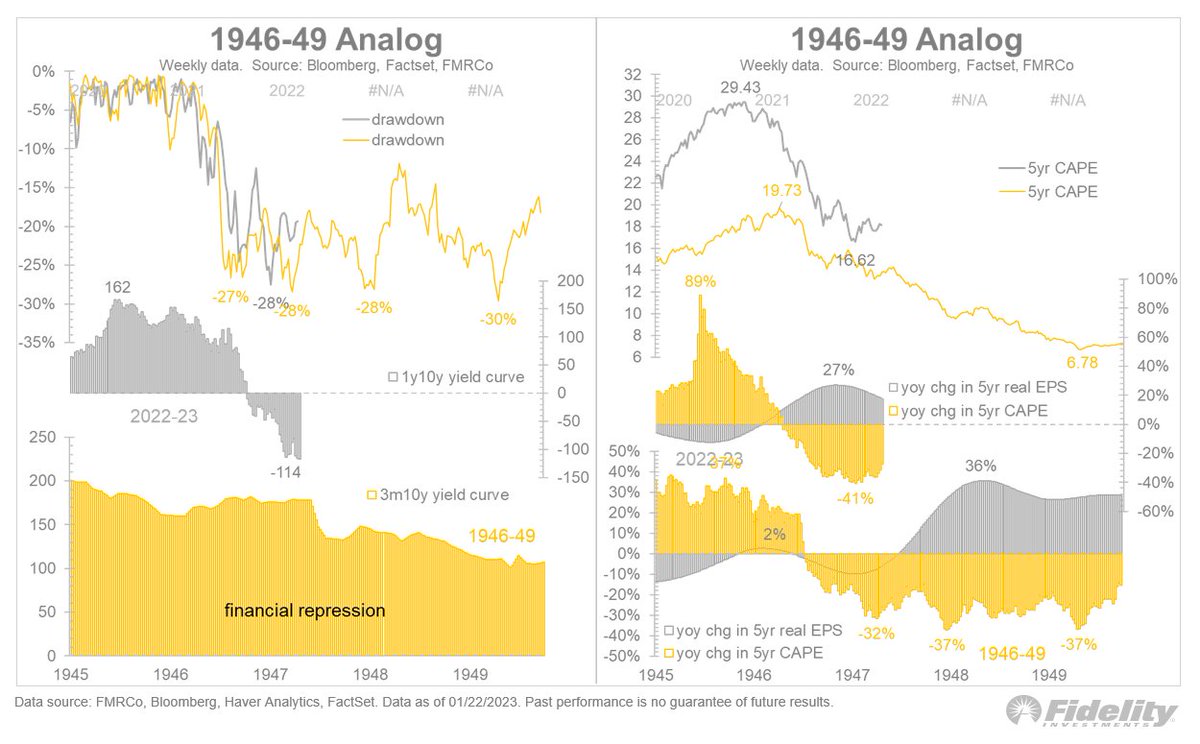
As good as the 1946-49 price analog has been, an imminent acceleration in earnings growth offset by more derating seems like an unlikely outcome for this cycle. /5
Next up, 1973-74, which also boasts a compelling price analog. The cycle was marked by Fed tightening and produced a 47% decline over 20 months, even though earnings were growing (including in real terms) the entire time. /6
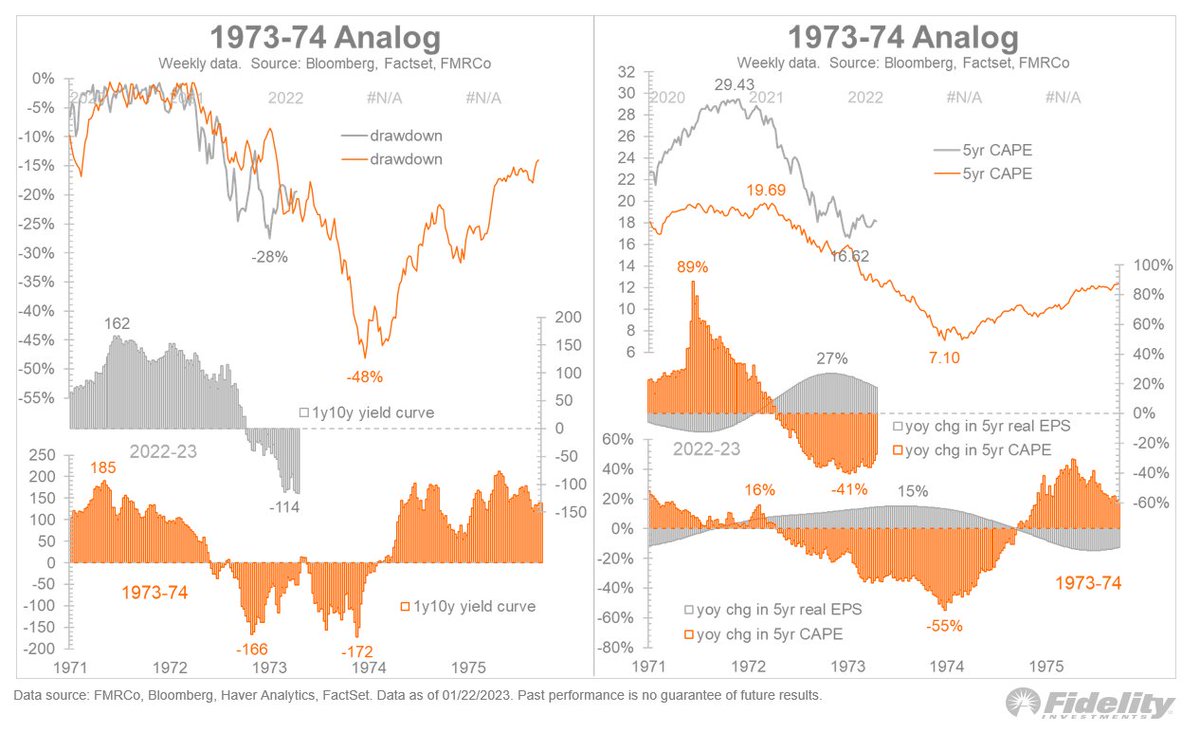
Then the Fed stopped tightening, the market bottomed, and earnings peaked. Sound familiar? Last year’s decline was "only" 28% (compared 47% then), but the unusual timing of earnings peaking at the bottom raises the possibility that 2022 could end up being a mini-1974. /7
Another interesting analog: 1968-70, a bear market that followed the speculative frenzy of the “glamor stock” top in 1968, and which was the first bear market of the high inflation era. /8
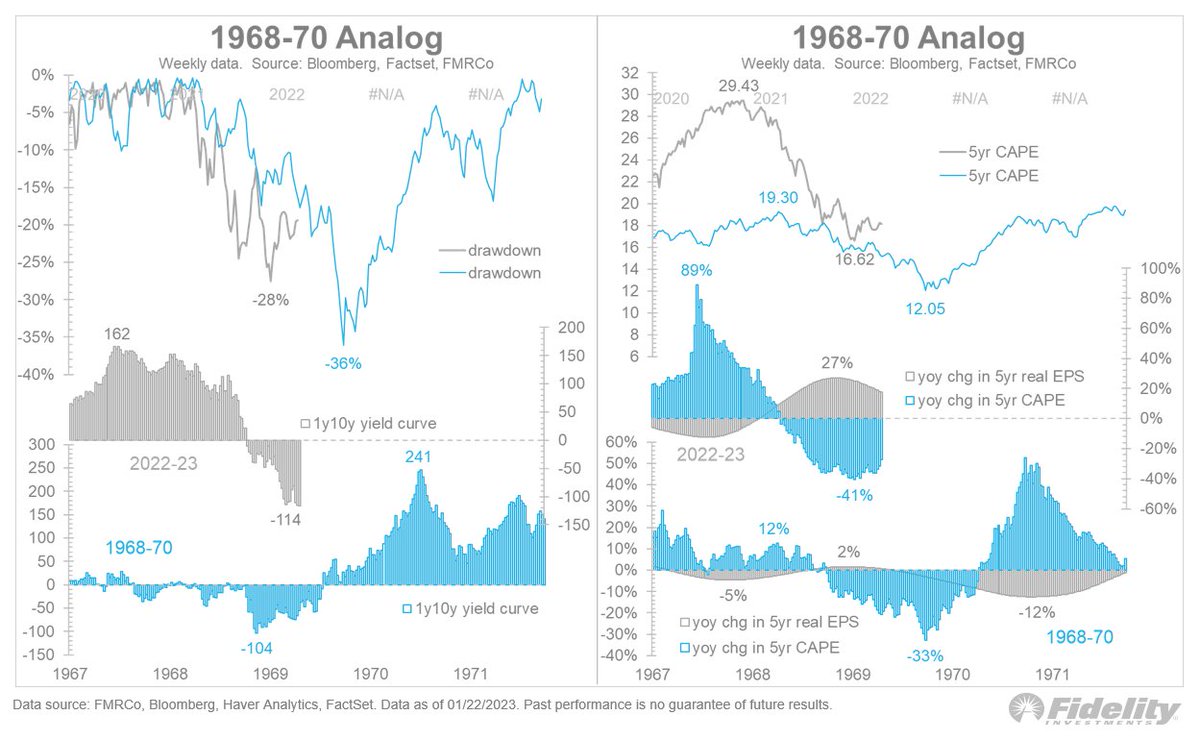
There was a 36% drawdown in 1968-70, ultimately led by a concurrent decline in both EPS and valuation. It was basically a smaller version of 1974. /9
Perhaps the scariest analog of them all is the 2000-2002 dot-com bust cycle, which produced a 53% decline in the S&P 500. Note the eerie similarity between then and now in the drawdown (top left), and the almost identical derating of the P/E ratio (top right). /10
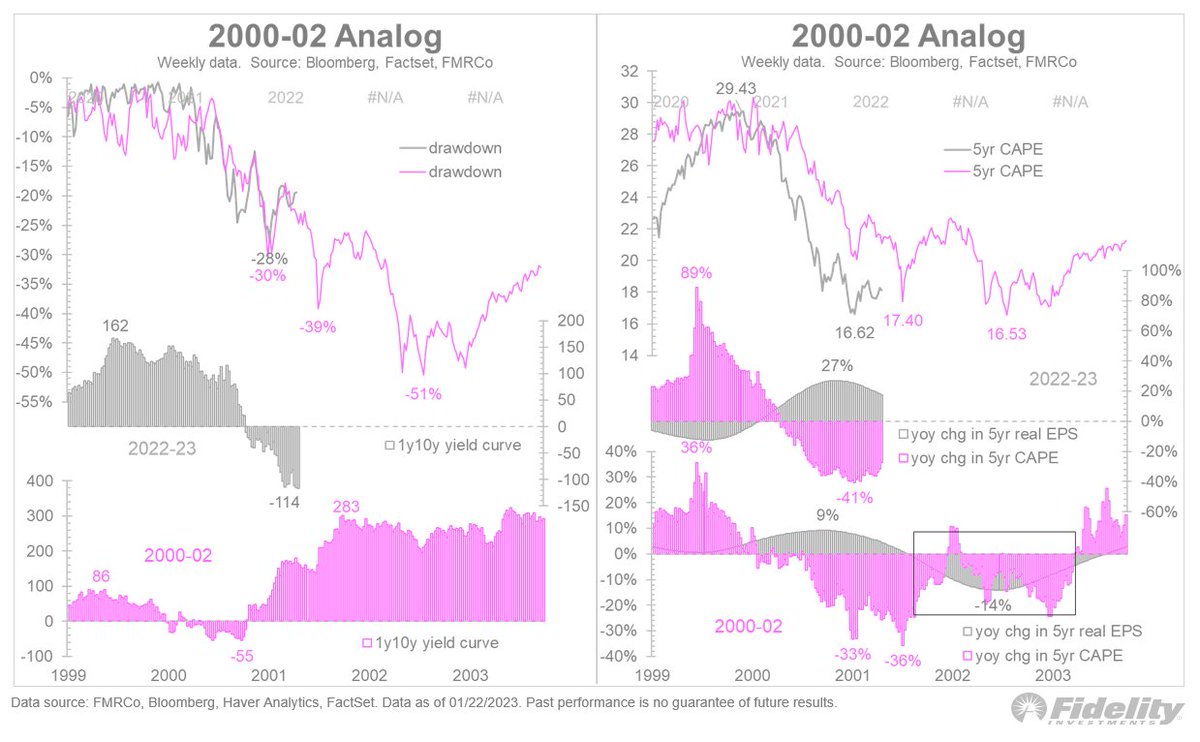
That too was a “super-bear” cycle that produced a simultaneous drawdown in both earnings and valuation. And the current point in the cycle is where the P/E drawdown was nearing its worst point (on a rate of change basis), while earnings rolled over hard. /11
The good news for the current cycle is that the P/E ratio at the October low already reached the worst levels reached in 2001 and 2002. /END
Loading suggestions...