

Technicals 101: 𝐒𝐔𝐏𝐏𝐋𝐘 𝐀𝐍𝐃 𝐃𝐄𝐌𝐀𝐍𝐃
Level Identification and Drawing techniques
Technique:𝙏𝙝𝙚 𝙊𝙥𝙥𝙤𝙨𝙞𝙩𝙚 𝘾𝙖𝙣𝙙𝙡𝙚𝙨𝙩𝙞𝙘𝙠 𝙍𝙚𝙟𝙚𝙘𝙩𝙞𝙤𝙣
Thread 🧵
Level Identification and Drawing techniques
Technique:𝙏𝙝𝙚 𝙊𝙥𝙥𝙤𝙨𝙞𝙩𝙚 𝘾𝙖𝙣𝙙𝙡𝙚𝙨𝙩𝙞𝙘𝙠 𝙍𝙚𝙟𝙚𝙘𝙩𝙞𝙤𝙣
Thread 🧵

1/12
Supply and Demand is the driving force behind changes in price in the market
When there are more buyers than sellers, the market price will move up 📈
Conversely, when there are more sellers than buyers, the market price will move down 📉
Supply and Demand is the driving force behind changes in price in the market
When there are more buyers than sellers, the market price will move up 📈
Conversely, when there are more sellers than buyers, the market price will move down 📉
2/12
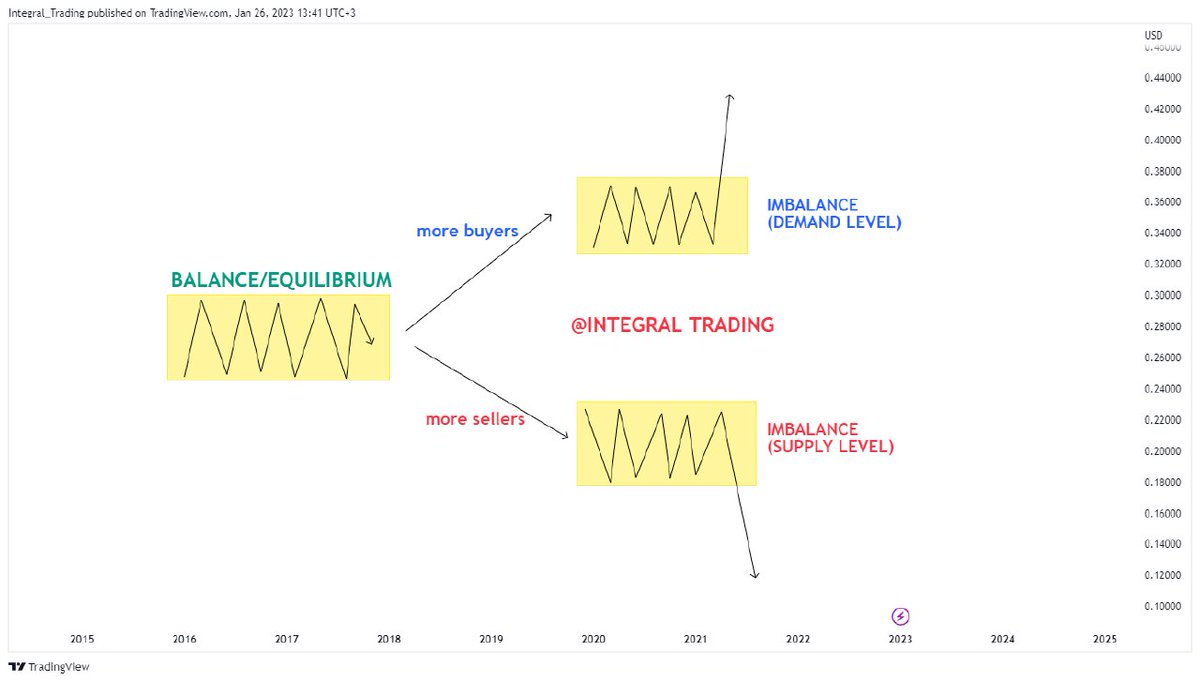
When there is a balance between buyers and sellers then the price will range, No movement as there are equal opposing forces.
So the price will keep buying and selling within certain specific levels, the Equilibrium state.
When there is a balance between buyers and sellers then the price will range, No movement as there are equal opposing forces.
So the price will keep buying and selling within certain specific levels, the Equilibrium state.

3/12
When the price/market is in this Equilibrium state also known as the accumulation phase, it's where the formation of these levels occurs
Levels are formed when there is a shift of equilibrium as the result of an Imbalance between sellers and buyers
When the price/market is in this Equilibrium state also known as the accumulation phase, it's where the formation of these levels occurs
Levels are formed when there is a shift of equilibrium as the result of an Imbalance between sellers and buyers
4/12
An imbalance caused by more sellers activities results in a SUPPLY level
An imbalance caused by more buyers activity results in a DEMAND level
So in drawing levels, you must first Identify those Imbalance areas and then apply different Techniques in Drawing a good level
An imbalance caused by more sellers activities results in a SUPPLY level
An imbalance caused by more buyers activity results in a DEMAND level
So in drawing levels, you must first Identify those Imbalance areas and then apply different Techniques in Drawing a good level
5/12
I have been trading Supply and Demand for years, I have spent a lot of chart time and discovered various great ways of level Identification and Drawing
I have been trading Supply and Demand for years, I have spent a lot of chart time and discovered various great ways of level Identification and Drawing
6/12
There are many different ways of Identifying and drawing these supply and demand levels
When you have limited techniques you will also be limited in identifying what's information the market is giving
I'm going to share with you one of the simple techniques I use 💥👇
There are many different ways of Identifying and drawing these supply and demand levels
When you have limited techniques you will also be limited in identifying what's information the market is giving
I'm going to share with you one of the simple techniques I use 💥👇
7/12
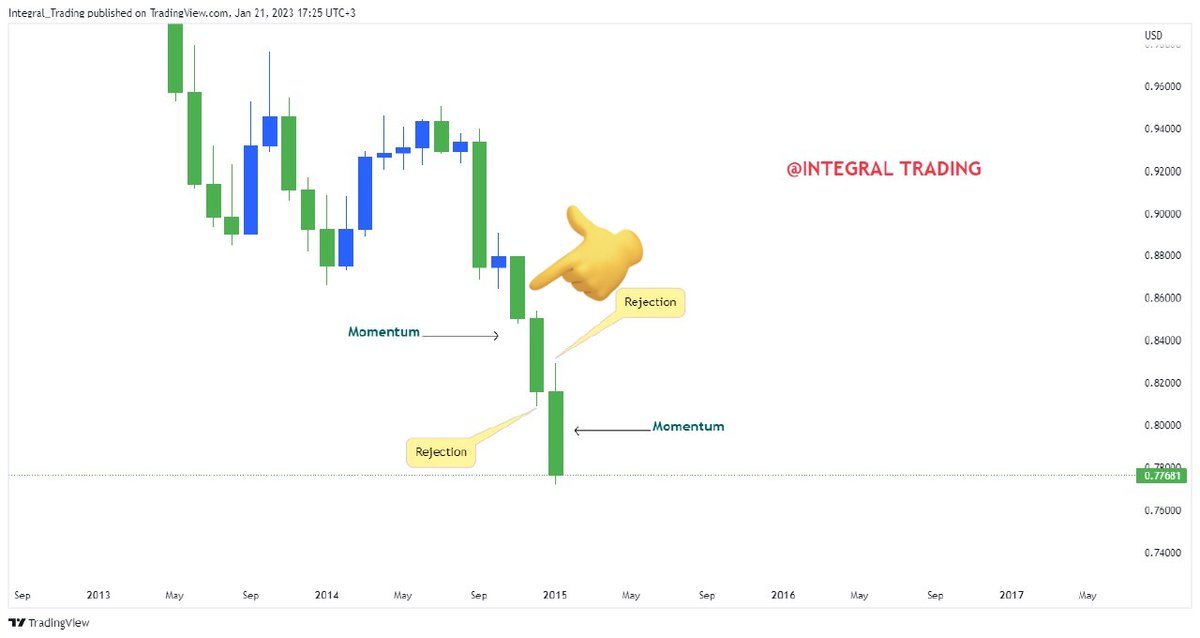
Opposite Candlesticks Rejection
Price Should be moving in momentum, Clear significant momentum.
There should be at least one significant momentum Candle before the formation of the opposite rejection candles
Then followed with a momentum Candle again
See Chart 👇
Opposite Candlesticks Rejection
Price Should be moving in momentum, Clear significant momentum.
There should be at least one significant momentum Candle before the formation of the opposite rejection candles
Then followed with a momentum Candle again
See Chart 👇
8/12
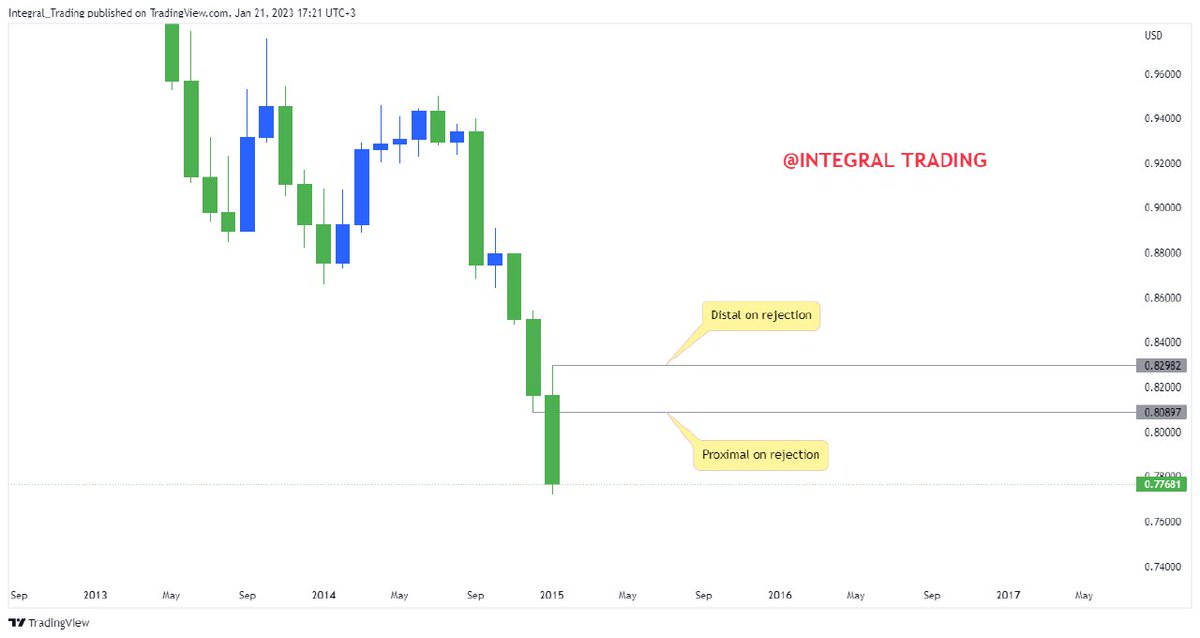
Rejections should be normal and not longer rejections (VERY IMPORTANT)
Almost equal rejection from each opposite side (The balance)
At the end of each rejection it's where you plot ur proximal ñ distal lines
Then draw your level covering the level in between
See Charts
Rejections should be normal and not longer rejections (VERY IMPORTANT)
Almost equal rejection from each opposite side (The balance)
At the end of each rejection it's where you plot ur proximal ñ distal lines
Then draw your level covering the level in between
See Charts

9/12
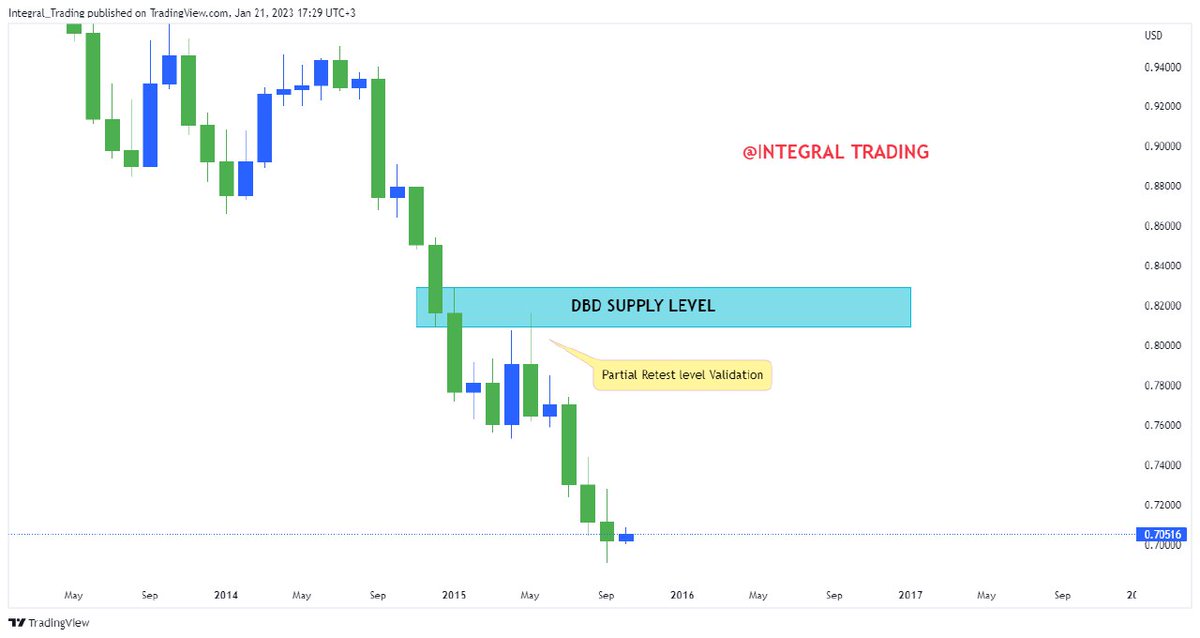
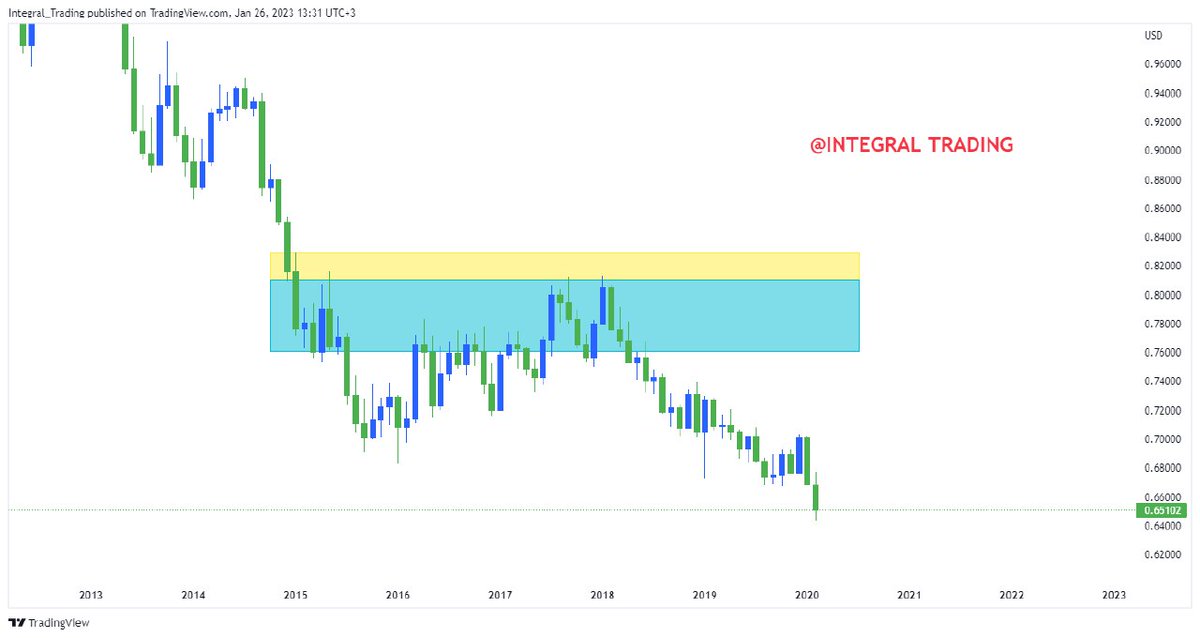
See the Chart below we have a clear initial level retest on the SUPPLY level
A partial retest level validation
See the Chart below we have a clear initial level retest on the SUPPLY level
A partial retest level validation
10/12
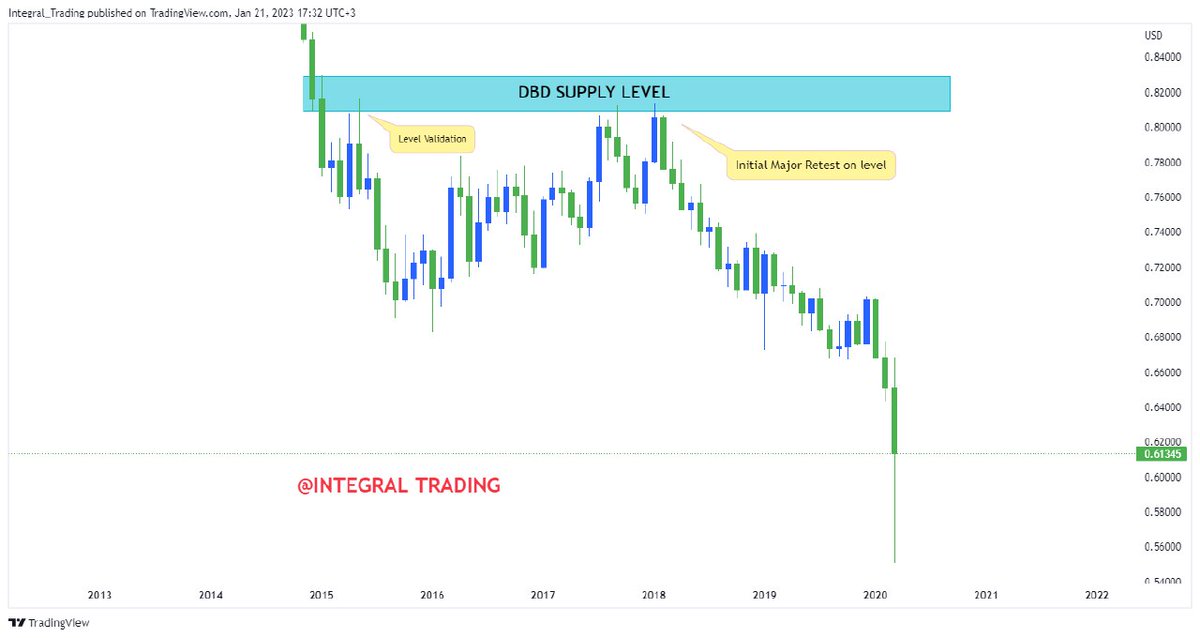
And here we have our clear level bounce, Exactly at the proximal point of the SUPPLY level then boom 💥
And here we have our clear level bounce, Exactly at the proximal point of the SUPPLY level then boom 💥
11/12
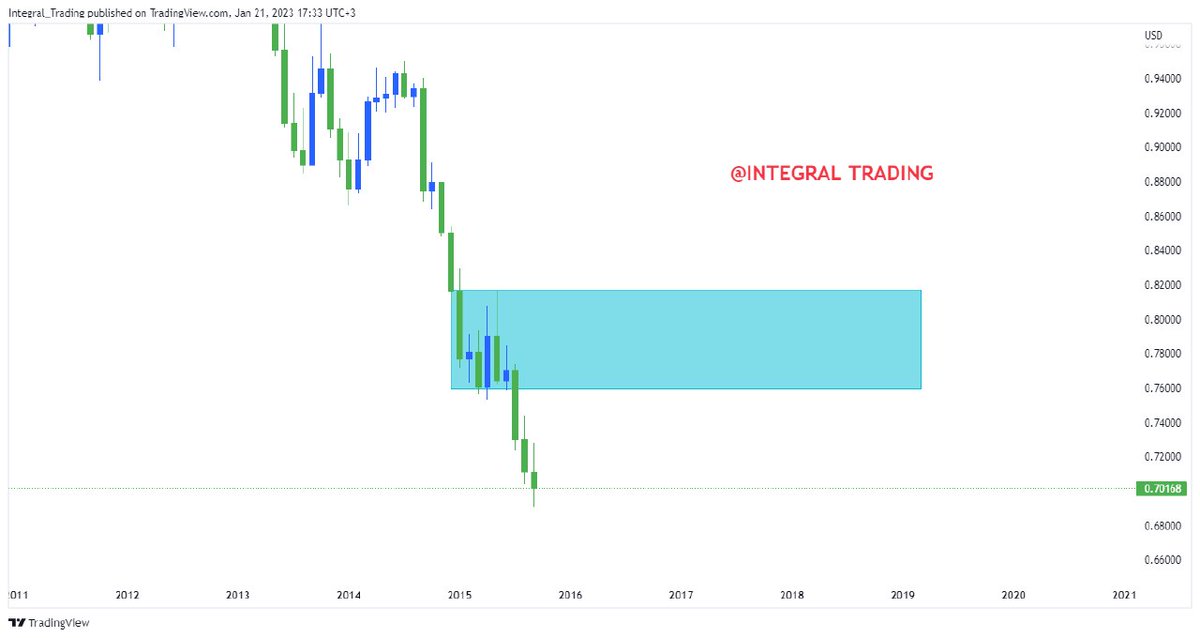
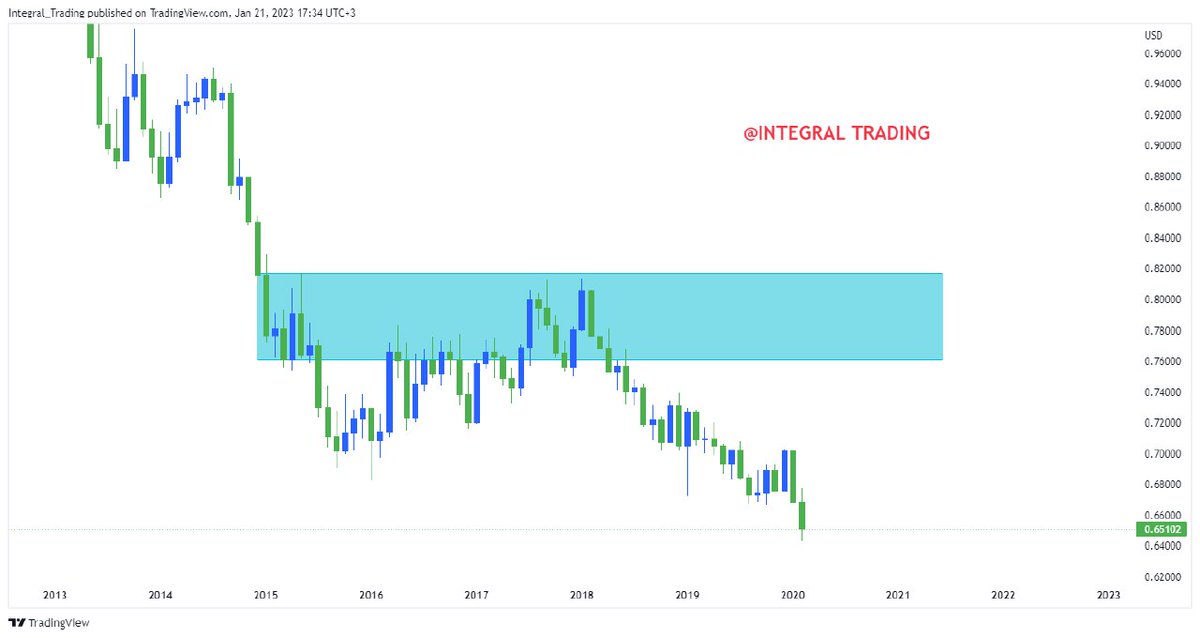
From the same chart information, you could have considered this level. See Charts below
But why didn't I consider this accumulation scenario?
Is it not a clear level?
Why price didn't obey the level? And it's a clear level with a good imbalance
*TIPS next tweet
From the same chart information, you could have considered this level. See Charts below
But why didn't I consider this accumulation scenario?
Is it not a clear level?
Why price didn't obey the level? And it's a clear level with a good imbalance
*TIPS next tweet
12/12
👇👇
↪Where are you drawing your level from
↪When drawing levels know how to consider current moves and past movements
↪How to draw levels based on the direction of the current price movement
↪Ways to filter out unnecessary lvls
↪Techniques to refine a good lvl
👇👇
↪Where are you drawing your level from
↪When drawing levels know how to consider current moves and past movements
↪How to draw levels based on the direction of the current price movement
↪Ways to filter out unnecessary lvls
↪Techniques to refine a good lvl

I hope you have learned something from this thread, and if you did, feel free to share and retweet it as well 🤝🥂
Loading suggestions...