

4 tips to use RSI indicator effectively. 🧵
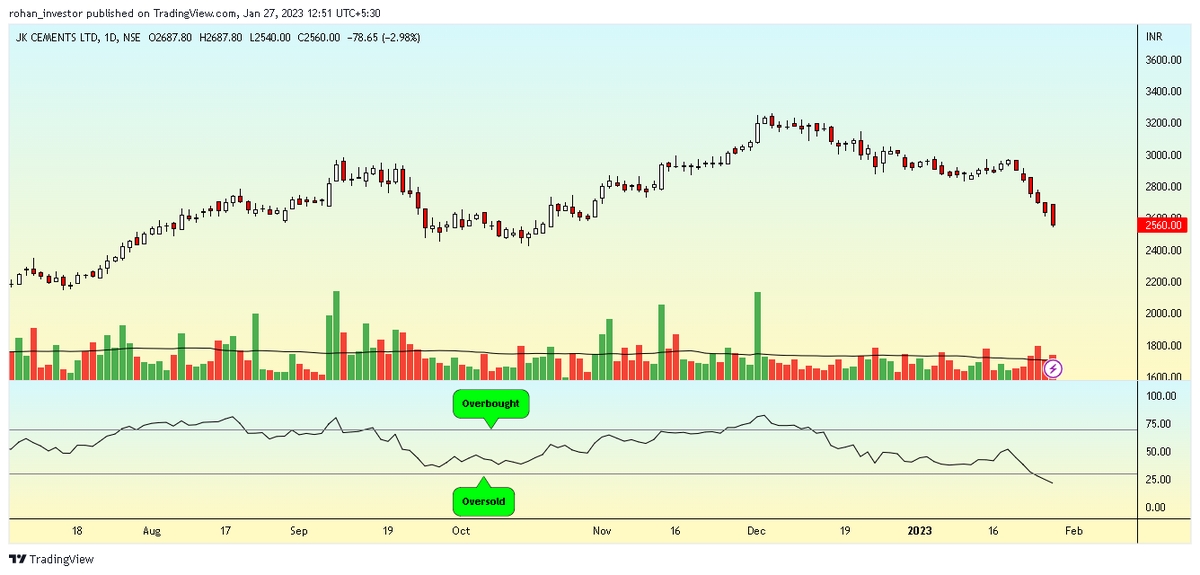
1. The RSI is considered overbought when it's above 70 and oversold when it's below 30, but these levels can be adjusted for specific securities. Keep in mind that during strong trends, the RSI may stay in overbought/oversold territory for a while.
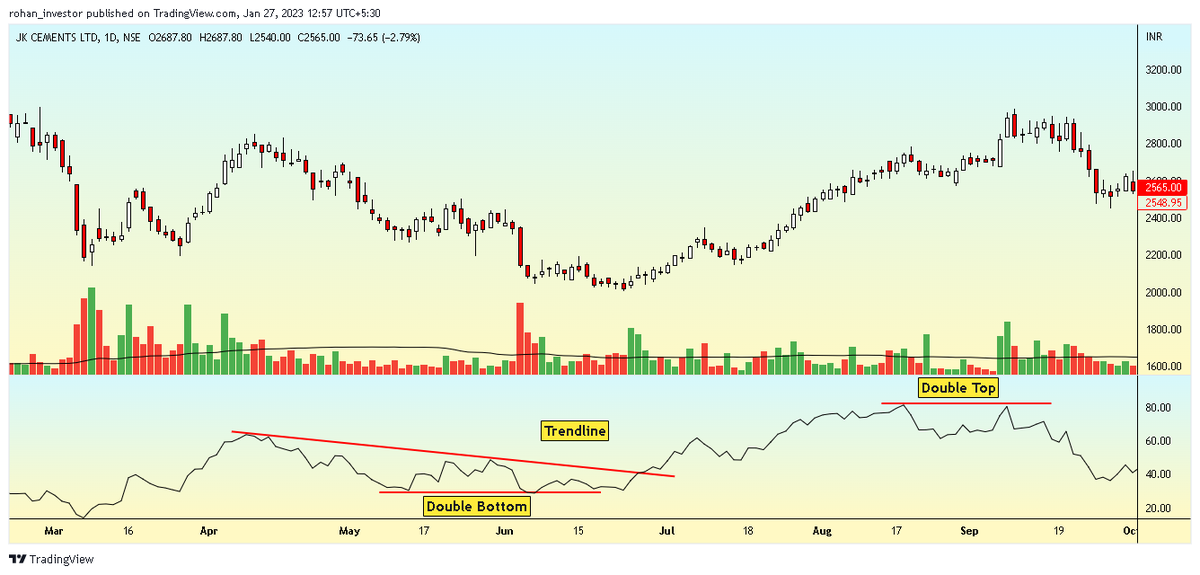
2. RSI often forms patterns on its own chart, like double tops/bottoms & trend lines. Check RSI for support/resistance too.
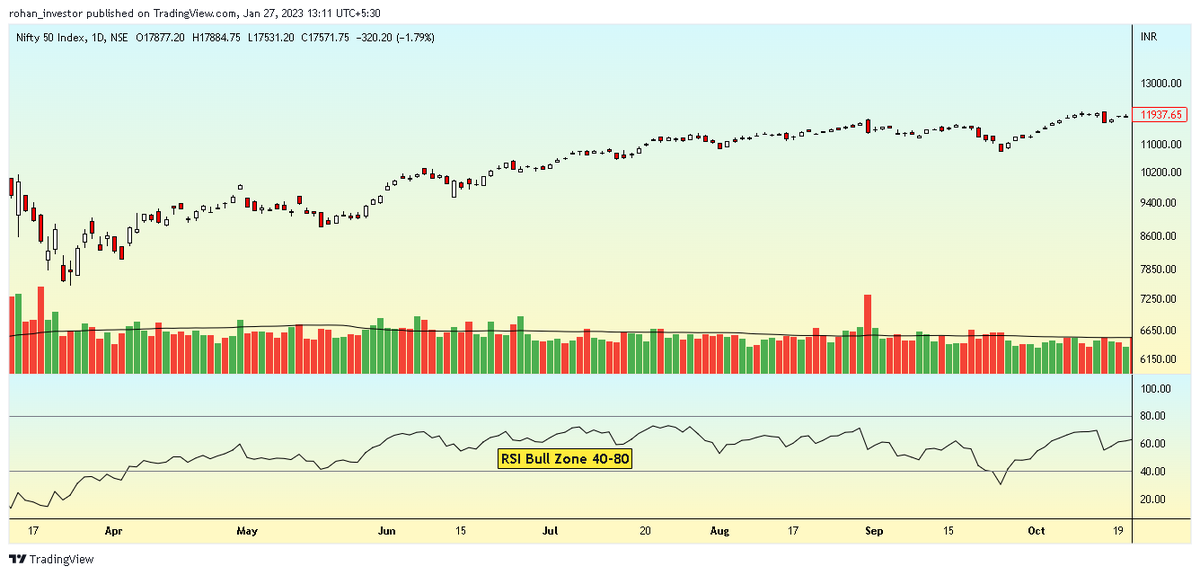
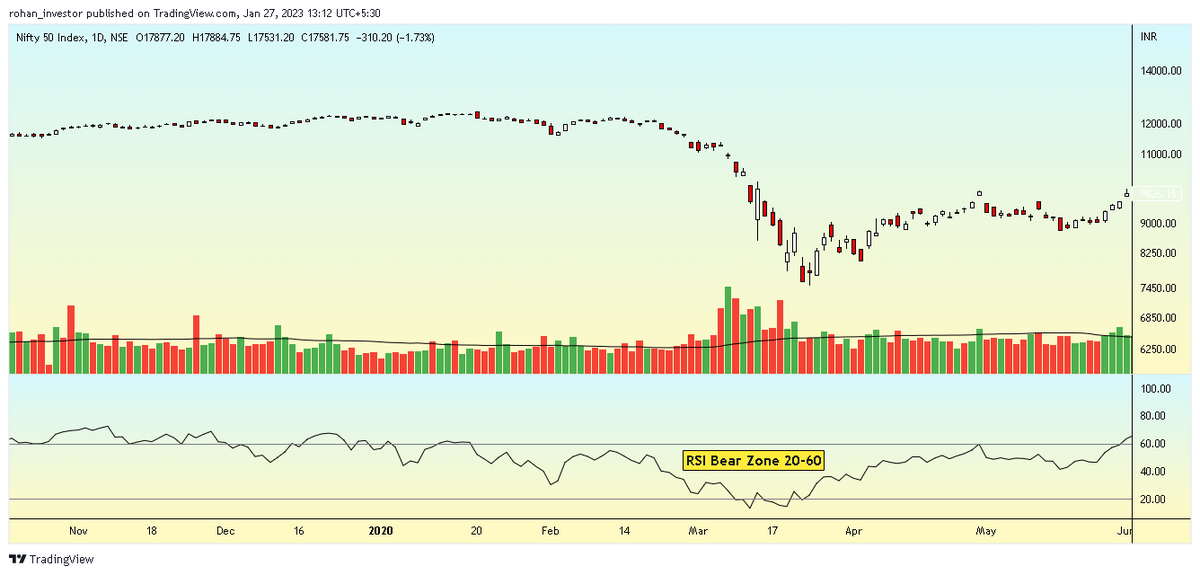
3. During an uptrend, RSI typically stays between 40-80, with 40-50 as support. During a downtrend, RSI stays between 20-60, with 50-60 as resistance. Variations may occur depending on RSI settings and market strength.
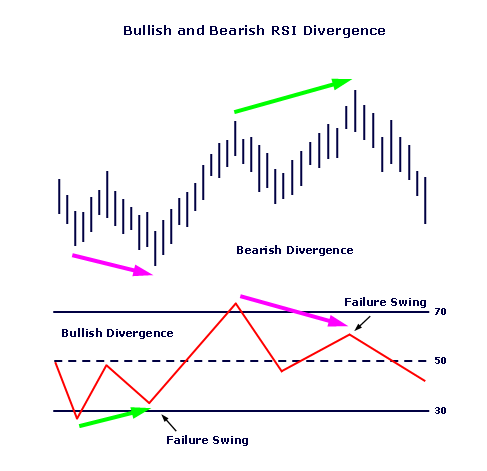
4. When RSI doesn't match new high/low in prices, it may show a reversal. A Top Swing Failure happens when RSI makes a lower high and drops below previous low. A Bottom Swing Failure happens when RSI makes a higher low and rises.
I regularly update my latest stocks ideas, strategies, sector rotation, and market breadth analysis, so be sure to follow me for valuable insights and updates on the world of investing.
Follow me on: @rohaninvestor
Follow me on: @rohaninvestor
Loading suggestions...