

Thread: Bollinger Bands 🧵
John Bollinger's Bollinger Bands® is a highly innovative tool.
John Bollinger's Bollinger Bands® is a highly innovative tool.
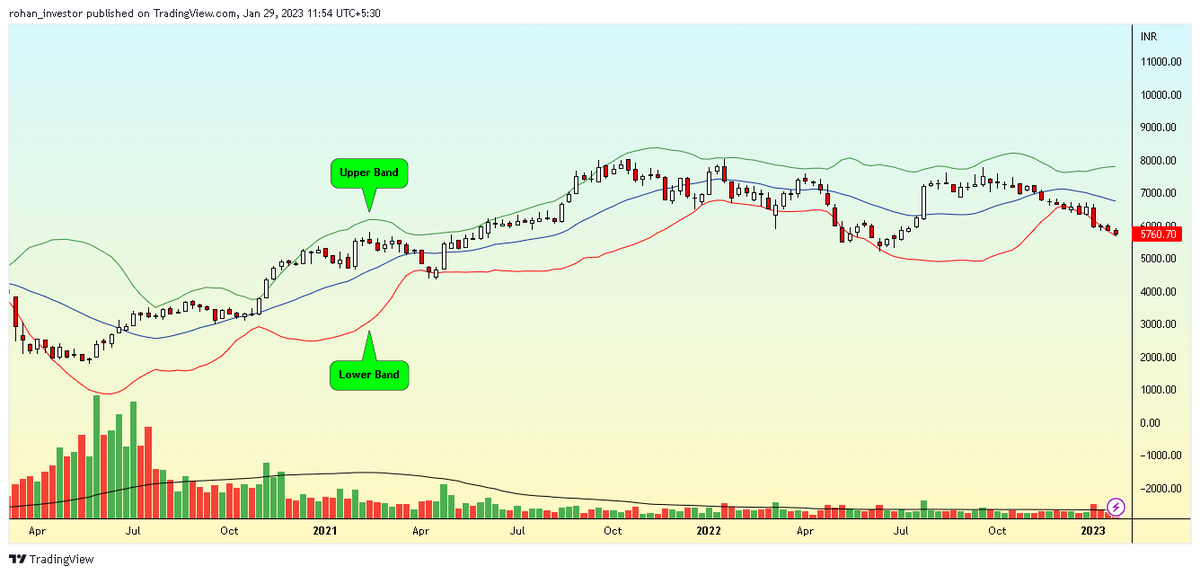
Bollinger Bands formula:
Upper Band = Middle band + 2 standard deviations
Middle Band = 20-period moving average.
Lower Band = Middle band – 2 standard deviations.
Upper Band = Middle band + 2 standard deviations
Middle Band = 20-period moving average.
Lower Band = Middle band – 2 standard deviations.
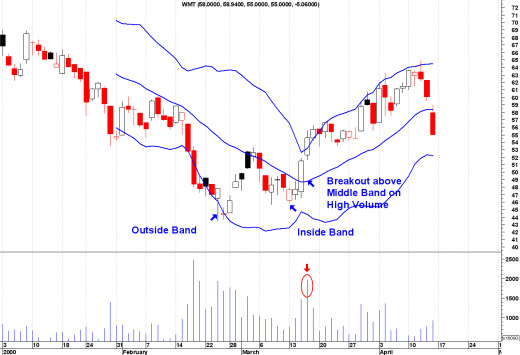
(1) A BB strategy often involves a double bottom where the first bottom has high volume & sharp price pullback outside of lower band, leading to an automatic rally. Technicians look for retest bar inside lower band with reduced volume, indicating shift from sellers to buyers.
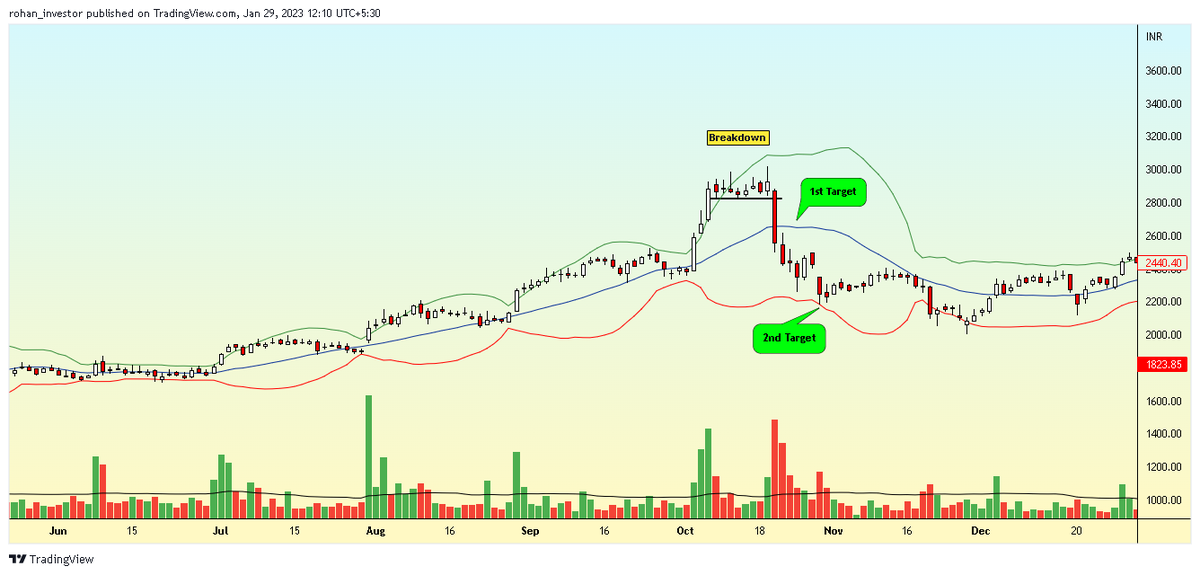
(2) Fade stocks that breakout of their bands, but wait to see if they show bearish candlestick patterns before shorting. Use upper, middle, or lower bands as target exit points based on where the stock finds support. Watch for overbought signals.
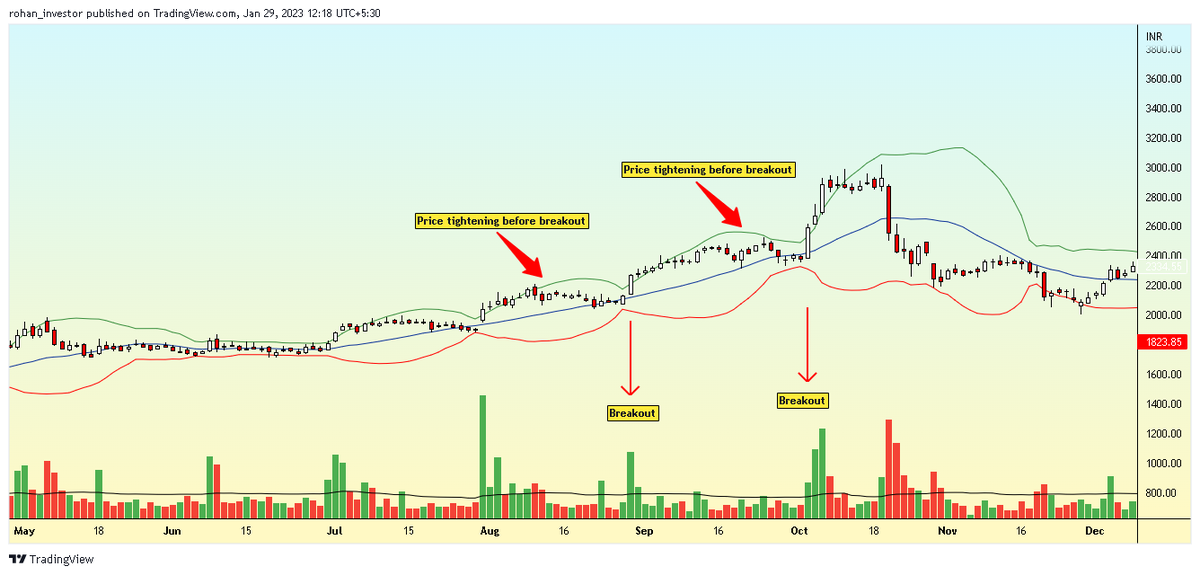
(3) Many Bollinger Band beginners err by selling when price touches the upper band or buying when it hits the lower band. But this is not a signal to buy or sell. A breakout, accompanied by high volume, is a more profitable setup.
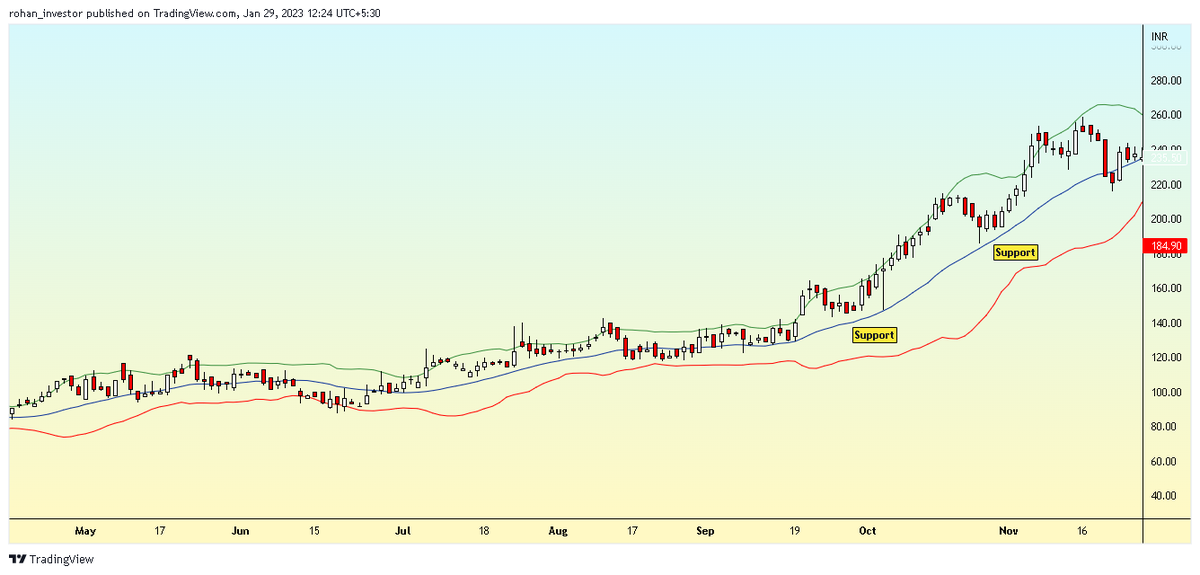
(4) Middle band in BB Indicator is a 20-period SMA. It acts as support during pullbacks & a sign to add positions. Weak trend signals when stock fails to continue accelerating outside bands, time to consider scaling out or exiting.

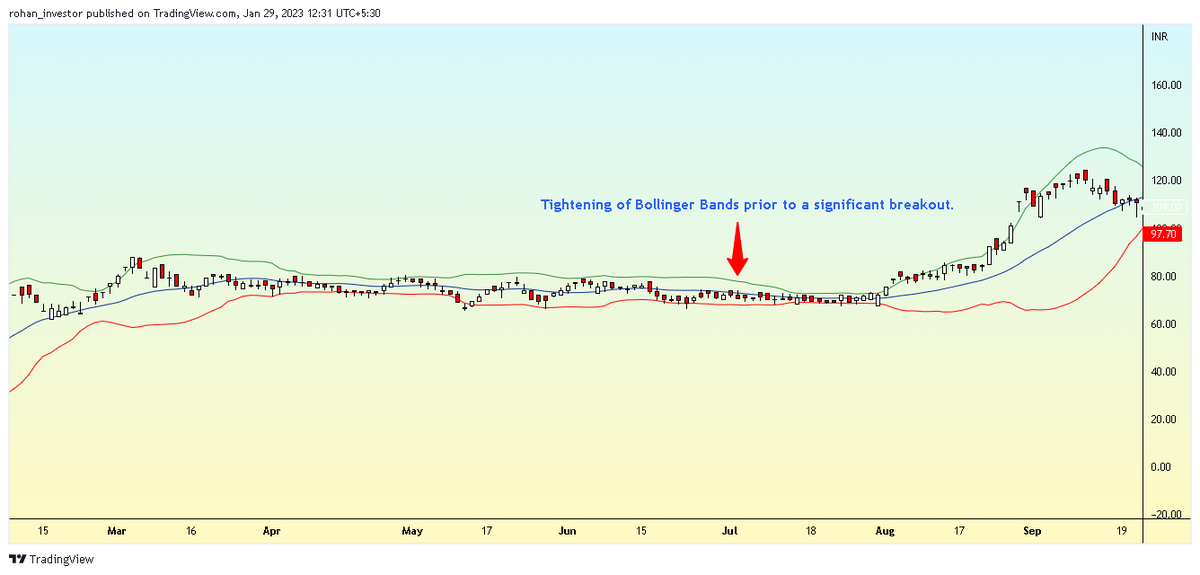
(5) Use Bollinger Band indicator to predict market volatility. When the indicator reaches its lowest point in 6 months, expect a big move. Use other signals like expanding volume or a RSI indicator for added evidence. Be aware of potential head-fakes.
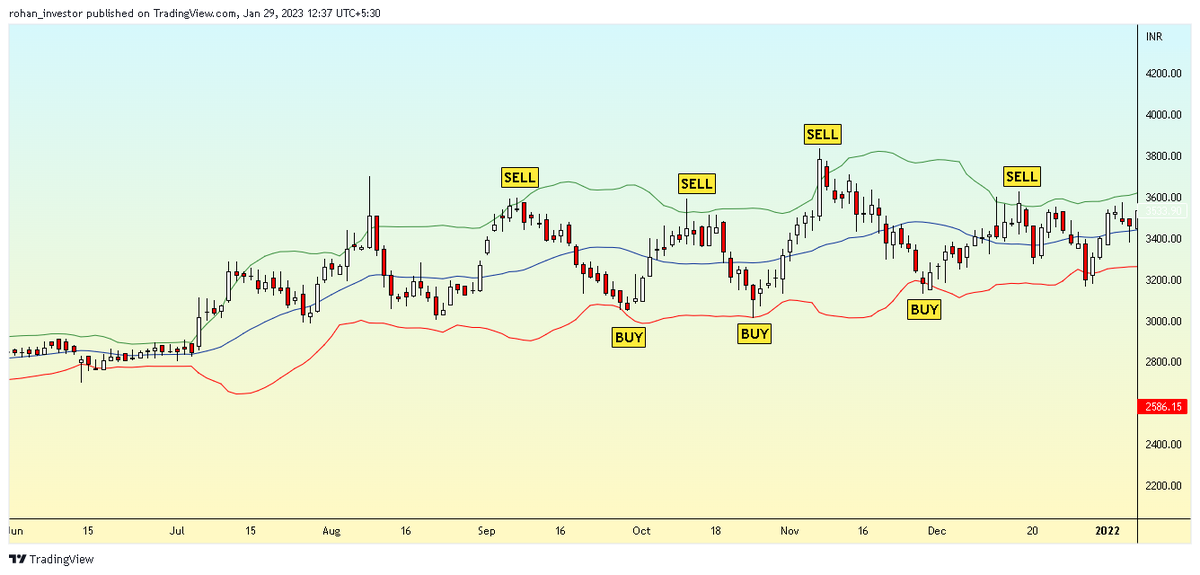
(6) Find a stock stuck in a trading range, the wider the better. Don't chase quick gains, but instead wait for market presents itself. Buy when stock hits low end/lower band, sell when it hits high end/upper band.
Loading suggestions...