

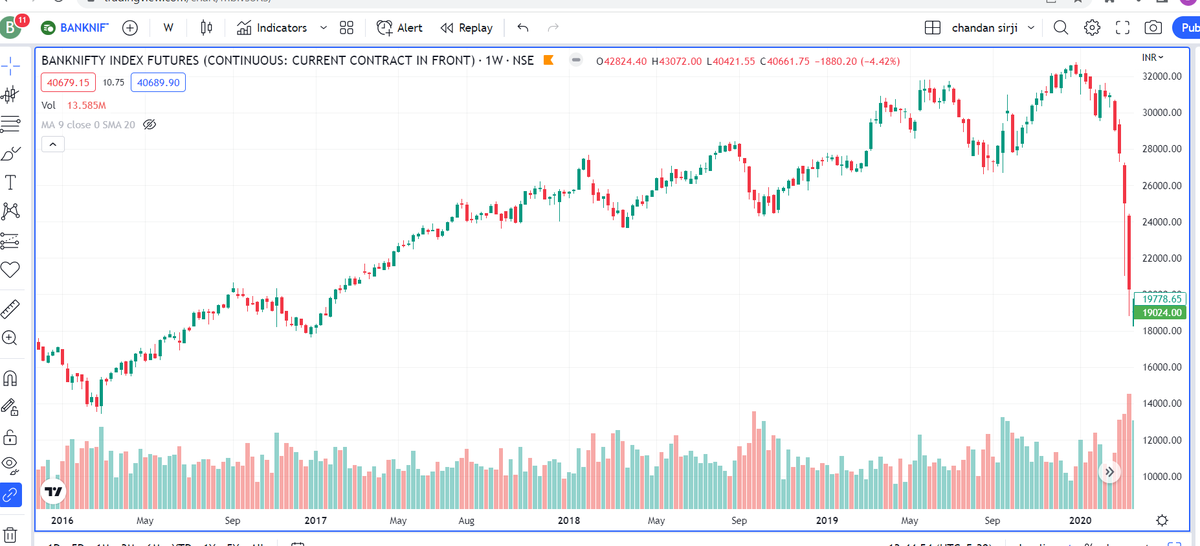
Market always works on historical price patterns and follows old foot prints. Lets see BNF from 2016 to 2019 on weekly time frame. The idea is to see how BNF behaves whenever it has fell more than 3% on weekly basis. Lets start
There are 2 pics. One with weekly charts and the other with big red candles with number market from 1-10 on it.
SL No 1 - BNF moved from 166341-15509 (3%) & in the following week the low was 15480. So basically BNF just touched the last week low and moved on to new high to 20307
SL No 1 - BNF moved from 166341-15509 (3%) & in the following week the low was 15480. So basically BNF just touched the last week low and moved on to new high to 20307
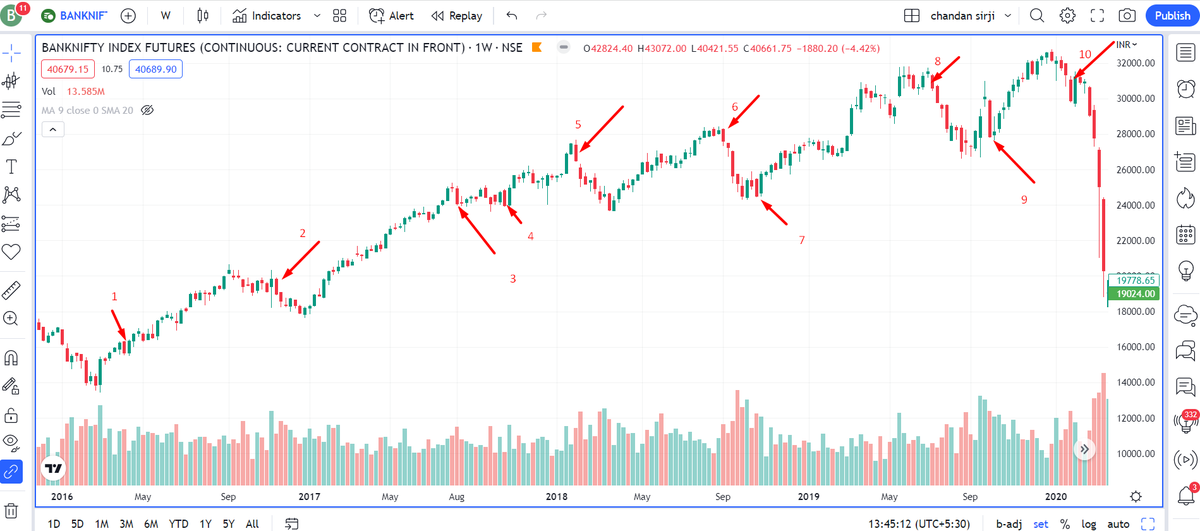
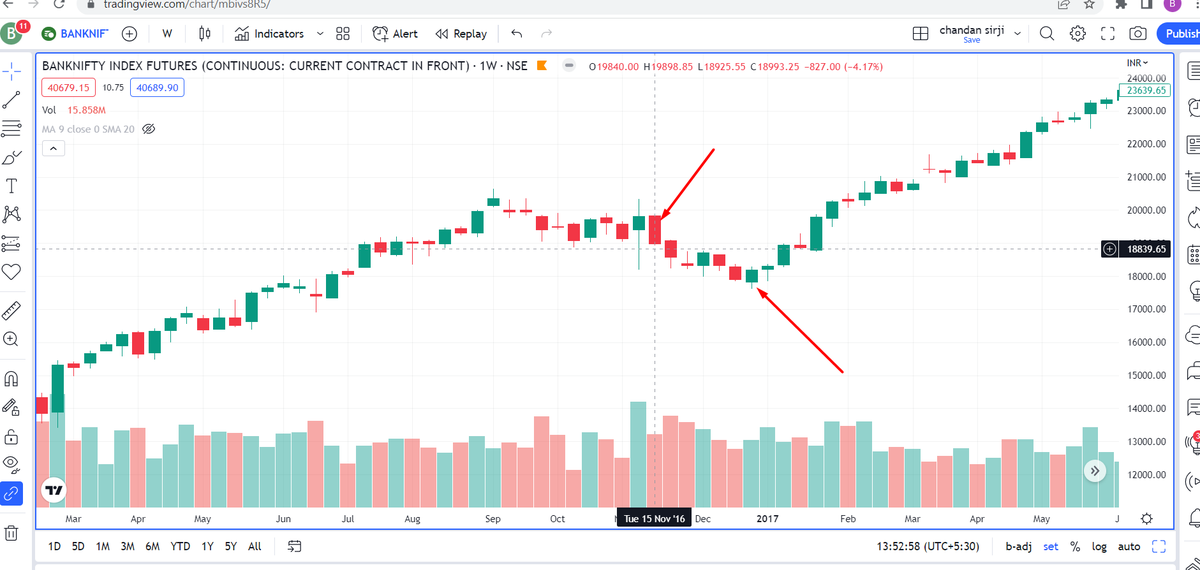
Sl No 2 - This was 15/11/16 candle with downtick of 4% from 19898-18900. The low was broken next week and then BNF went down to check 17617 in subsequent week.
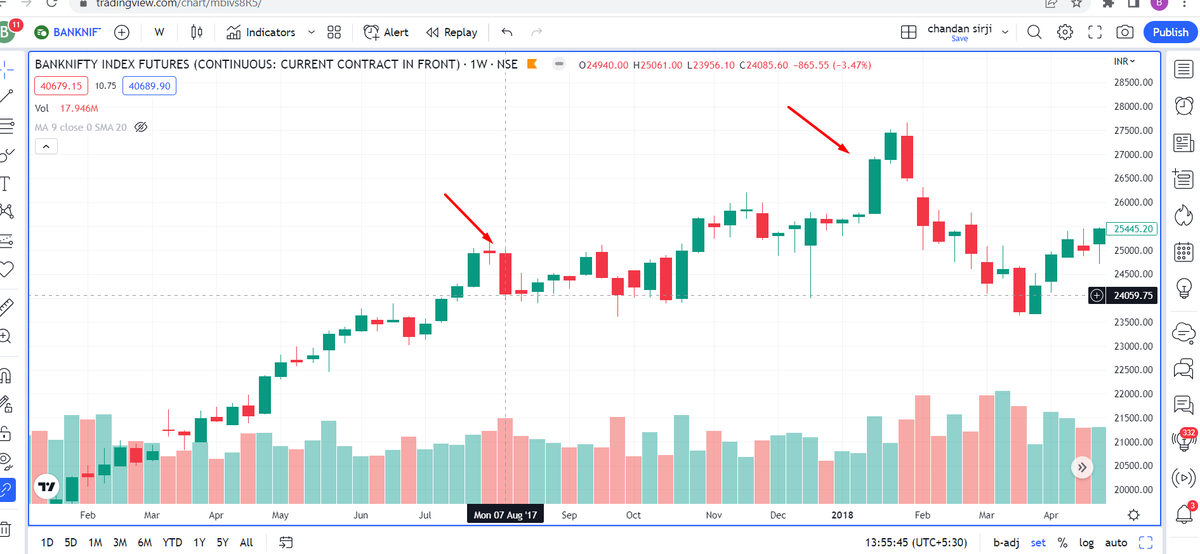
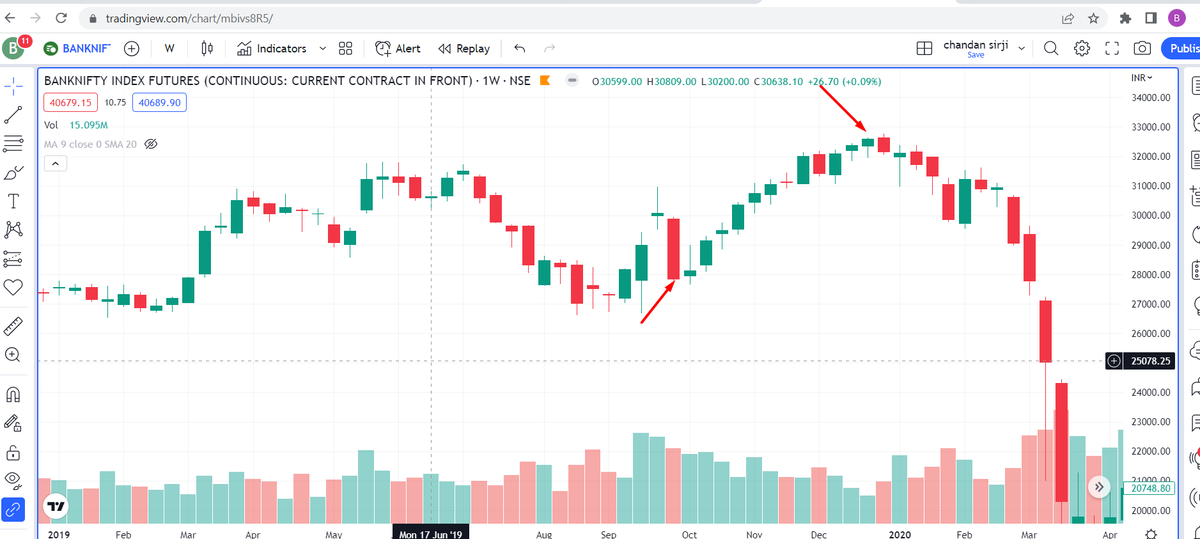
Sl No 3 - This was 7/8/17 weekly candle with 3.50% downtick from 25061-23950. In next week BNF made low of 23933 &
Sl No 3 - This was 7/8/17 weekly candle with 3.50% downtick from 25061-23950. In next week BNF made low of 23933 &
then remained in range for 3 months before going higher.
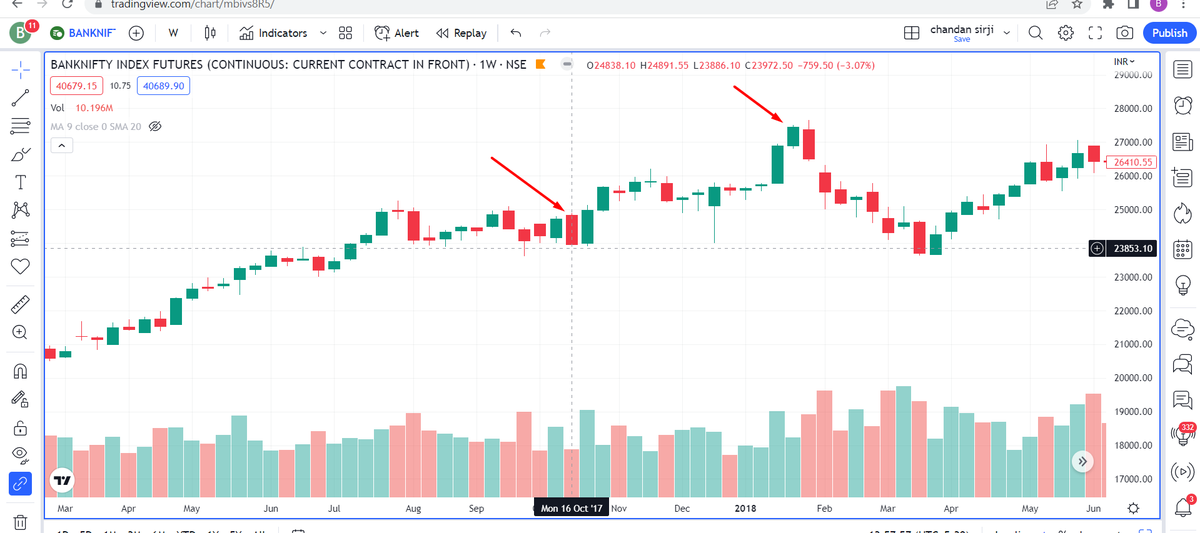
Sl No 4 - This was on 16/10/17 with downtick of 3% and 24890-23866. In next week BNF made low of 23902 and then moved towards 27400.
Sl No 4 - This was on 16/10/17 with downtick of 3% and 24890-23866. In next week BNF made low of 23902 and then moved towards 27400.
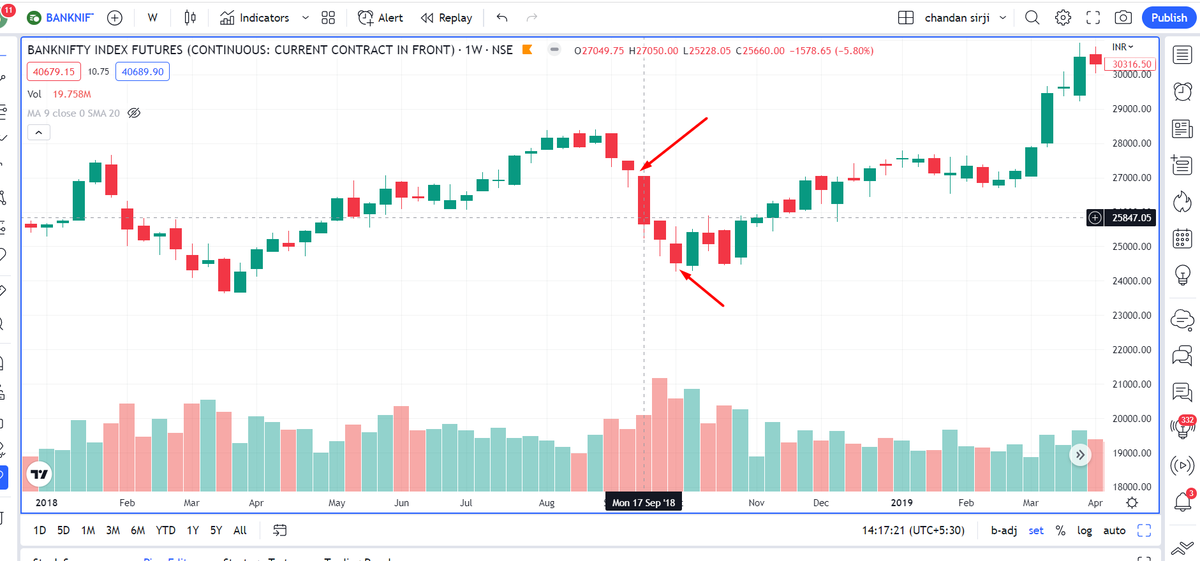
Sl No 6 - On 17/9/18 BNF cracked 6% from 27050-25250 and breaking it next week to make a low of 24250
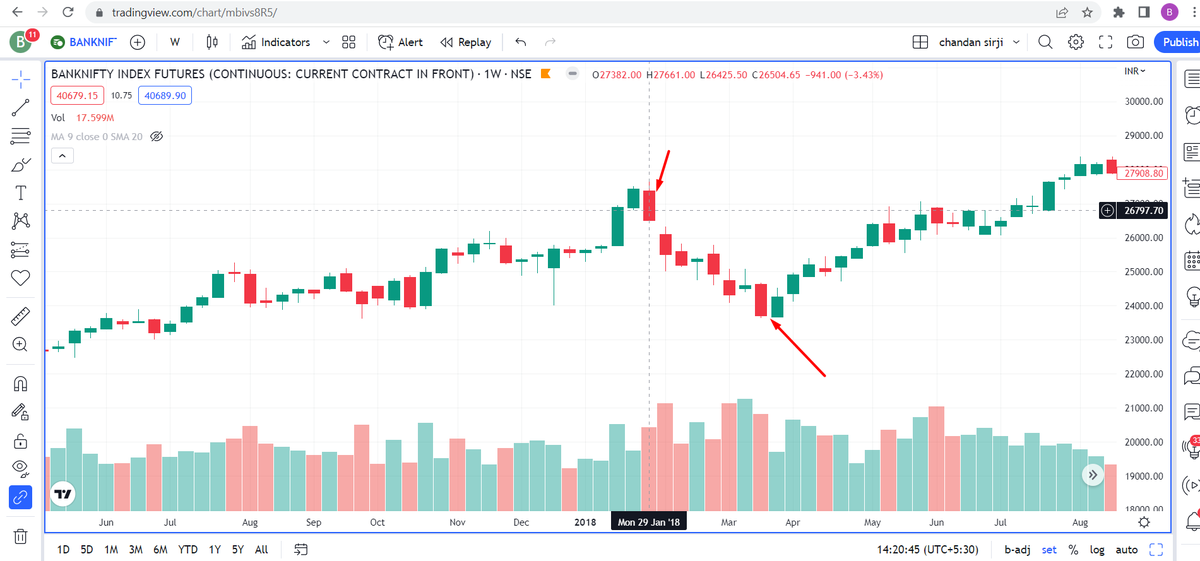
Sl No 5 - On 29/1/18 BNF cracked 3.50% from 27660-26425, and then breaking the low next week for final destination of 23600
Sl No 5 - On 29/1/18 BNF cracked 3.50% from 27660-26425, and then breaking the low next week for final destination of 23600
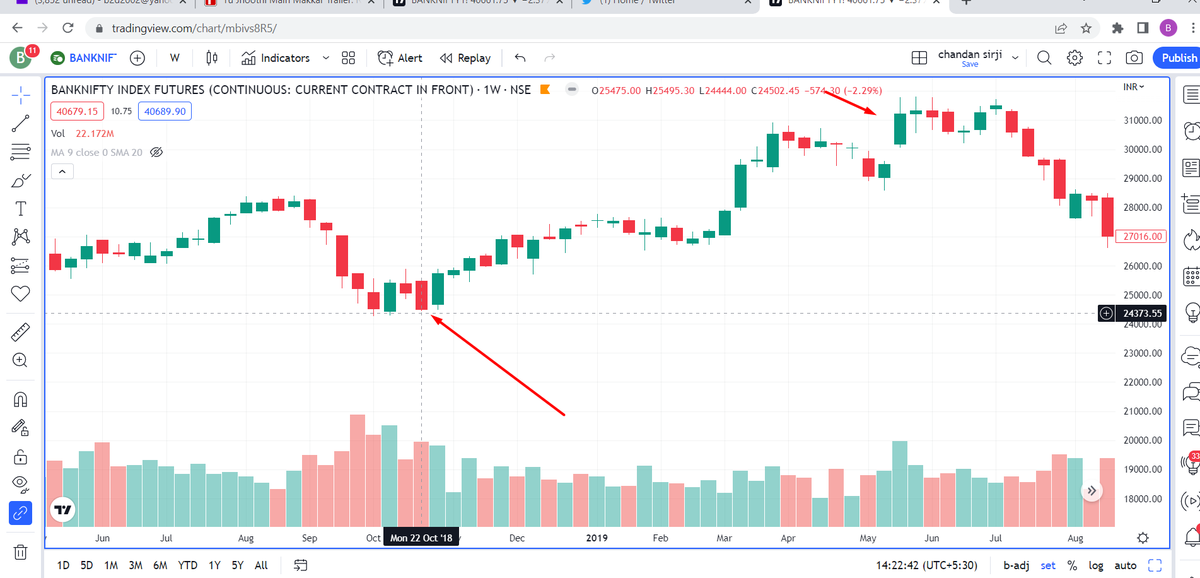
SL No 7 - In 22/10/18 BNF travelled from 25495-24444 and next week low was 24471, then BNF travelled to 30817.
Sl No 8 - On 8/7/19 BNF fell 3% from 31400-30400 and then made new low in next week, which resulted in fall till 26600.
Sl No 8 - On 8/7/19 BNF fell 3% from 31400-30400 and then made new low in next week, which resulted in fall till 26600.
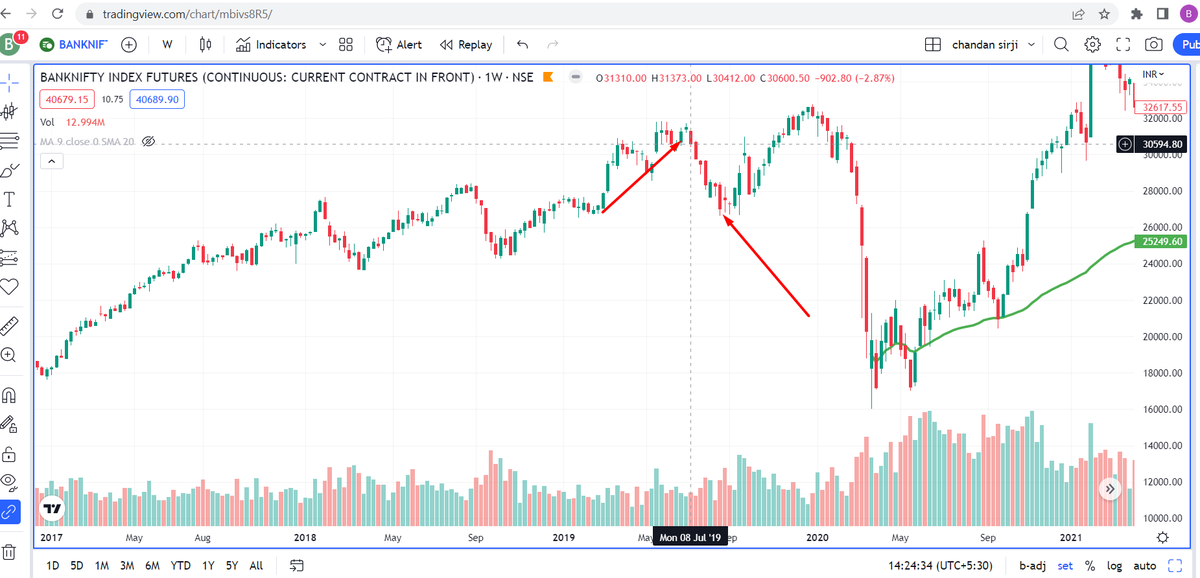
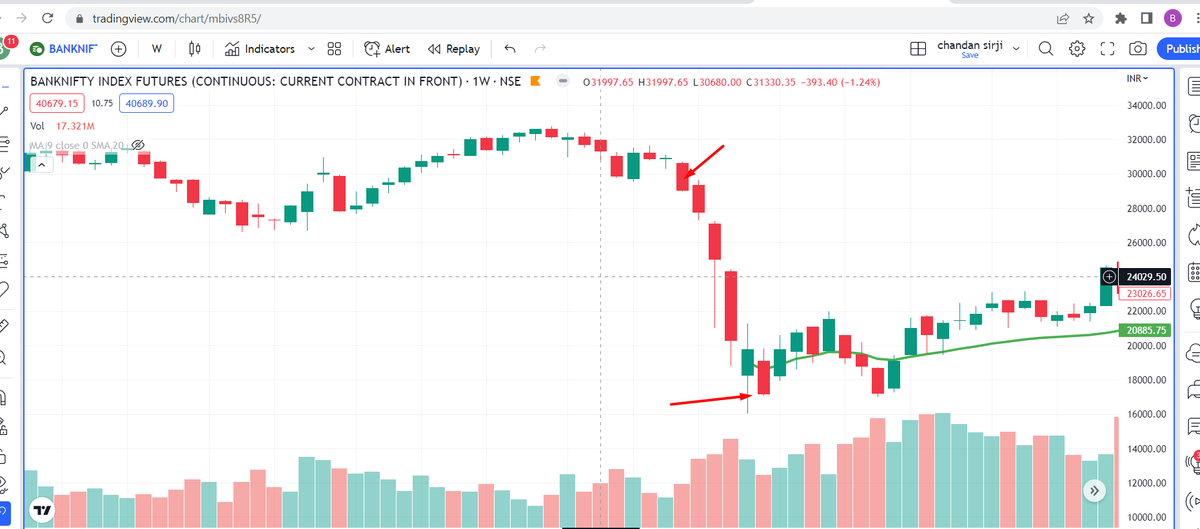
Sl No 9 - On 30/9/19, it was biggest fall of 7.40% from 29955-27800. This was the biggest fall in last 3 years but low was not broken till 27650 and then big rally to 32700.
Sl No 10 - The famous covid fall from 30774 to 15900.
Sl No 10 - The famous covid fall from 30774 to 15900.
I took these detailed points till Big crash to form a idea. So based on these 10 points, we can say if weekly low are broken by 1% , then we should prepare ourselves for a big fall eventually. Now lets see what happened after Covid fall.
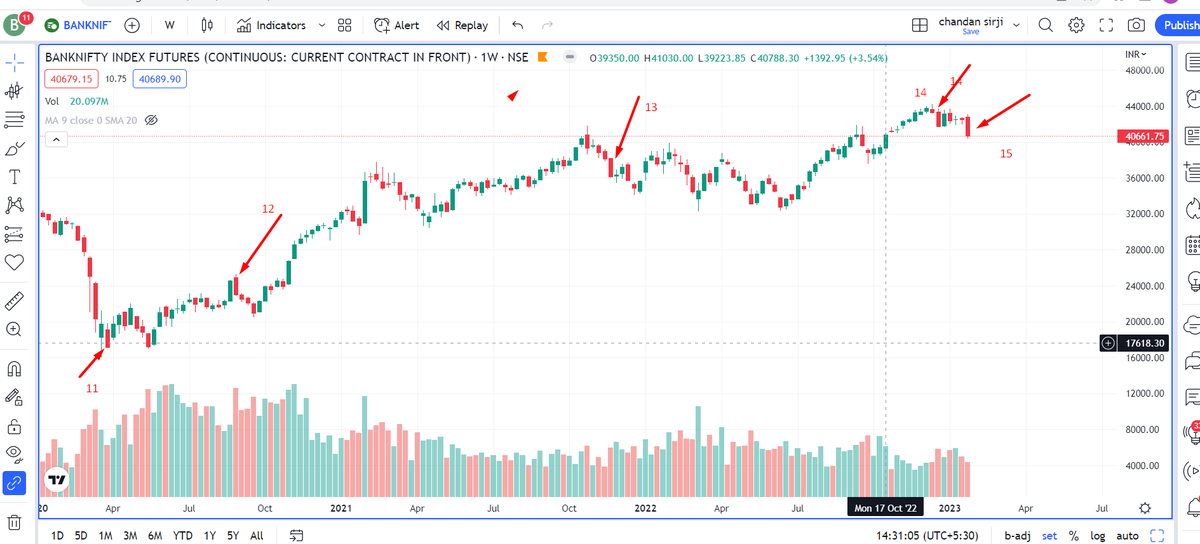
You can the old pattern is repeating after Covid period and till now also. We have seen new low in SL No 12 while in Sl No 11/13/14, it was protected. Now we are at SL No 15 and God knows whats in store for us.
By analysing this weekly patterns of last 7 years we can say the low of 40421 (current week) and add 1% on it, so say round figure of 40000 will be very important for bulls. If we break this, then further selling may intensify.
If you want to go into further details you can analyse the hourly time frame chart of weeks where it made low before reversal to new high. This will add up more interesting learnings.
Hope it was of help.
Hope it was of help.
Disc ::: No open trades as of now, but me or my clients can trade based on this view in future. Views disclosed here are for educational purpose only.
Loading suggestions...