

Bullish bias for FOMC.
The "why" | a thread
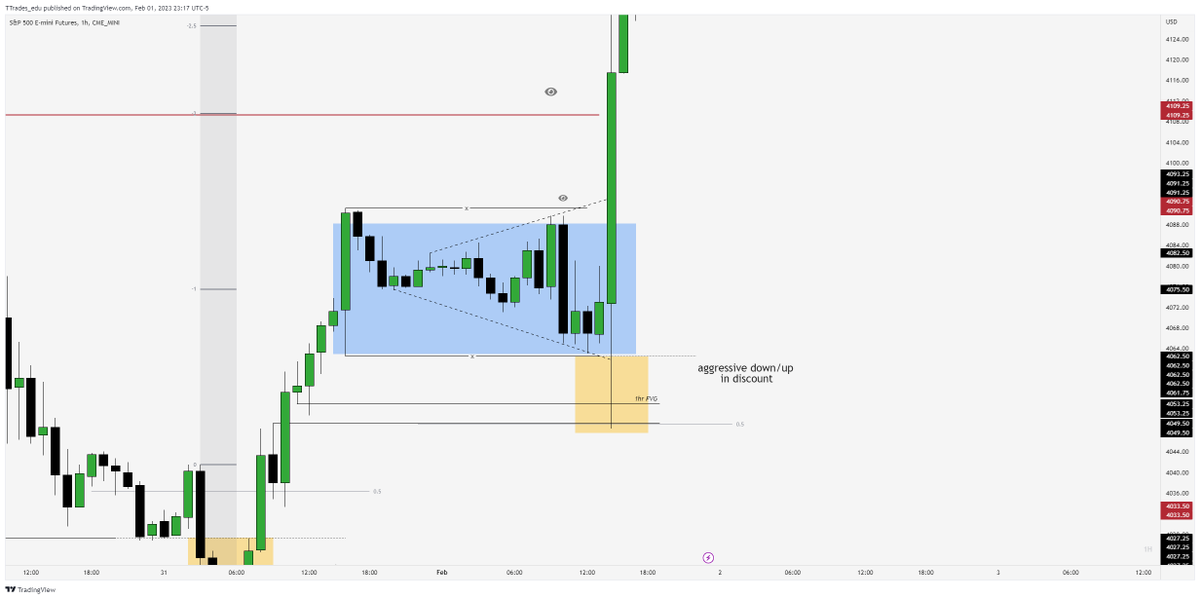
My focus was on the hourly chart.
my eyes focus on the aggressive move down/up after running liquidity in a discount. (manipulation)
The "why" | a thread
My focus was on the hourly chart.
my eyes focus on the aggressive move down/up after running liquidity in a discount. (manipulation)

Zooming in you can see how the price leg down on the 31st took lows before aggressively moving back into the range. This sets up the displacement over 30th highs, importantly closing above them.

after accumulating throughout asia and london.
NY sweeps the highs first. This give me the bias to go lower (S&D template).
Where lower?
-sweep lows into a pd array... 1hr fvg & discount
NY sweeps the highs first. This give me the bias to go lower (S&D template).
Where lower?
-sweep lows into a pd array... 1hr fvg & discount
Price moves higher aggressively and my eyes then draw to what?
Sell side liquidity.
3190
4110
Sell side liquidity.
3190
4110
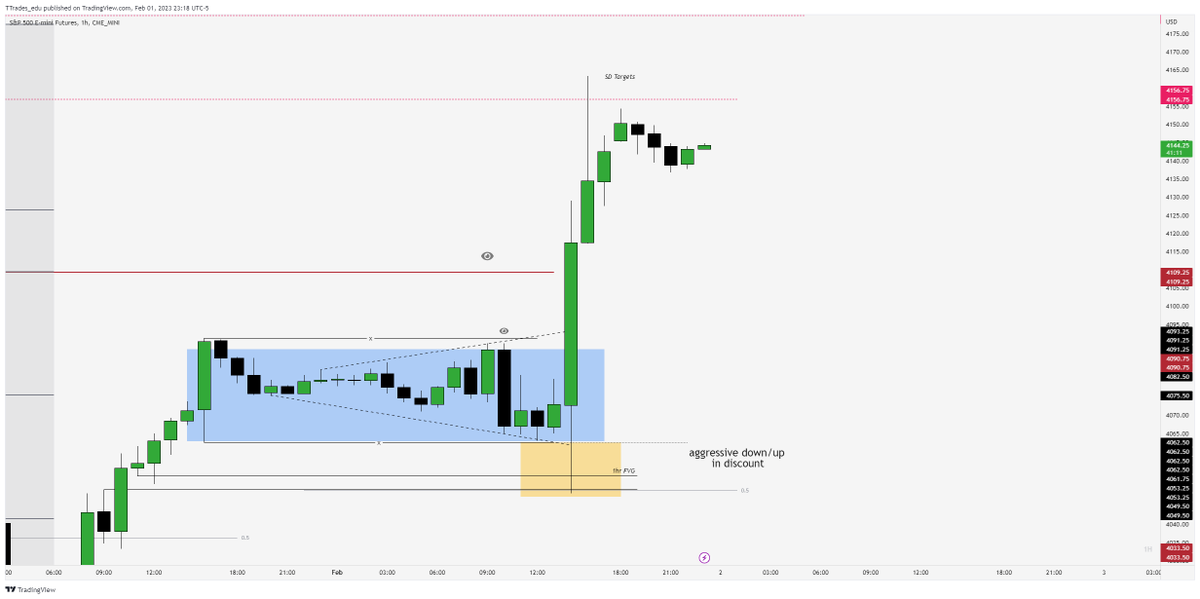
You may also notice I had the targets of 4156.75 and 4180.
why?
Standard deviation targets as well as SSL at 4180
why?
Standard deviation targets as well as SSL at 4180
This should show you why before FOMC i said this
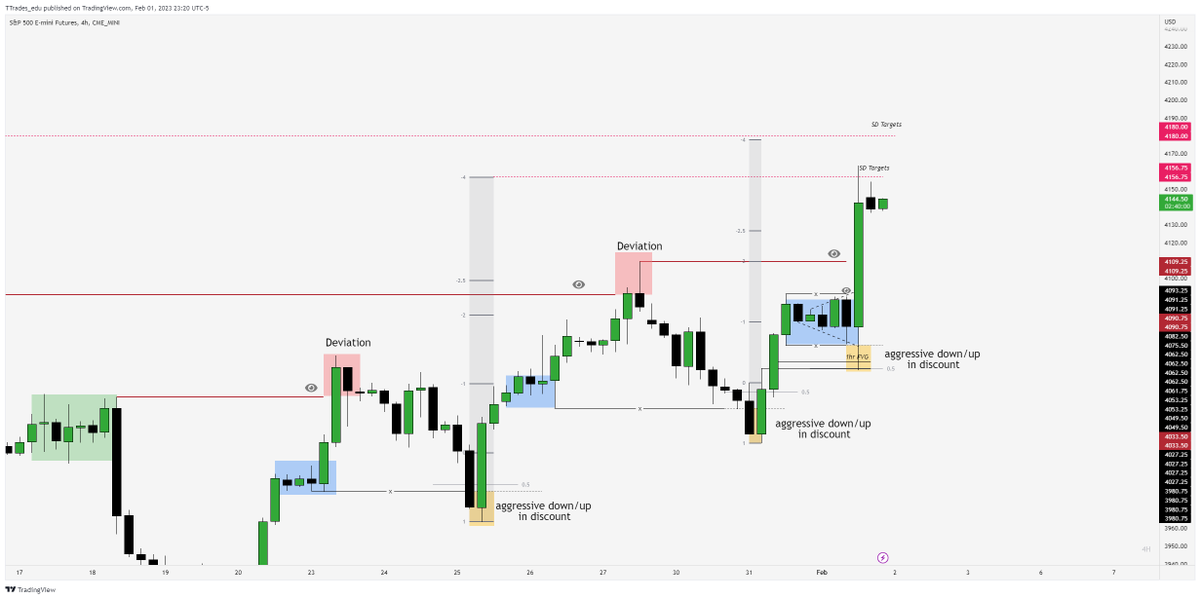
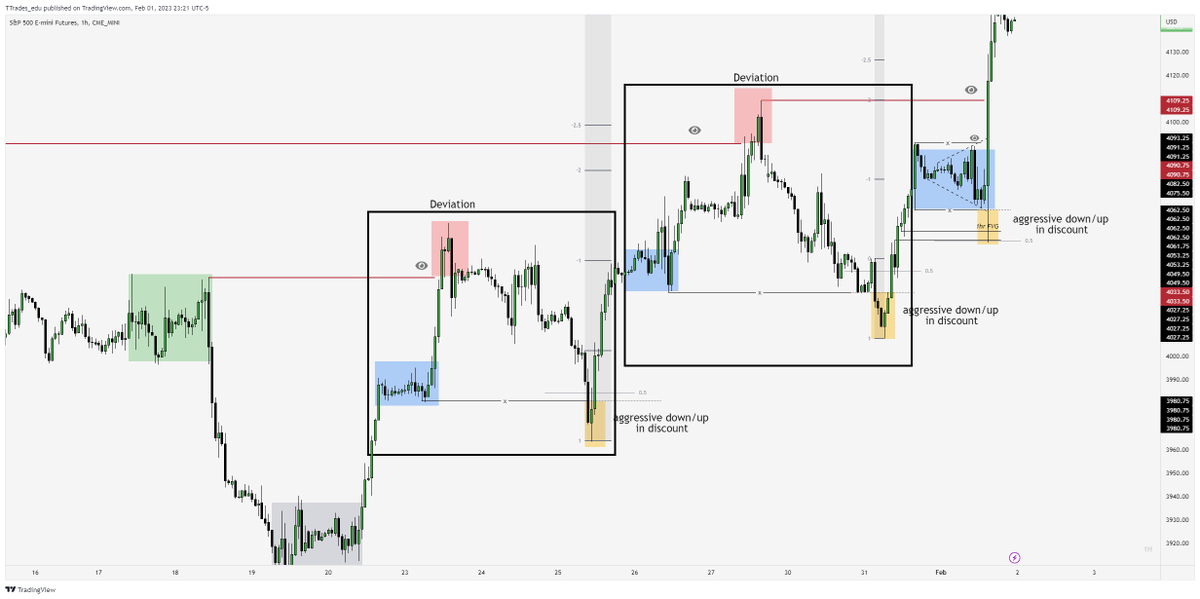
Something else I noticed.
-look how similar these fractals in price are...
I will let you study and look at that for yourself.
-look how similar these fractals in price are...
I will let you study and look at that for yourself.
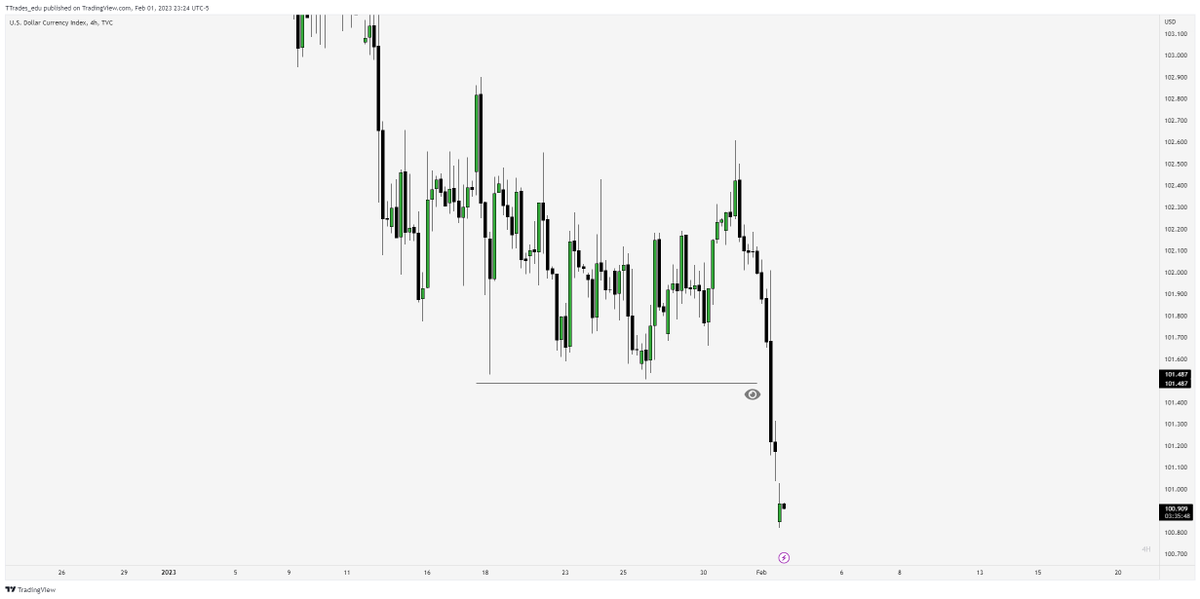
another reason is DXY i wanted these lows ran.. bullish for ES
Picasso.
If enough people want a video explaining it I can do that too. Let me know.
Loading suggestions...