

VWAP is one of the most important indicator which is used by many traders for day trading.
𝗔 𝗧𝗵𝗿𝗲𝗮𝗱 𝗼𝗻 𝗩𝗪𝗔𝗣 🧵
Retweet ♻ for maximum reach.
@kuttrapali26 @caniravkaria @sunilgurjar01 @Anshi_________ @KommawarSwapnil @Jagadeesh0203
𝗔 𝗧𝗵𝗿𝗲𝗮𝗱 𝗼𝗻 𝗩𝗪𝗔𝗣 🧵
Retweet ♻ for maximum reach.
@kuttrapali26 @caniravkaria @sunilgurjar01 @Anshi_________ @KommawarSwapnil @Jagadeesh0203

📍 What is Vwap?
The Volume Weighted Average Price (VWAP) is a tool which is used for day trading only. It shows the average price of a stock weighted by the total trading volume. The VWAP is used to calculate the average price of a stock over a period of time.
The Volume Weighted Average Price (VWAP) is a tool which is used for day trading only. It shows the average price of a stock weighted by the total trading volume. The VWAP is used to calculate the average price of a stock over a period of time.
Generally, whenever the price trades below vwap it should not be bought and if trades above vwap it should not be
sold, but it is not always the case.
Vwap is based on historical data and can be used to determine the right intraday trend.
sold, but it is not always the case.
Vwap is based on historical data and can be used to determine the right intraday trend.
📍Understanding VWAP from buyers' and sellers' points of view.
If VWAP is rising, it shows that buyers are in charge.
If VWAP is falling, it indicates that sellers are in charge.
If VWAP is flat, then the price is trading in a range and no one is in charge of the market.
If VWAP is rising, it shows that buyers are in charge.
If VWAP is falling, it indicates that sellers are in charge.
If VWAP is flat, then the price is trading in a range and no one is in charge of the market.
📍VWAP helps to determine market trends.
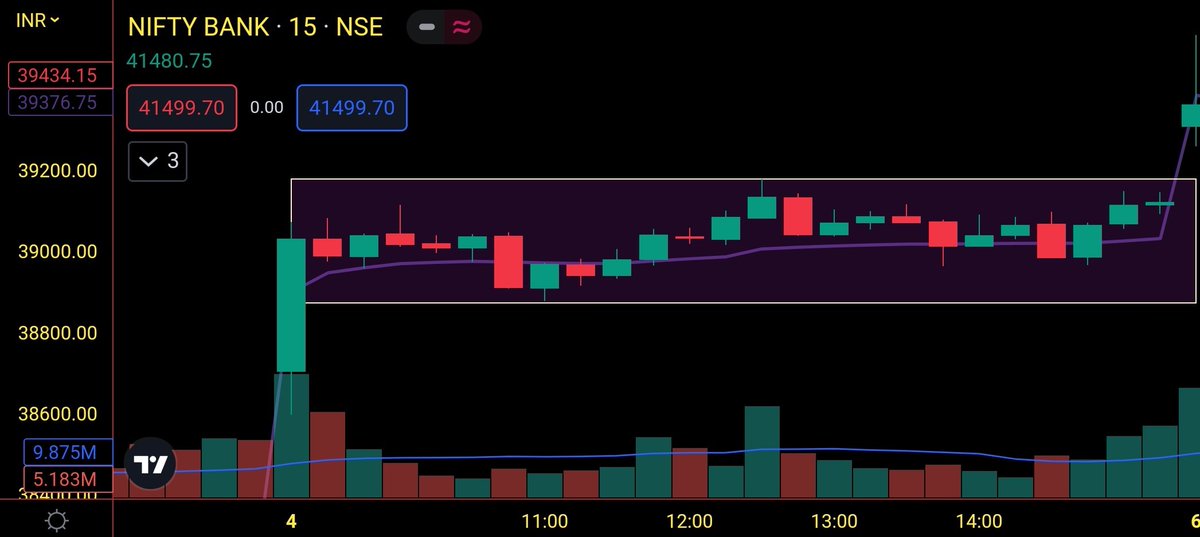
For sideways/Flat days, the price stays around the vwap(purple line) which remains more or less flat.
The image below shows price is trading in a range(rectangle box).
For sideways/Flat days, the price stays around the vwap(purple line) which remains more or less flat.
The image below shows price is trading in a range(rectangle box).
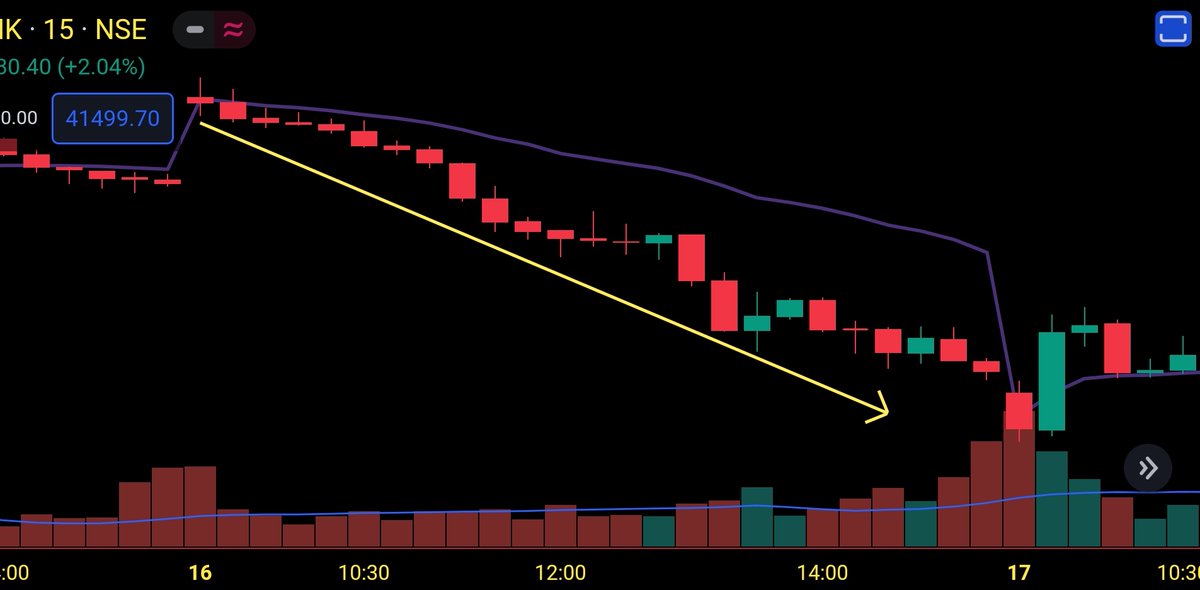
For downward trending days, the price stays below the VWAP(purple line) as shown in the image.
The bigger the distance between vwap and price, the more the strength of the trend.
The below image shows as the gap widen between vwap and price, the strength of the trend increases.
The bigger the distance between vwap and price, the more the strength of the trend.
The below image shows as the gap widen between vwap and price, the strength of the trend increases.
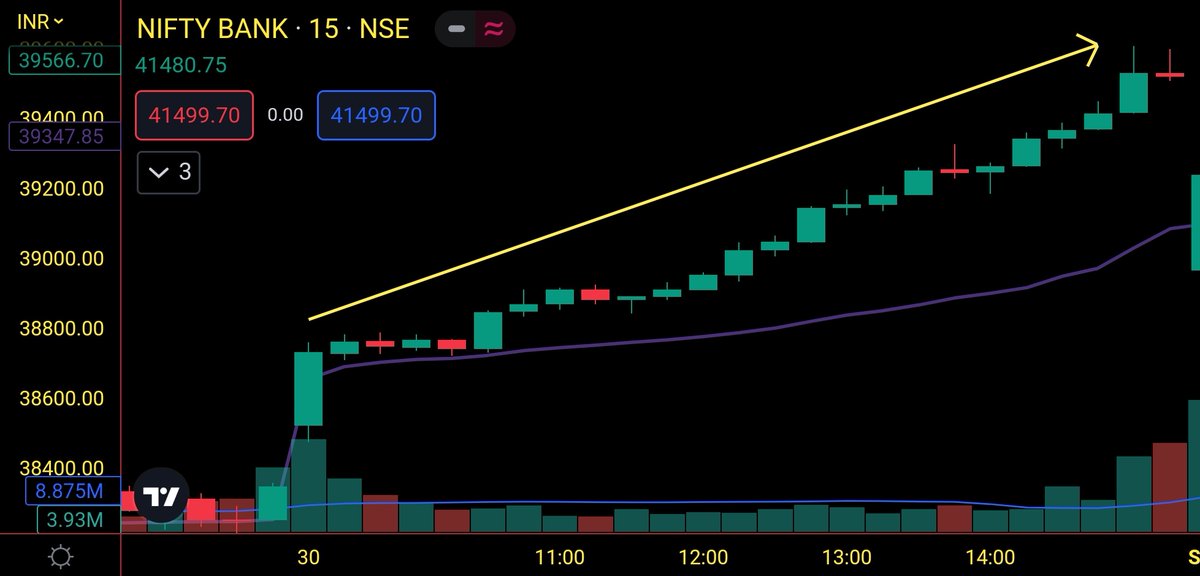
For upward-trending days, the price stays above the VWAP(purple line) as shown in the image.
The bigger the distance between vwap and price, the more the strength of the trend.
The image below shows as the gap widens between vwap and price, the strength of the trend increases.
The bigger the distance between vwap and price, the more the strength of the trend.
The image below shows as the gap widens between vwap and price, the strength of the trend increases.
📍 Application of Vwap.
👉 Price Closes below VWAP
👉 Price Closes above VWAP
👉 Price Bounced from VWAP
👉 Price Rejected from VWAP
👉 Price Closes below VWAP
👉 Price Closes above VWAP
👉 Price Bounced from VWAP
👉 Price Rejected from VWAP
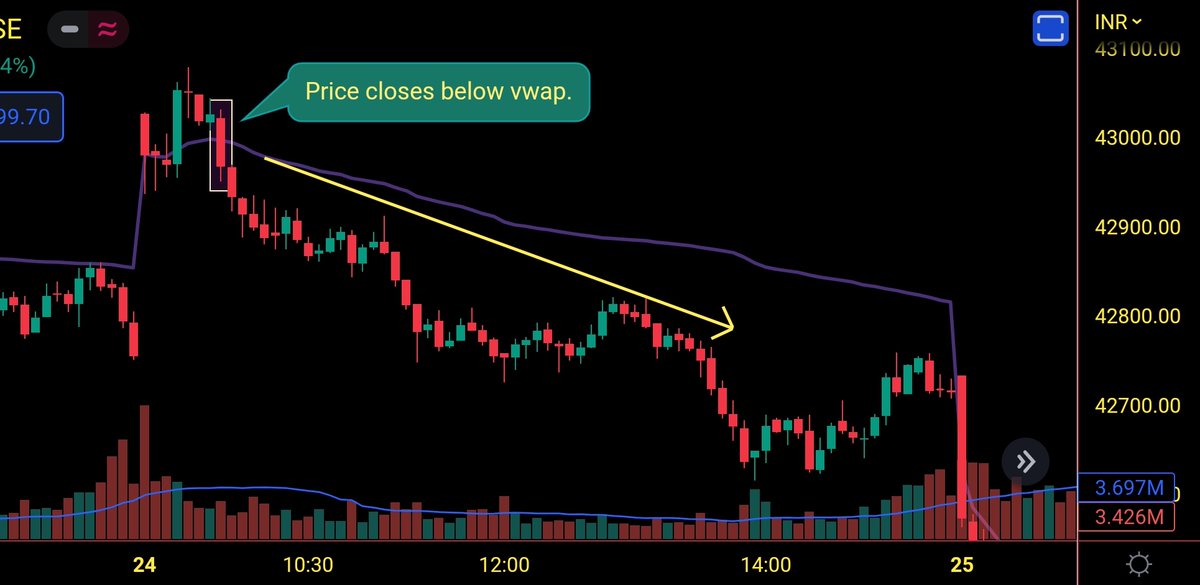
• Price closes below VWAP
Price closes below vwap is a bearish signal. When a 5 min strong candle (marked by a rectangle box) closes below vwap from above, then we can see a trending move downwards as depicted in the image below by the yellow arrow.
Price closes below vwap is a bearish signal. When a 5 min strong candle (marked by a rectangle box) closes below vwap from above, then we can see a trending move downwards as depicted in the image below by the yellow arrow.
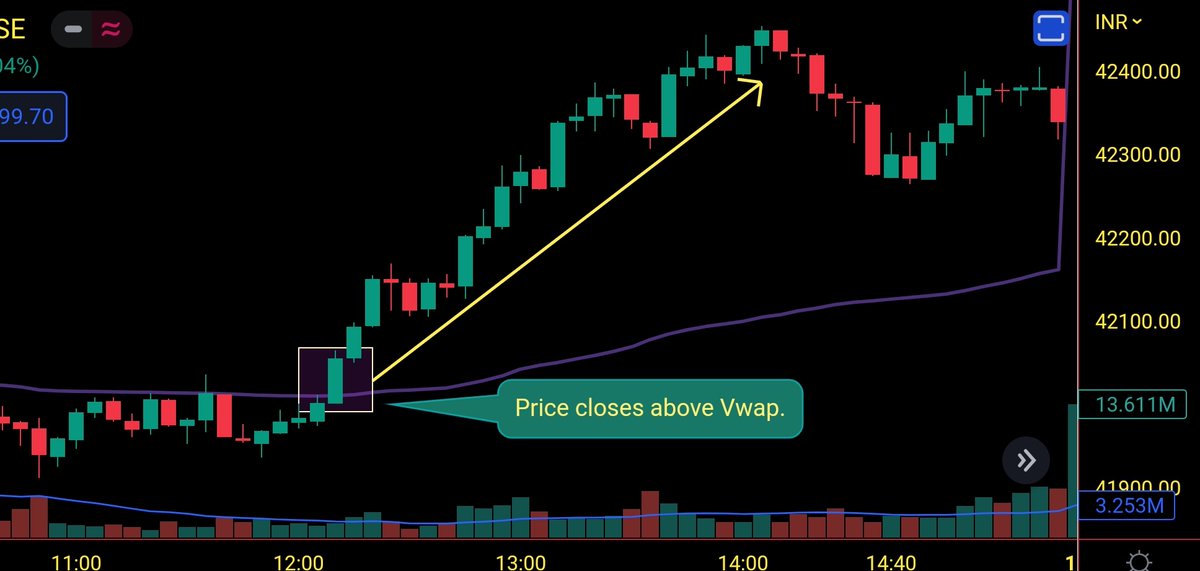
• Price closes above VWAP
Price closes above vwap is a bullish signal. When a 5 min strong candle (marked by a rectangle box) closes above vwap from below, then we can see a trending move upside as depicted in the image below by the yellow arrow.
Price closes above vwap is a bullish signal. When a 5 min strong candle (marked by a rectangle box) closes above vwap from below, then we can see a trending move upside as depicted in the image below by the yellow arrow.
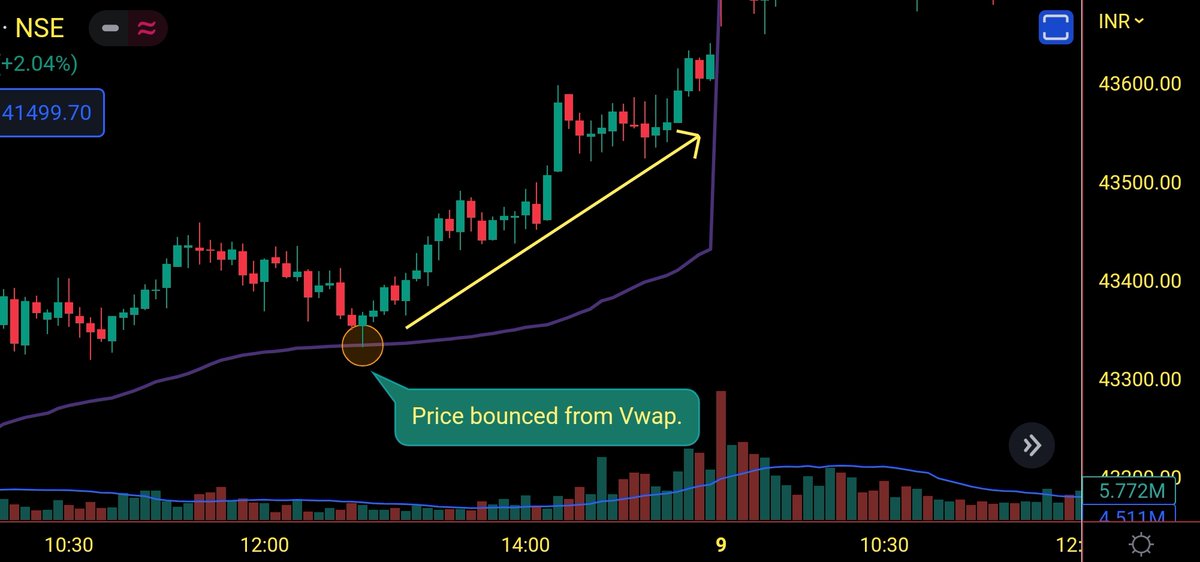
• Price Bounced from VWAP
Vwap acts as major intraday support. When the price bounce from vwap or near vwap and price action forms a bullish pattern, especially hammer, engulfing or bullish pinbar, then we can see an uptrend as depicted in the images below by the yellow arrow.
Vwap acts as major intraday support. When the price bounce from vwap or near vwap and price action forms a bullish pattern, especially hammer, engulfing or bullish pinbar, then we can see an uptrend as depicted in the images below by the yellow arrow.
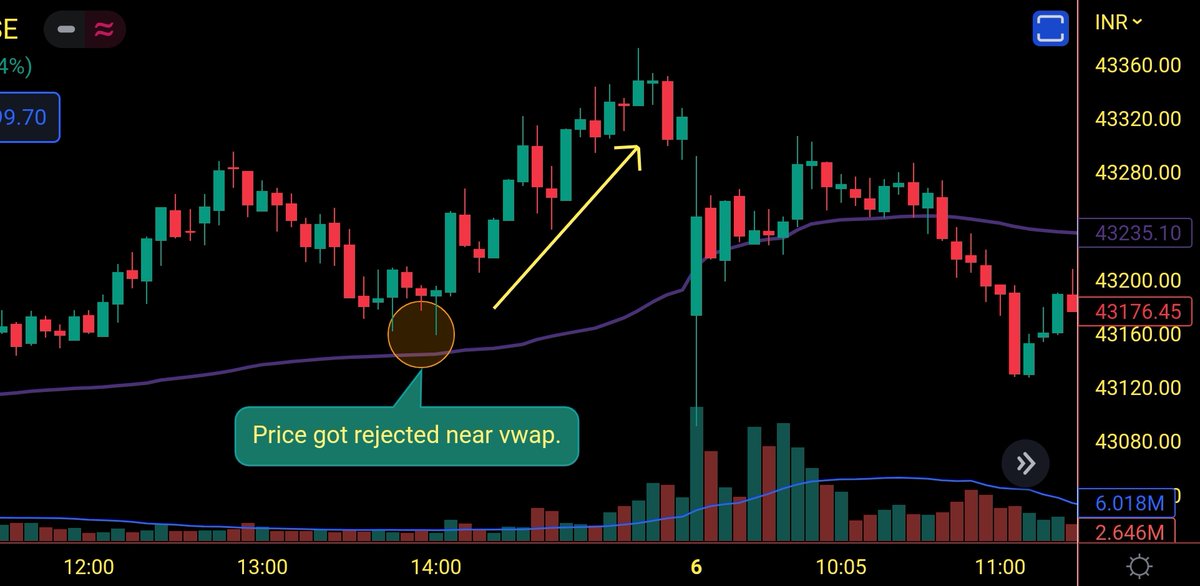
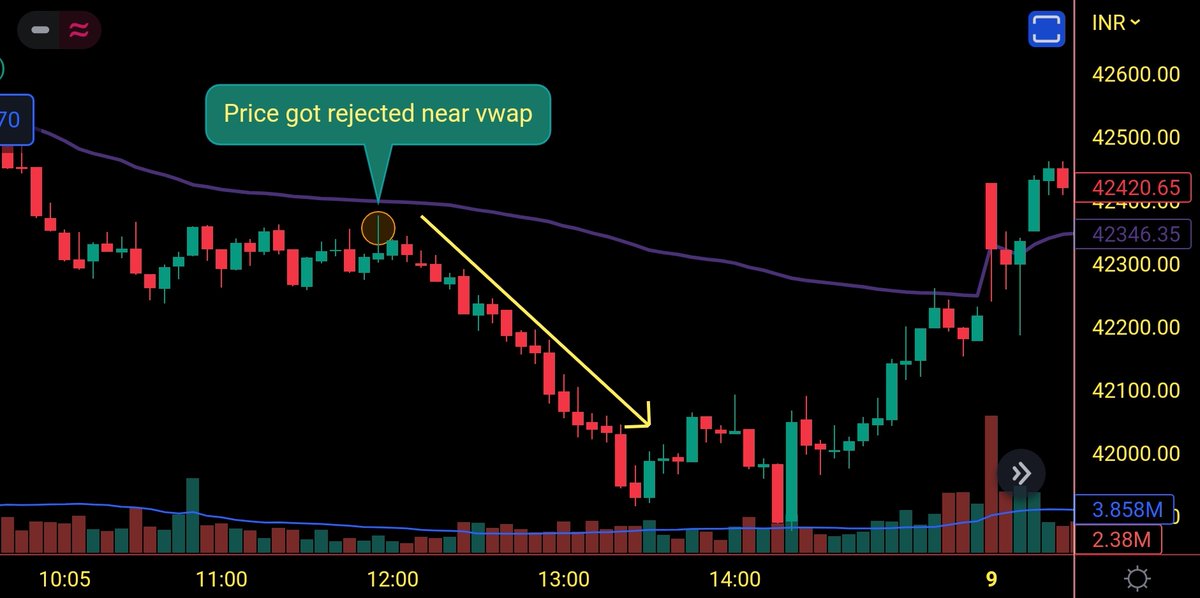
• Price rejected from VWAP
Vwap acts as major intraday resistance. When the price gets rejected from vwap or near vwap and price forms a bearish pattern especially a shooting star or bearish pin bar, then we can see a downtrend as depicted in the images below by a yellow arrow.
Vwap acts as major intraday resistance. When the price gets rejected from vwap or near vwap and price forms a bearish pattern especially a shooting star or bearish pin bar, then we can see a downtrend as depicted in the images below by a yellow arrow.

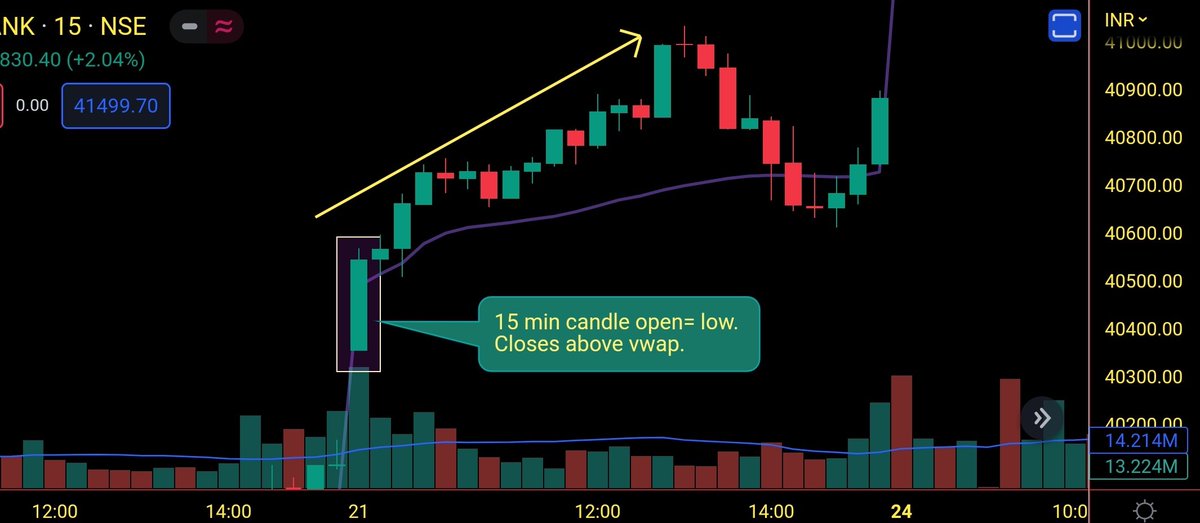
📍VWAP Intraday Strategy.
When the first 15 min candles (9:15-9:30) open=low and closes above vwap, then usually we can see an uptrend as shown in the image below by the yellow arrow.
RSI should be above 60 and below 80.
When the first 15 min candles (9:15-9:30) open=low and closes above vwap, then usually we can see an uptrend as shown in the image below by the yellow arrow.
RSI should be above 60 and below 80.
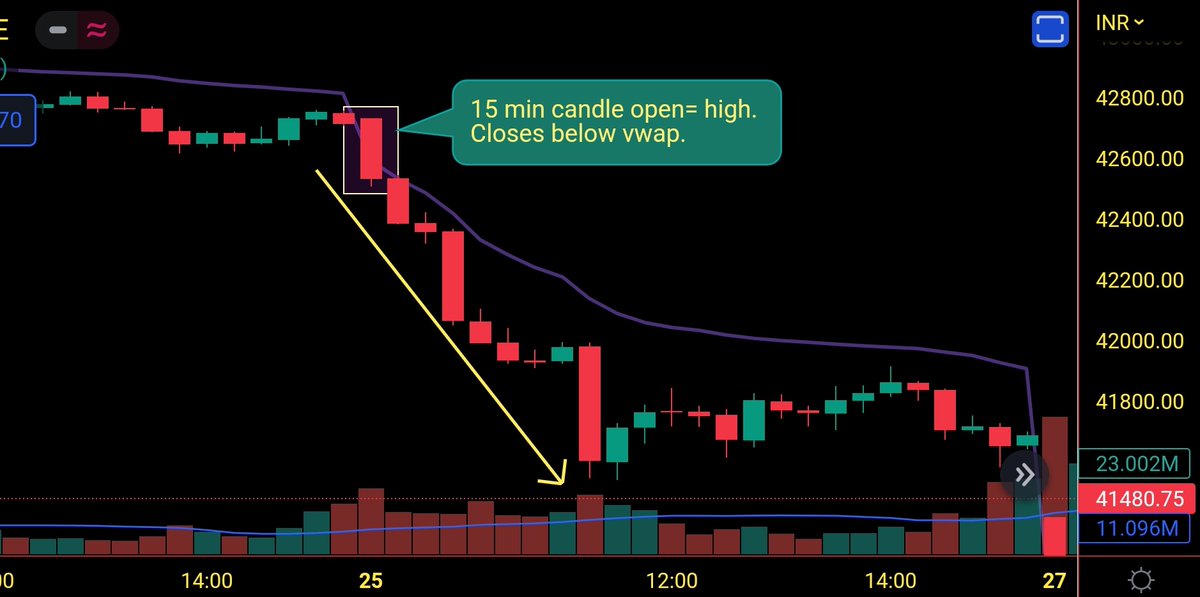
When the first 15 min candles (9:15-9:30) open=high and closes below vwap, then usually we can see a downtrend as shown in the image below by the yellow arrow.
RSI should be below 40 and above 20.
RSI should be below 40 and above 20.
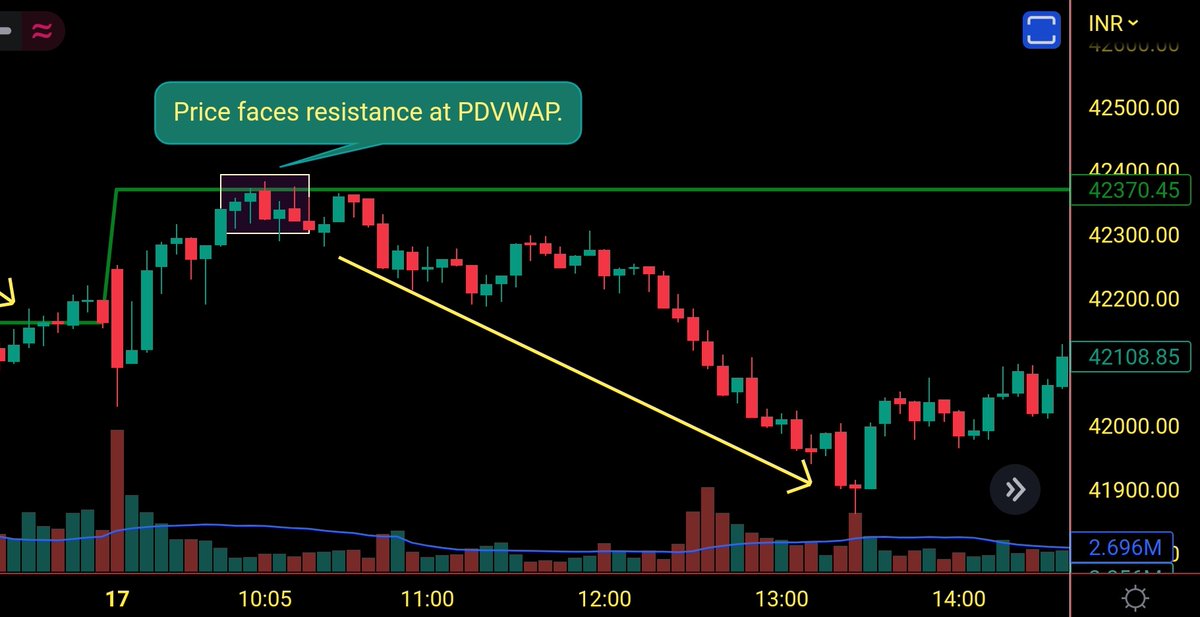
📍Application of Previous Day VWAP.
Previous day VWAP (PDVWAP) acts as major support and resistance for day trading.
In the image below, we can see the price took the support of PDVWAP (green line) and then the price starts an uptrend as marked by the yellow arrow.
Previous day VWAP (PDVWAP) acts as major support and resistance for day trading.
In the image below, we can see the price took the support of PDVWAP (green line) and then the price starts an uptrend as marked by the yellow arrow.

In the image below, we can see the price faces resistance from PDVWAP (green line) and starts a downtrend as marked by the yellow arrow.
That's a wrap!
If you enjoyed this thread:
1. Follow @me__kaushik for more threads relating to trading.
2. RT the first tweet of this thread for maximum reach.
You can also join our telegram channel where we provide live market updates.
t.me
If you enjoyed this thread:
1. Follow @me__kaushik for more threads relating to trading.
2. RT the first tweet of this thread for maximum reach.
You can also join our telegram channel where we provide live market updates.
t.me

Loading suggestions...