
I AM GETTING ARRESTED FOR EXPOSING THESE POWERFUL DAILY CANDLESTICK PATTERNS.
(A Thread)
(A Thread)
The SEC are probably going to come after my a*s for exposing these very consistent daily candlestick patterns but that's a little price to pay for making sure my followers conquer the financial markets.

If you've been following the threads from the first part I appreciate you.
If you haven't, kindly stop reading this thread and go through the previous threads for better understanding. 👇🏾👇🏾👇🏾
If you haven't, kindly stop reading this thread and go through the previous threads for better understanding. 👇🏾👇🏾👇🏾
Before we get down to business,
Let me explain how I discovered the top-secret information I'm about to share.
Let me explain how I discovered the top-secret information I'm about to share.

March 14, 2021.
By midnight, there I was, hopelessly staring at the charts. Backtesting on the daily,weekly and monthly charts because I couldn't afford the Tradingview premium plan.
The bar replay speed was set to the lowest as I kept on watching each candlestick as it formed.
By midnight, there I was, hopelessly staring at the charts. Backtesting on the daily,weekly and monthly charts because I couldn't afford the Tradingview premium plan.
The bar replay speed was set to the lowest as I kept on watching each candlestick as it formed.
I did this repeatedly, paying attention to each candlestick and the next and the next of the next.
Surprisingly, I saw a pattern. It was there! It's always been there but for some reason it became visible.
I could see beyond japanese candlesticks, I could see the "rythmn"!
Surprisingly, I saw a pattern. It was there! It's always been there but for some reason it became visible.
I could see beyond japanese candlesticks, I could see the "rythmn"!

My entire face brightened up as though I found water in the middle of the Sahara.
There was a series of patterns that repeated almost every d*mn time!
Quickly I moved to other pairs, securities and asset classes and it was there, it was everywhere.
There was a series of patterns that repeated almost every d*mn time!
Quickly I moved to other pairs, securities and asset classes and it was there, it was everywhere.
In this thread, I'll be sharing 2 of these candlestick patterns.
I have disclosed this info to a handful of folks but I decided it's time to share it publicly.
I have disclosed this info to a handful of folks but I decided it's time to share it publicly.
Big credits to Michael Huddleston. His teachings were the blueprints I used to spot these patterns.
Let us begin.

I derived the first pattern from the ICT's Swing high and low candlestick formation.
This formation consists of three candlesticks with the candlestick in the middle having the highest or lowest wick.
See reference image below for better understanding. 👇🏾👇🏾
This formation consists of three candlesticks with the candlestick in the middle having the highest or lowest wick.
See reference image below for better understanding. 👇🏾👇🏾
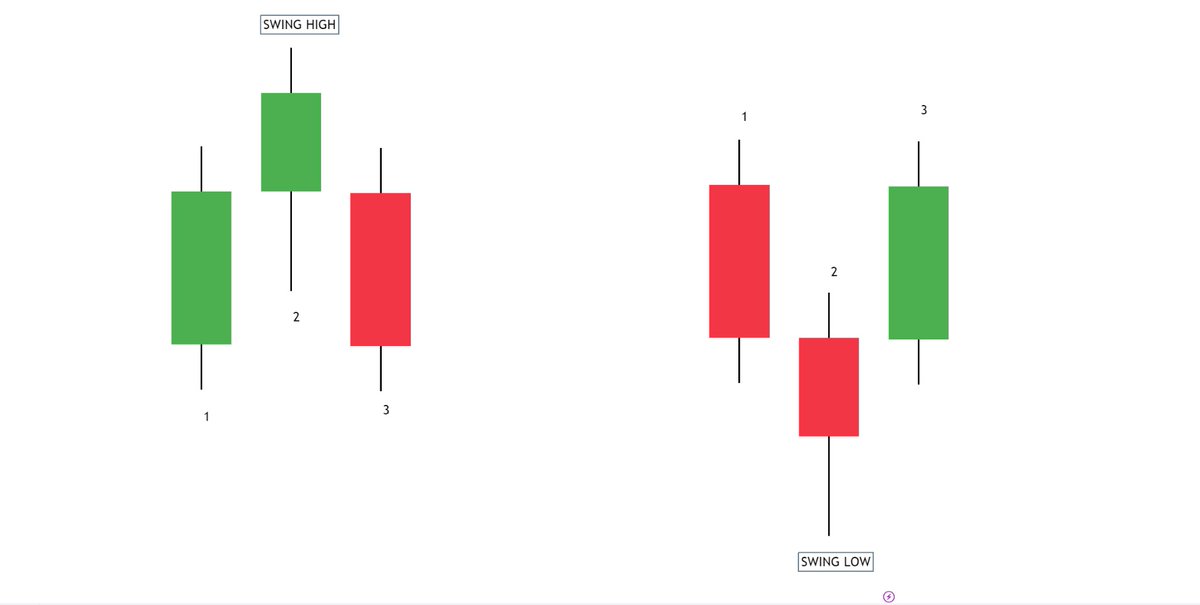
Now, this candlesick formation isn't the main area of focus. What we are looking out for is the candle that follows a swing high/low (The fourth candle).
90% of the time the fourth candle sweeps the third candle's high/low.
If you have a swing high, expect the fourth candle to sweep the third candle's low.
If you have a swing low, expect the fourth candle to sweep the third candle's high.
Study these BTC Daily and Monthly Charts
If you have a swing high, expect the fourth candle to sweep the third candle's low.
If you have a swing low, expect the fourth candle to sweep the third candle's high.
Study these BTC Daily and Monthly Charts
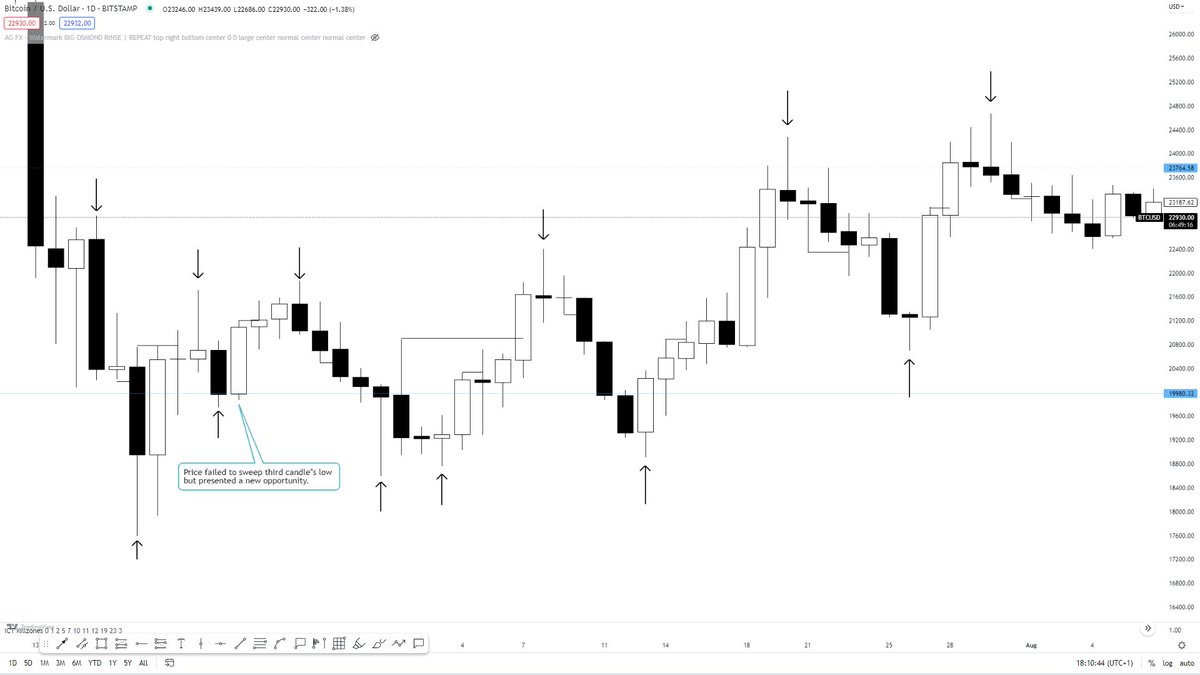
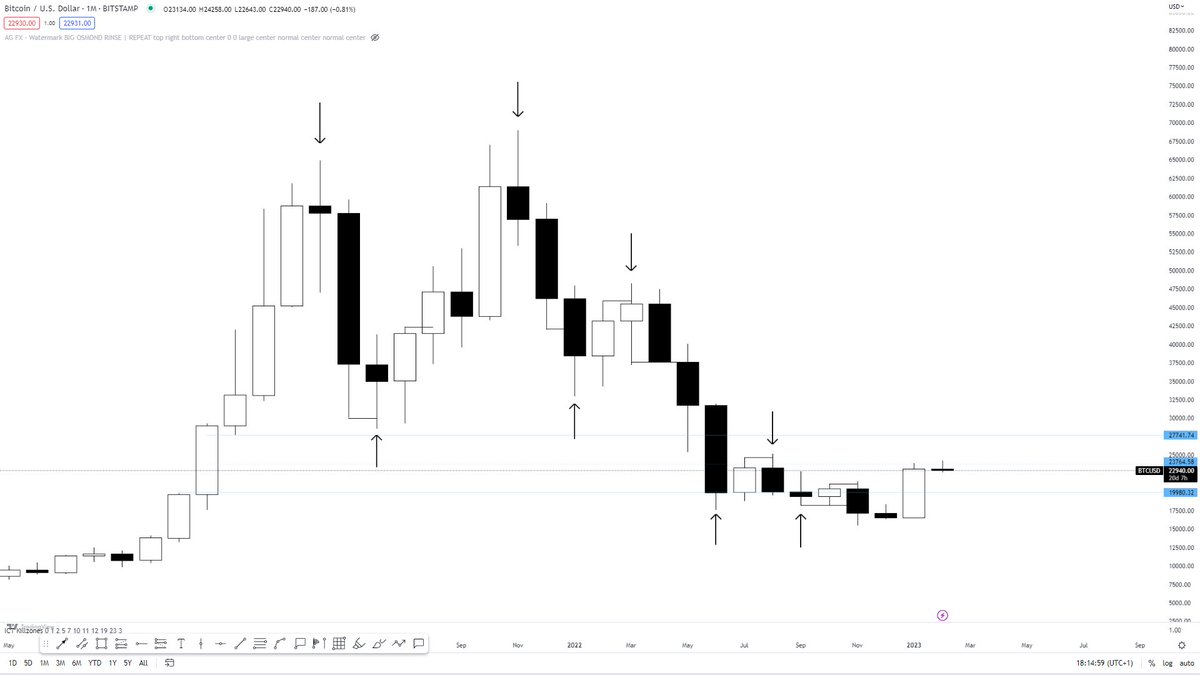
This is one of the ways I have been able to consistently call price levels before hand.

Ps: In some cases the third candle's high/low gets swept by the fifth,sixth or even seventh candle.
The point is to use this simple candlestick pattern to build a daily, weekly or monthly bias.
The point is to use this simple candlestick pattern to build a daily, weekly or monthly bias.
At this point, you're probably wondering, "if price is fractal, this same pattern should work in the lower timeframe".
I've backtested and trust me, it's not as consistent as it is on the daily, weekly and monthly. 😅
I've backtested and trust me, it's not as consistent as it is on the daily, weekly and monthly. 😅
Let's pause here and take the time to backtest this candlestick pattern.
200 Retweets on this thread and I'll share the second "top -secret" candlestick pattern.
200 Retweets on this thread and I'll share the second "top -secret" candlestick pattern.
I hope this was insightful?
If it was kindly FOLLOW, drop a LIKE and RETWEET to get this thread across to alot more people 🙏🏼
If it was kindly FOLLOW, drop a LIKE and RETWEET to get this thread across to alot more people 🙏🏼
I'd love to connect with you on WhatsApp.
Send me a message with your name via this link. 👇🏾👇🏾
wa.me
Send me a message with your name via this link. 👇🏾👇🏾
wa.me
PART 4
Loading suggestions...