

Did the market find bottom last October, even though earnings are only now beginning to decelerate? Let's see what history can tell us. 🧵
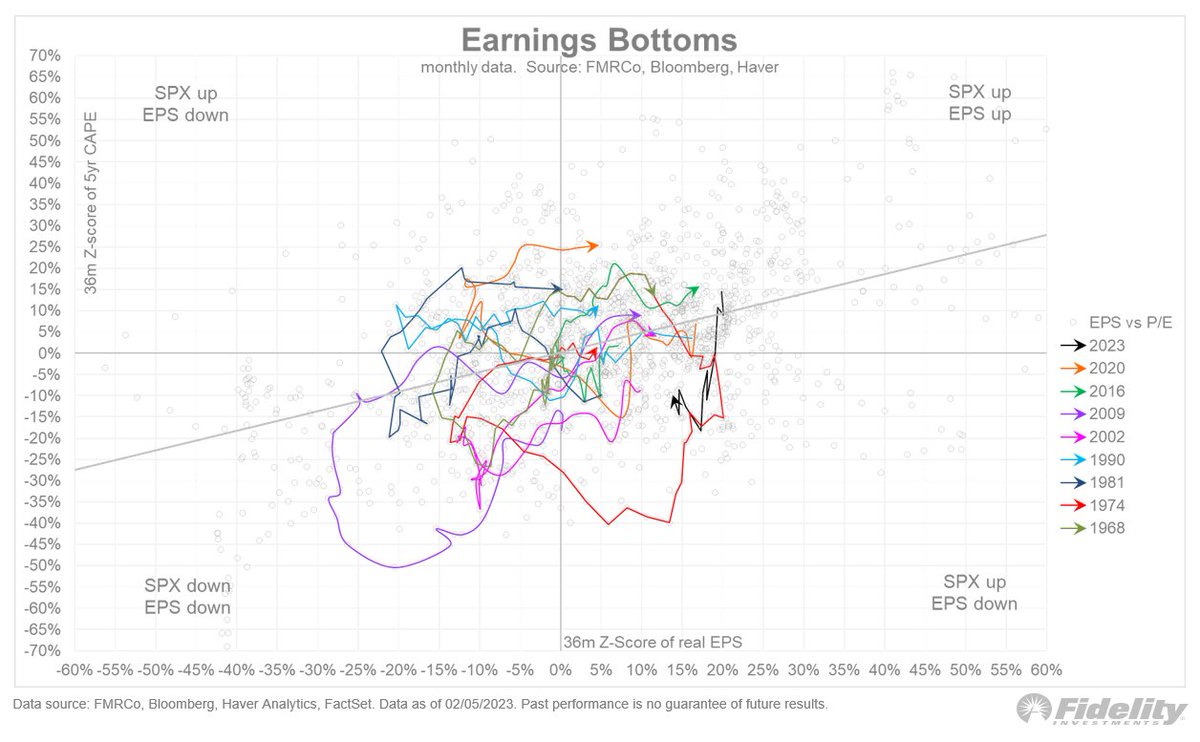
To highlight past cycles, the chart above shows a scatter plot of the 36-month Z-score of real earnings (horizontal) against the Z-score of the 5-year CAPE ratio (cyclically-adjusted P/E ratio). /2
You can see that the correlation is generally positive, but there’s a lot of zigging and zagging at the tails. /3
The chart includes a few relevant analogs for today’s cycle: 2020, 2016, 2009, 2002, 1990, 1981, 1974, and 1968. The purpose is to see how far in advance of an earnings inflection the market tends to recover. /4
The 2016 mini-cycle is included because it was a soft-landing that produced only a slight contraction in earnings growth (much like is expected today). /5
For the lows to be in, this cycle will have to become a repeat of 2016, where the Fed pivots just in time before earnings produce a left tail. /6
There's a lot going on in that chart, I know, so in my next thread, I will examine the analogs individually, which should offer a clearer comparison between today's cycle and comparable past ones. /END
Correction: the bottom right quadrant should say SPX down EPS up. Too much copying & pasting of labels!
Loading suggestions...