

"How to Synchronize with the Market Flow"
The Daily chart is where we go to look for key levels, but sometimes we fail to see the Flow as we look to get into smaller timeframes.
The purpose of this thread is to help you find out how to track it from the 15 min chart as I do.
The Daily chart is where we go to look for key levels, but sometimes we fail to see the Flow as we look to get into smaller timeframes.
The purpose of this thread is to help you find out how to track it from the 15 min chart as I do.
First we must understand that given the fractality of the market, being able to use lower timeframes allows you to anticipate candlestick formation and have a better profit with a controlled risk.
Personally, I find the 15m chart to be the most appropriate to look for.
Personally, I find the 15m chart to be the most appropriate to look for.
The first thing I always do is to look at 00:00 NY time, Michael has told us that this is the time when the algorithms are programmed to determine the movements of the day.
Step 1: Mark the time 00:00 of the last 3 days
Step 1: Mark the time 00:00 of the last 3 days
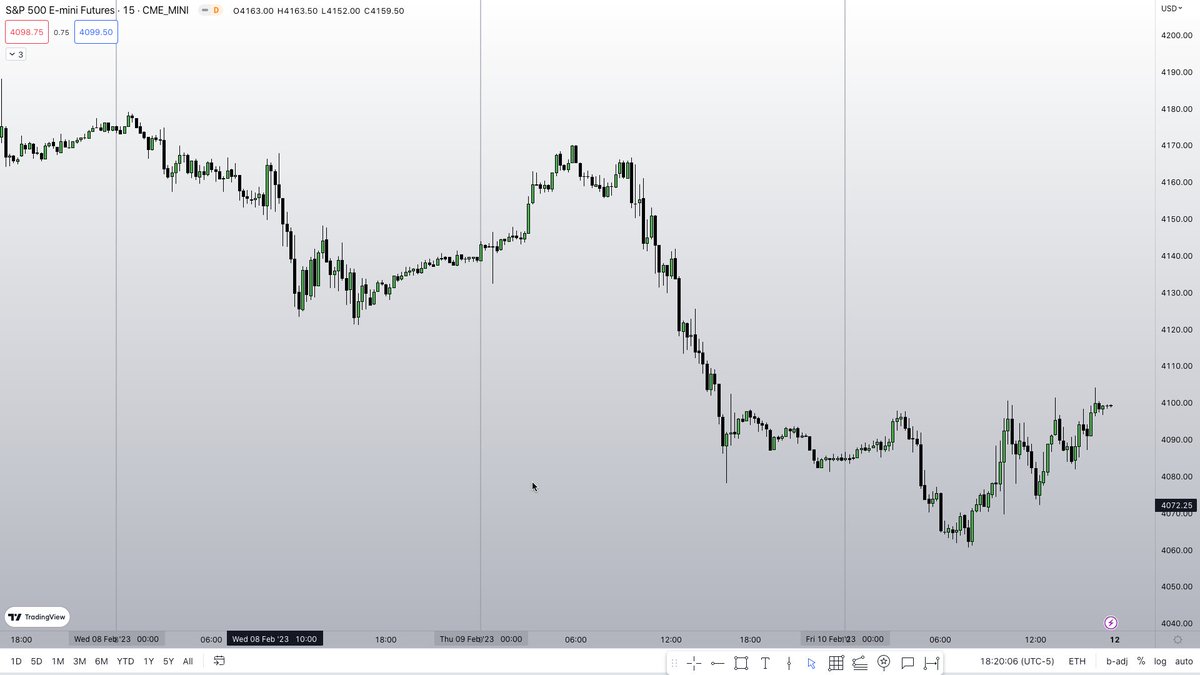
Why 3 days?
Because the formation of a Swing Point needs 3 candles and this way if your focus is to be an intraday trader it is the best way to look for consistent movements.
It will help us to identify potential targets and catalyst levels that accelerate the price...
Because the formation of a Swing Point needs 3 candles and this way if your focus is to be an intraday trader it is the best way to look for consistent movements.
It will help us to identify potential targets and catalyst levels that accelerate the price...
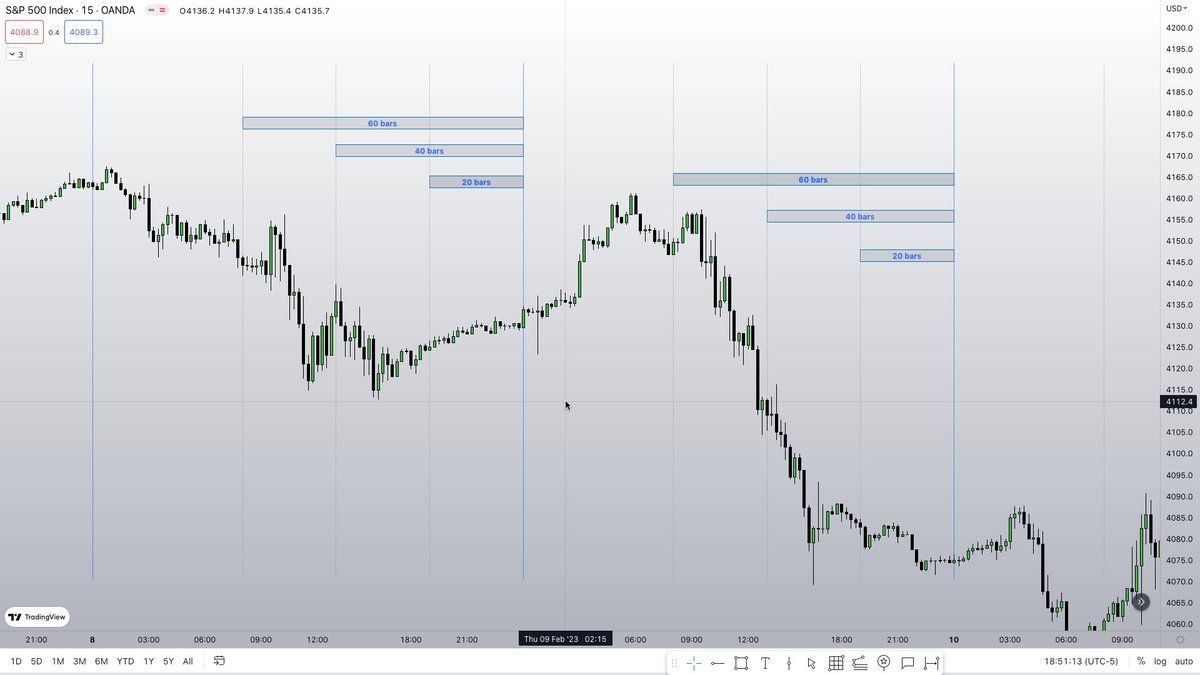
Once located at your 00:00 time, we will start looking back...
Using the 20-40-60 logic that Michael uses applied to this temporality we get the following:
20 * 15min = 300min (8:00am)
40 * 15min = 600min (1:00pm)
60* 15min = 900min (7:00pm)
Using the 20-40-60 logic that Michael uses applied to this temporality we get the following:
20 * 15min = 300min (8:00am)
40 * 15min = 600min (1:00pm)
60* 15min = 900min (7:00pm)
Draw horizontal lines in the hours that I marked in the last tweet and you can use if you want some other indicator I'll put it just for you to understand it more clearly.
You have to get something like this.
You have to get something like this.
If you are observant you will notice that within these time intervals you will find the following:
8:00 am to 13:00pm -> NY a.m Session to Lunch Session.
13:00pm to 19:00pm -> NY p.m Session to Close
19:00pm to 00:00 -> Close to Midnight ...
8:00 am to 13:00pm -> NY a.m Session to Lunch Session.
13:00pm to 19:00pm -> NY p.m Session to Close
19:00pm to 00:00 -> Close to Midnight ...
These times are very important because the algorithm internally leaves liquidity in the form of Stops to be taken later.
So identifying this is crucial to know what the algorithm is doing and to be able to synchronize with it...
So identifying this is crucial to know what the algorithm is doing and to be able to synchronize with it...
Now you are going to mark each High and Low of these times until the next cycle, you can drag the lines to the current time but you would have a very dirty chart, I recommend you to use it like me and only extend the one you need at the moment to have more clarity.
You will get something like the following:
Now you can see more clearly how the algorithm works.
Combining these levels with PD Arrays on the Daily Timeframe is practically all you need to determine market flow...
Now you can see more clearly how the algorithm works.
Combining these levels with PD Arrays on the Daily Timeframe is practically all you need to determine market flow...

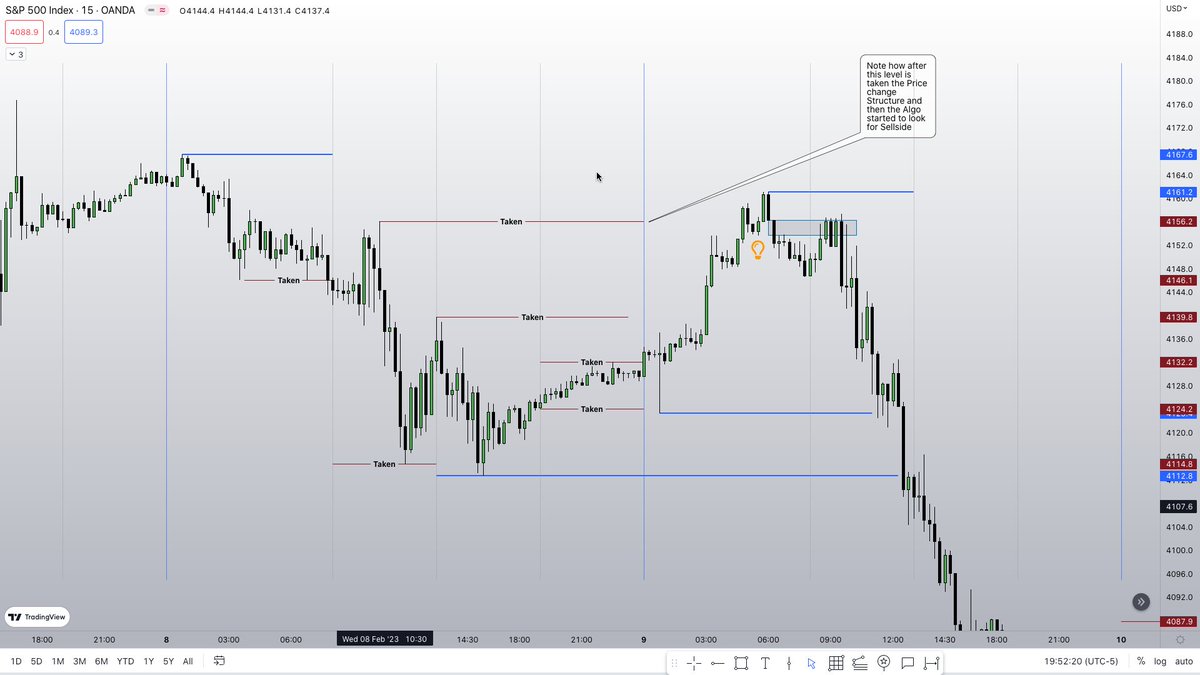
Now let's follow the price with an example:
The red colored lines I will leave as levels that have already been taken and the blue ones what are left open.
Example of 8 & 9 of February 2023 $ES:
The red colored lines I will leave as levels that have already been taken and the blue ones what are left open.
Example of 8 & 9 of February 2023 $ES:
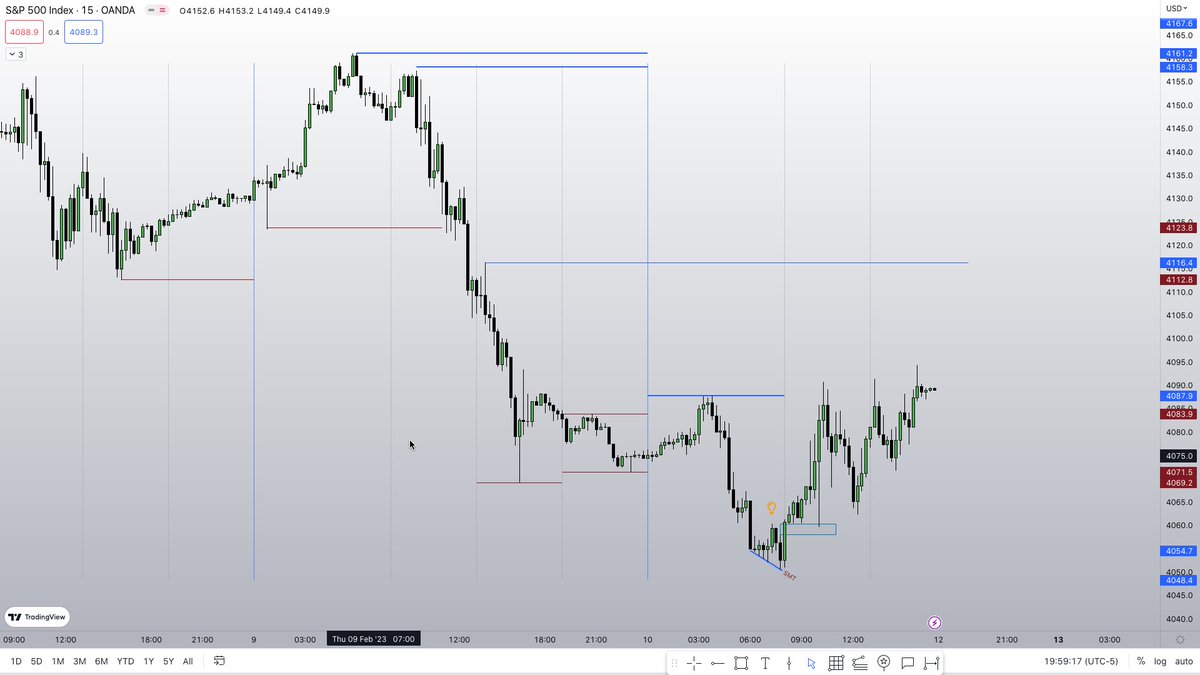
Another example from today 9/Feb/23.
SMT at 8:00am, then MSS to start looking for BuyStops.
The key is to search for MSS after liquidity is taken and then target oposite liquidity or PD arrays.
I hope this little guide will help you learn how to follow price.
SMT at 8:00am, then MSS to start looking for BuyStops.
The key is to search for MSS after liquidity is taken and then target oposite liquidity or PD arrays.
I hope this little guide will help you learn how to follow price.
Loading suggestions...