

The inverted yield curve is a reliable predictor of a recession.
And it’s inverted now.
Use Python to visualize the yield curve over time:
And it’s inverted now.
Use Python to visualize the yield curve over time:

First, import the libraries you need.
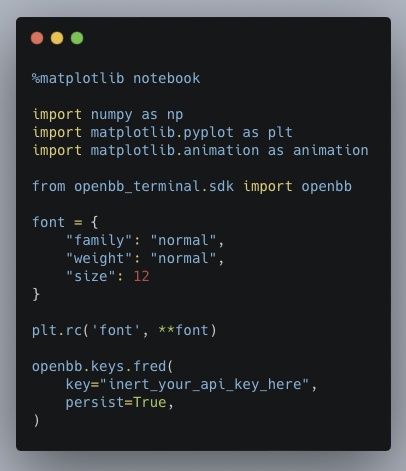
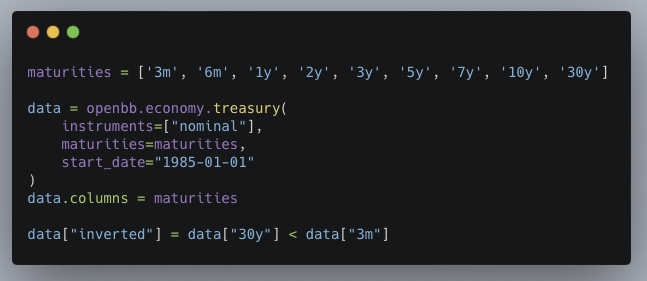
Then, grab the data for free from the OpenBB SDK.
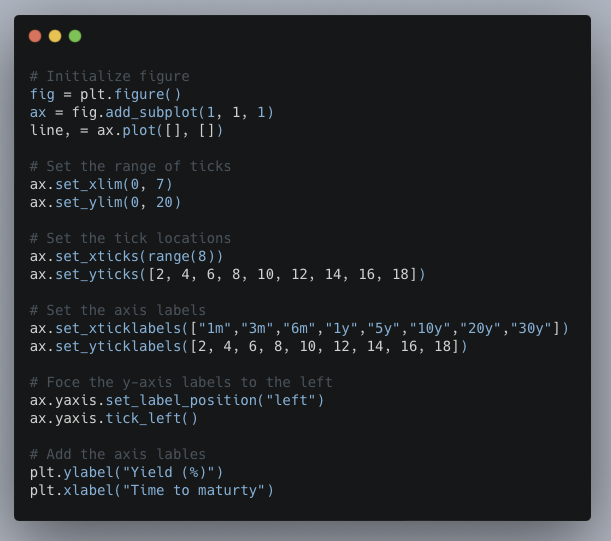
Setup the chart of animation.
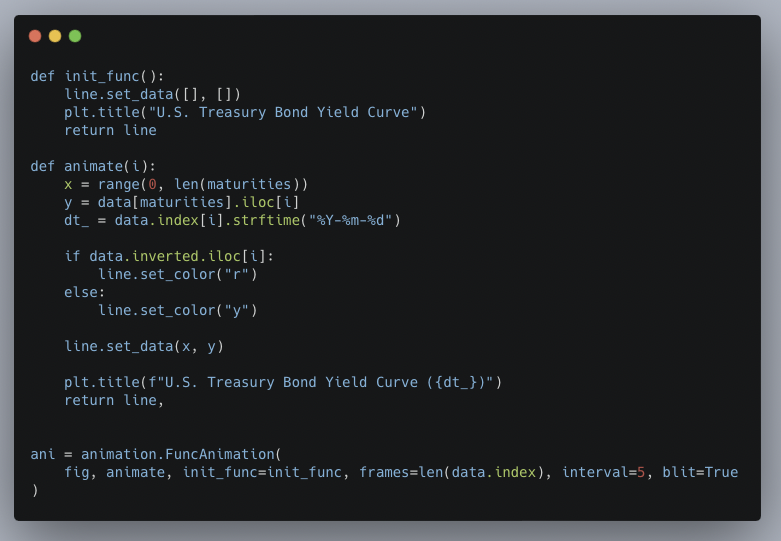
Create the animated plot.
If you’re interested in a reliable predictor of recessions, I go through it all in detail in a recent newsletter issue.
• Understand the inverted yield curve
• Get data from the OpenBB SDK
• Create animated charts
You can read it here for free:
pyquantnews.com
• Understand the inverted yield curve
• Get data from the OpenBB SDK
• Create animated charts
You can read it here for free:
pyquantnews.com
If you're not ready to check out the details, click the link below.
Then retweet the top tweet to remind yourself to check it out later!
Then retweet the top tweet to remind yourself to check it out later!
Loading suggestions...