

1/4
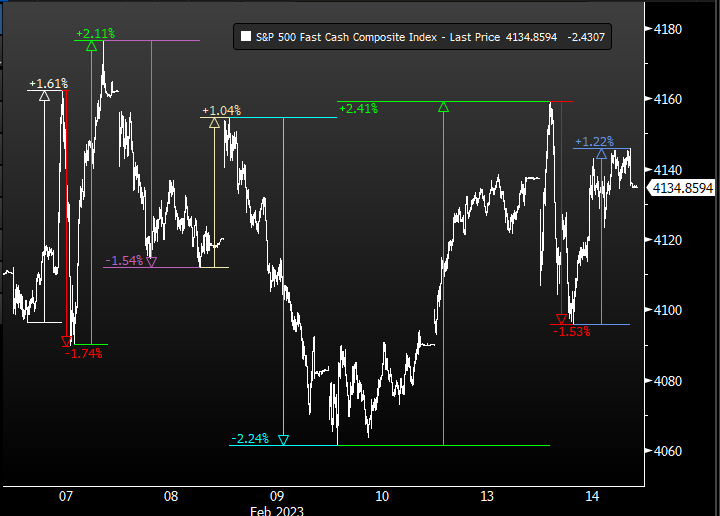
Tick chart of the NYSE-ONLY session for the SPX (9:30AM-4PM ET). It shows the last week (Feb 7 - 14).
Highlighted and admittedly messy are all the 1% reversals in the S&P over this time frame.
The S&P 500 has reversed NINE times. FOUR of these reversals are > 2%.
Tick chart of the NYSE-ONLY session for the SPX (9:30AM-4PM ET). It shows the last week (Feb 7 - 14).
Highlighted and admittedly messy are all the 1% reversals in the S&P over this time frame.
The S&P 500 has reversed NINE times. FOUR of these reversals are > 2%.
2/4
Overall, the S&P 500 is up less than 1% during these NINE reversals. And this gain is purely a function of the 9th reversal being up 1.22%.
IOW, if the 10th reversal is down more than 1% tomorrow, the SPX will not have gained any ground during this rollercoaster ride.
Overall, the S&P 500 is up less than 1% during these NINE reversals. And this gain is purely a function of the 9th reversal being up 1.22%.
IOW, if the 10th reversal is down more than 1% tomorrow, the SPX will not have gained any ground during this rollercoaster ride.
3/4
Here are the 25 most traded options today.
* 16 are S&P 500 ETF options (SPY) that expired today
* 5 are TSLA options that expire Friday
* 4 are S&P 500 ETF options that expire tomorrow.
Here are the 25 most traded options today.
* 16 are S&P 500 ETF options (SPY) that expired today
* 5 are TSLA options that expire Friday
* 4 are S&P 500 ETF options that expire tomorrow.

4/4
None of these 25 most traded options today are part of the VIX calc, as it uses SPX options that expire in 30 days.
The VIX is the "fear gauge." The assumption is it measures heavily traded options. It no longer does.
Using the VIX as a measure of "fear" is now suspect.
None of these 25 most traded options today are part of the VIX calc, as it uses SPX options that expire in 30 days.
The VIX is the "fear gauge." The assumption is it measures heavily traded options. It no longer does.
Using the VIX as a measure of "fear" is now suspect.
Loading suggestions...