

Nifty Case - How I Play my View combined with my System-A Thread
VIEW :
This is weekly chart of NIFTY in Terms of GOLD - Nifty Gold Ratio. The Chart Goes Back to before 2000, almost 25+ Years. The RSI never ever touched 80, except 2020 Pre Covid Times.
VIEW :
This is weekly chart of NIFTY in Terms of GOLD - Nifty Gold Ratio. The Chart Goes Back to before 2000, almost 25+ Years. The RSI never ever touched 80, except 2020 Pre Covid Times.
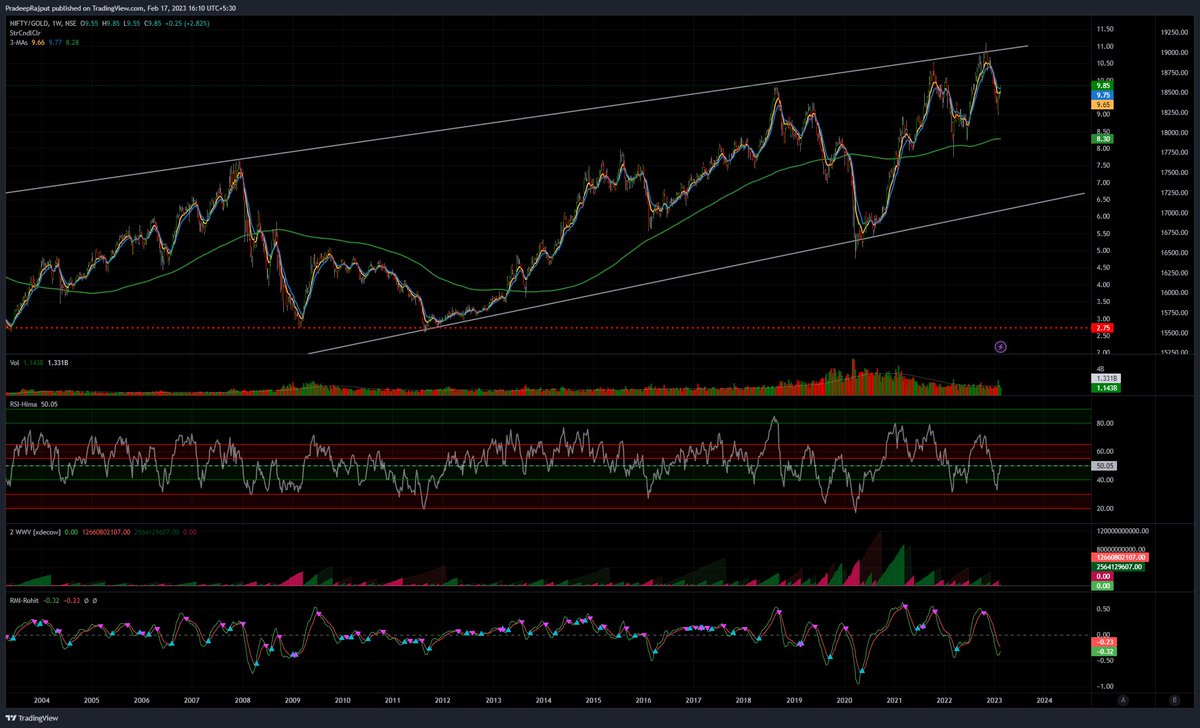
Further, the Upper and Lower Channel has always acted as Resistance and Support WITH OB and OS RSI Readings. Whenever Touching Upper Channel and RSI between 70-75, it has come down and touched the lower Band within 18-24 Months
This time it has touched the Upper band Twice With RSI OB Reading -First Nov21 and Then Nov22. If We Start with Nov 21, 24 months falls Somewhere around Oct23.
During This phenomenon, NIfty makes its Bottom before this Ratio bottoms out. Now i come to the Daily chart
During this downfall and bottoming process, this chart had thrice made a pattern (marked in blue lines), within a specified time (roughly 7-9 months)

SYSTEM :
I do not know that within these 9 months, whether Nifty will first Go Up and Then Down OR it will straight away fall from here. So my Strategy for next 9 months will be to keenly observe my Daily Market Direction Tool along with my Trading system.
I do not know that within these 9 months, whether Nifty will first Go Up and Then Down OR it will straight away fall from here. So my Strategy for next 9 months will be to keenly observe my Daily Market Direction Tool along with my Trading system.
If the Medium term Tool and System goes Bullish - I will Only Play Intraday Longs
BUT if the Medium term Tool and System goes Bearish - I will Play BOTH Intraday and Positional SHORTS
BUT if the Medium term Tool and System goes Bearish - I will Play BOTH Intraday and Positional SHORTS
Hope This will Help
Sorry, i failed to mention the RSI divergence
Loading suggestions...