

Learn To Draw
Support, Resistance, Trendline.
A Thread 🧵
Retweet for max reach🔁 (1/17)
Tags:
#StockMarketindia #trading @sunilgurjar01 @itsprekshaBaid @chartmojo #investing #BREAKOUTSTOCKS
Support, Resistance, Trendline.
A Thread 🧵
Retweet for max reach🔁 (1/17)
Tags:
#StockMarketindia #trading @sunilgurjar01 @itsprekshaBaid @chartmojo #investing #BREAKOUTSTOCKS
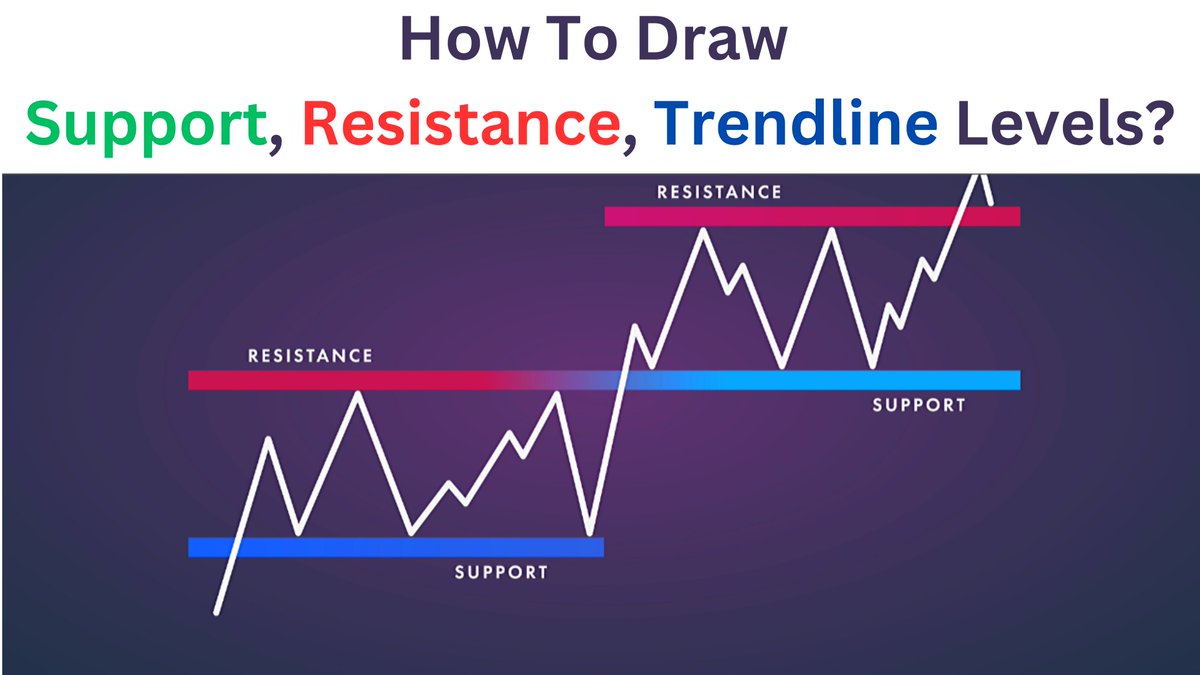
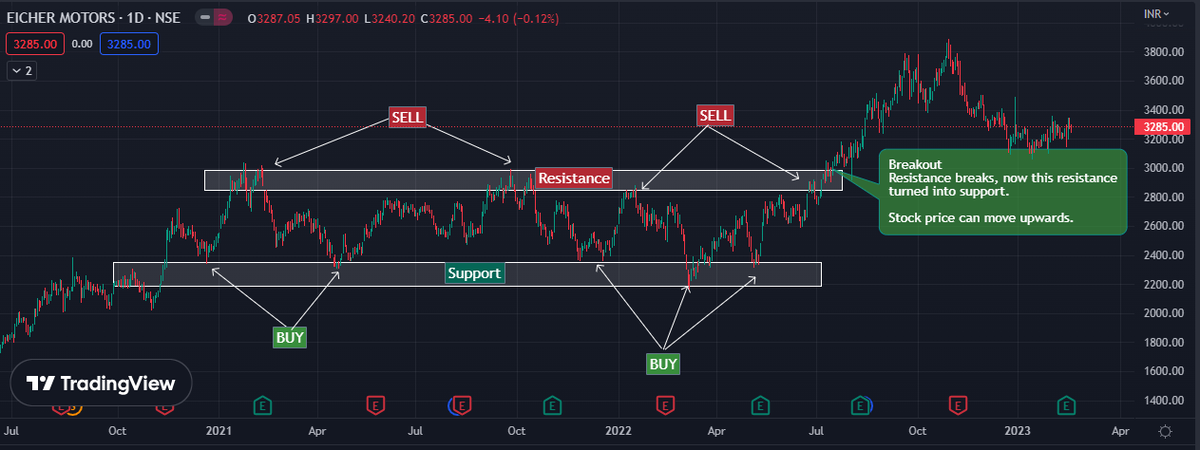
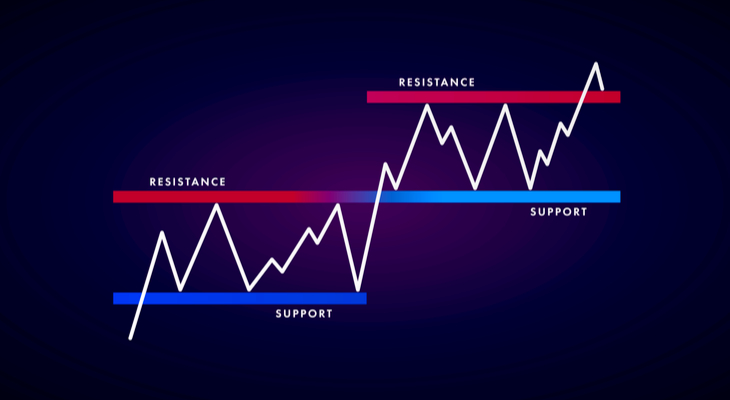
✅Support is an area for price, where downtrend halts due to demand of the stock at that price.
✅Resistance is an area for price, where uptrend halts due to Supply of the stock at that price. (2/17)
✅Resistance is an area for price, where uptrend halts due to Supply of the stock at that price. (2/17)
✅Technical analysts use support and resistance levels to identify price points on a chart where the probabilities favor a pause or reversal of a prevailing trend. (3/17)
✅How to Draw Support and resistance?
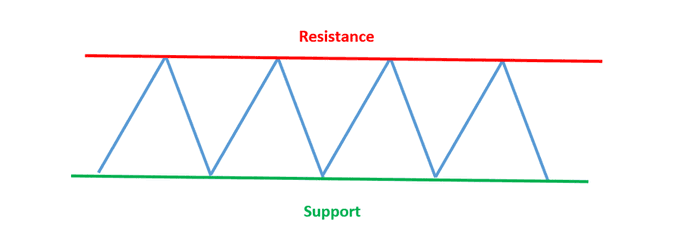
You can use any time frame for drawing S/R and it works on all time frames.
Whenever the price reverse from an area for more than 2 times that area can be called as S/R.
You can use Line Tool or Rectangle tool to plot this on charts.(4/17)
You can use any time frame for drawing S/R and it works on all time frames.
Whenever the price reverse from an area for more than 2 times that area can be called as S/R.
You can use Line Tool or Rectangle tool to plot this on charts.(4/17)
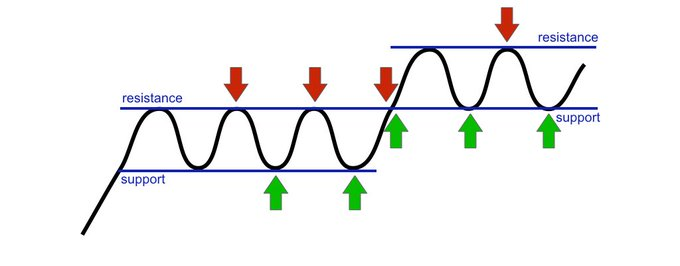
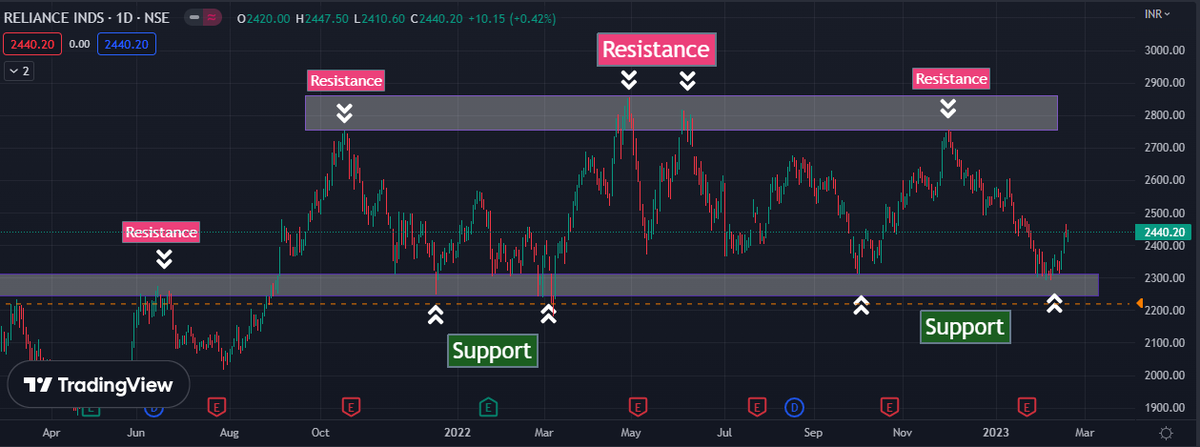
✅Once an "area" or “zone” of support or resistance has been identified, those price levels can serve as potential entry or exit points.(5/17)
✅As price reaches a point of previous support or resistance, it will do one of two things: bounce back away from the support or resistance level or violate the price level and continue in its prior direction until it hits the next support or resistance level. (6/17)
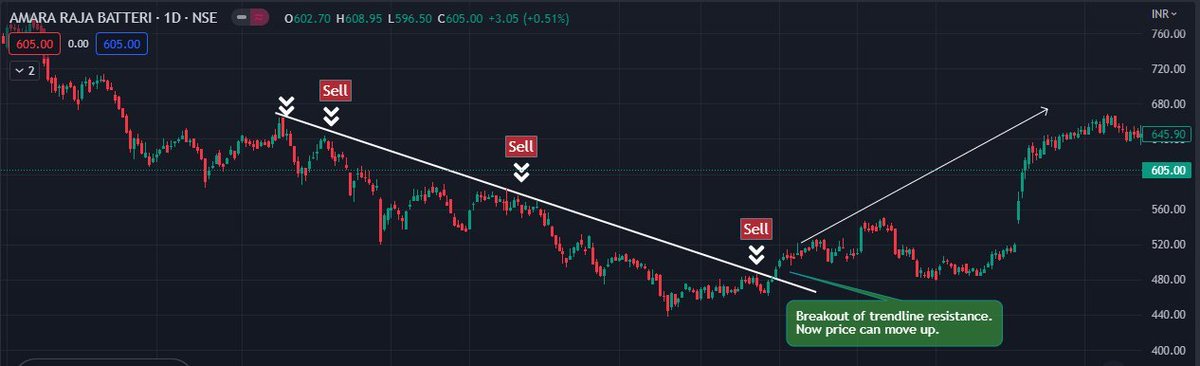
✅Reversal of Polarity.
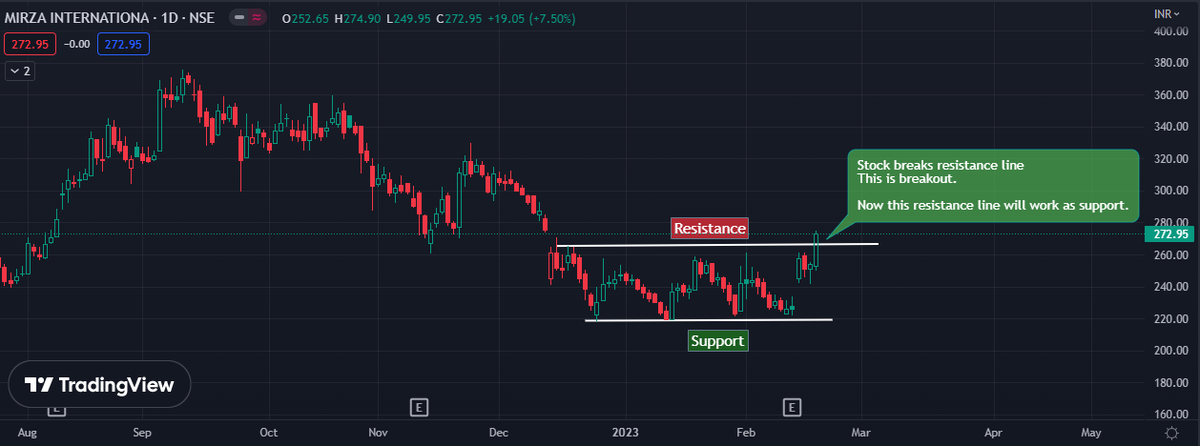
Whenever Resistance Breaks, it tends to act as support and whenever support breaks it tends to act as resistance. (7/17)
Whenever Resistance Breaks, it tends to act as support and whenever support breaks it tends to act as resistance. (7/17)
What is Breakout/ Breakdown?
✅Whenever Resistance Breaks, it is known as BREAKOUT.
✅Whenever Support Breaks, it is known as BREAKDOWN. (8/17)
✅Whenever Resistance Breaks, it is known as BREAKOUT.
✅Whenever Support Breaks, it is known as BREAKDOWN. (8/17)
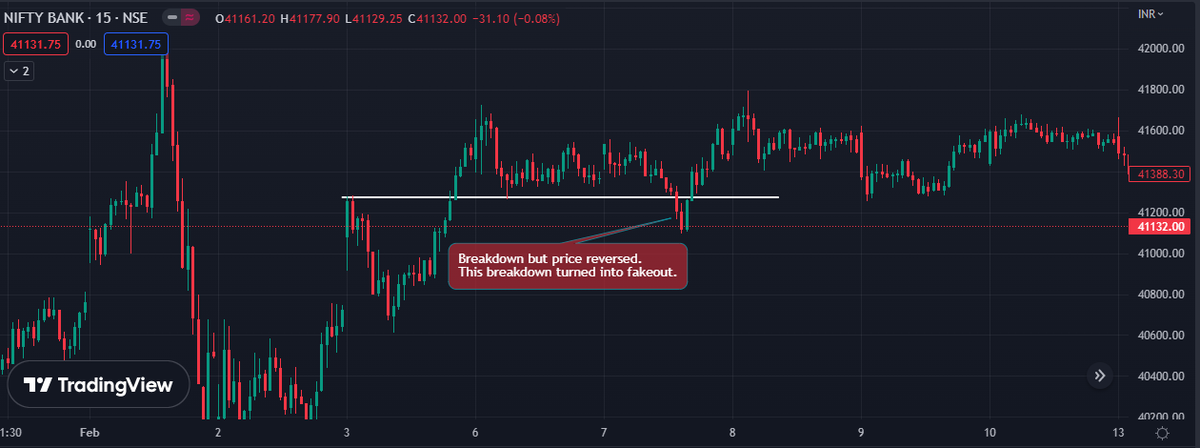
✅Fakeouts:
Sometimes the Support Will also break and, Resistance will not Act support.
You cannot be correct 10/10
These Scenarios can't be avoided by anyone.
We can just try to improve our analysis with the experience. (9/17)
Sometimes the Support Will also break and, Resistance will not Act support.
You cannot be correct 10/10
These Scenarios can't be avoided by anyone.
We can just try to improve our analysis with the experience. (9/17)
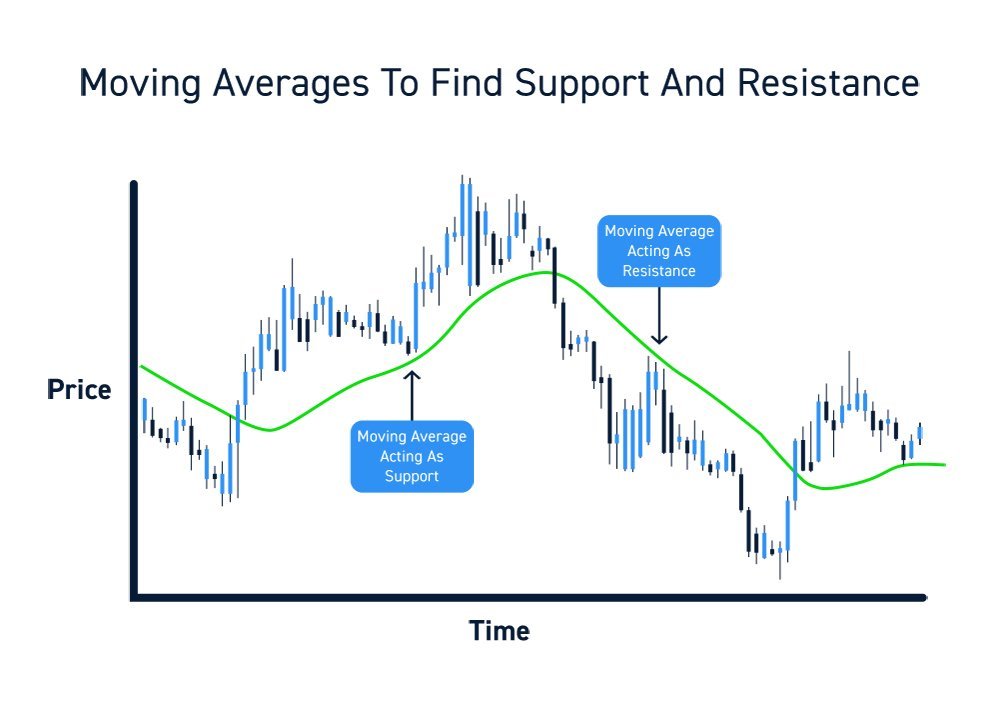
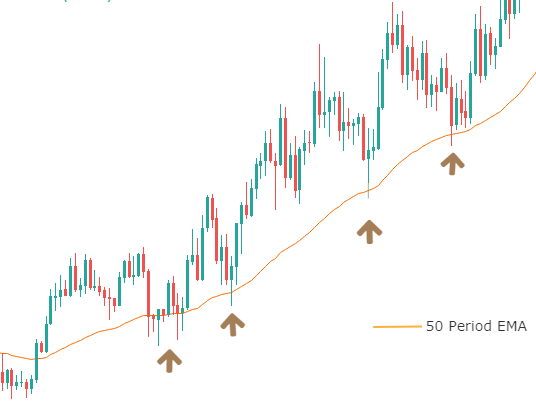
✅Support and resistance areas can also be identified on charts using trendlines and moving averages. (10/17)
✅Market psychology plays a major role as traders and investors remember the past and react to changing conditions to anticipate future market movement. (11/17)
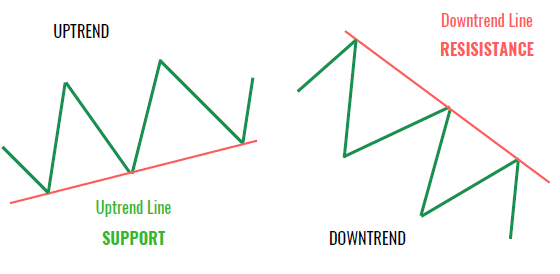
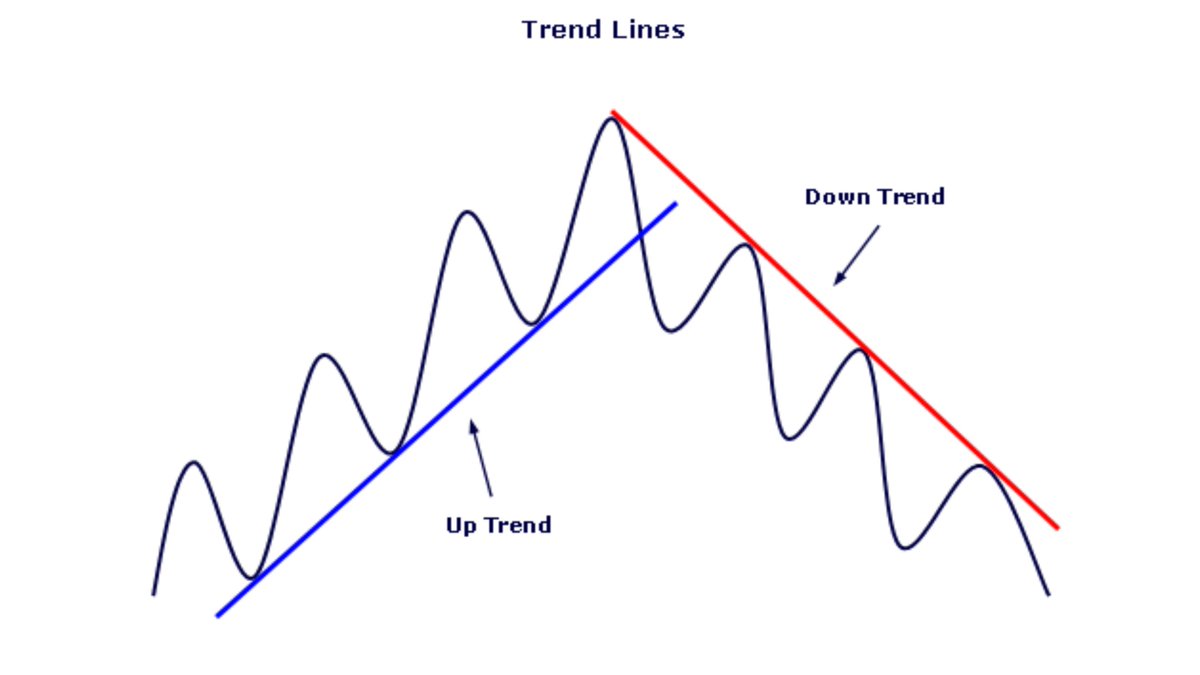
✅Trendline Support and Resistance Levels?
Trendline support and resistance levels are not drawn by horizontal lines, but by trendlines which can be upward sloping, or downward sloping can used to identify uptrends and downtrends in trending market. (12/17)
Trendline support and resistance levels are not drawn by horizontal lines, but by trendlines which can be upward sloping, or downward sloping can used to identify uptrends and downtrends in trending market. (12/17)
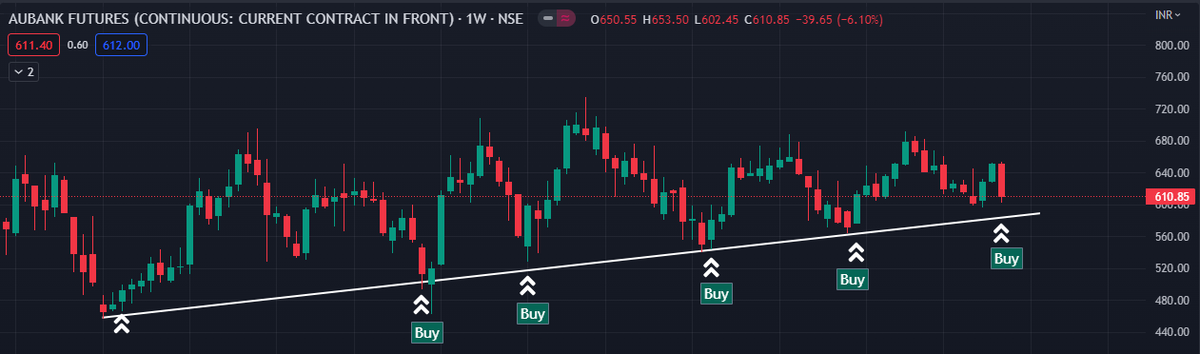
✅To draw a trend line in an uptrend, two lows must be connected by a straight line.
✅To draw a trend line in a downtrend line, two highs must be connected by a straight line.
✅A trend line should be connected by at least three highs or lows to make it valid. (13/17)
✅To draw a trend line in a downtrend line, two highs must be connected by a straight line.
✅A trend line should be connected by at least three highs or lows to make it valid. (13/17)
✅Each time the price approaches towards a trendline, there is a high chance that the price will bounce off the trendline. (14/17)
✅The more buying and selling that has occurred at a particular price level, the stronger the support or resistance level is likely to be. This is because traders and investors remember these price levels and are apt to use them again. (15/17)
✅Support and resistance zones seen in longer time frame charts such as weekly or monthly charts are often more significant than those seen in shorter time frame charts such as the one-minute or five-minute chart. (16/17)
♥ If you found this thread useful then Like & Retweet the first tweet.🔁 (17/17)
Loading suggestions...