

A super thread🧵 on "Different type of Chart Patterns"
In the stock market, chart patterns are graphical representations of historical price movements that can help traders identify potential buying/selling opportunities. Here are some common chart patterns that traders use
1/n
In the stock market, chart patterns are graphical representations of historical price movements that can help traders identify potential buying/selling opportunities. Here are some common chart patterns that traders use
1/n


1. Head and Shoulders: The head and shoulders pattern is a technical analysis chart pattern that signals a potential trend reversal from bullish to bearish. It consists of three peaks, with the middle peak being the highest (the head) and the two side peaks being lower
2/n
2/n

(the shoulders). The pattern is formed when the price of an asset rises to a peak, declines, rises again to a higher peak (the head), and then declines again, and finally rises once more to a peak that is similar to the left shoulder (the right shoulder).
3/n
3/n

The key characteristic of the head and shoulders pattern is the "neckline," which is formed by connecting the lowest points of the two troughs that form the left and right shoulders. This neckline is an important level of support that, when broken, confirms the pattern and
4/n
4/n
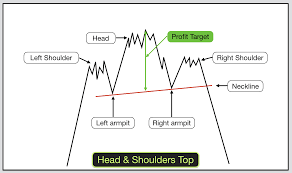
signals a potential reversal of the bullish trend.
2. Cup and Handle: The cup and handle pattern is a bullish chart pattern in technical analysis that signals a potential continuation of a bullish trend. It is formed by a rounded bottom (the "cup") followed by a short
5/n
2. Cup and Handle: The cup and handle pattern is a bullish chart pattern in technical analysis that signals a potential continuation of a bullish trend. It is formed by a rounded bottom (the "cup") followed by a short
5/n
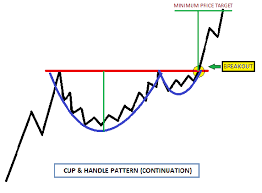
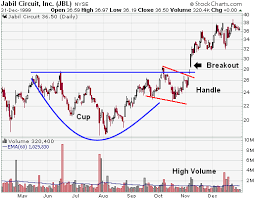
period of consolidation (the "handle"). Traders can use the pattern to enter long positions when the stock price breaks out above the handle's resistance level, with a price target set at the distance between the bottom of the cup and the resistance level projected upward
6/n
6/n
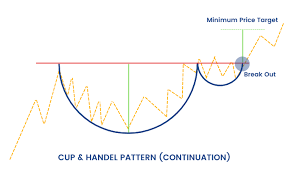
from the point of breakout.
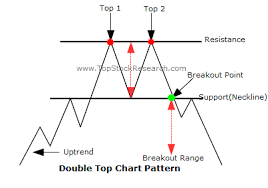
3. Double Top & Double Bottom : The Double Top and Double Bottom patterns are chart patterns in technical analysis that can signal potential trend reversals.
The Double Top pattern is formed when an asset reaches a high price, then falls, rises
7/n
3. Double Top & Double Bottom : The Double Top and Double Bottom patterns are chart patterns in technical analysis that can signal potential trend reversals.
The Double Top pattern is formed when an asset reaches a high price, then falls, rises
7/n
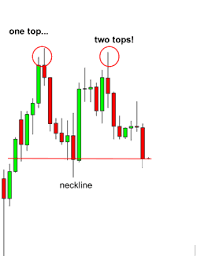
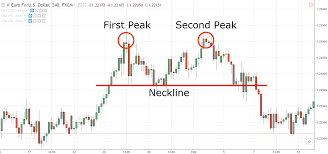
back up to the previous high, and then falls again. This creates a pattern that looks like two tops, or peaks, at approximately the same level. This pattern signals that the asset may be approaching a potential trend reversal from bullish to bearish, and traders may
8/n
8/n
consider selling their positions.
The Double Bottom pattern, on the other hand, is formed when an asset reaches a low price, then rises, falls back down to the previous low, and then rises again. This creates a pattern that looks like two bottoms, or troughs, at
9/n
The Double Bottom pattern, on the other hand, is formed when an asset reaches a low price, then rises, falls back down to the previous low, and then rises again. This creates a pattern that looks like two bottoms, or troughs, at
9/n
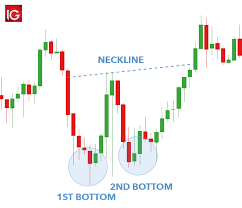
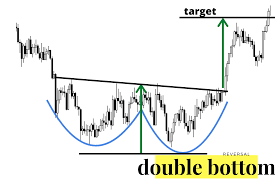
approximately the same level. This pattern signals that the asset may be approaching a potential trend reversal from bearish to bullish, and traders may consider buying the asset.
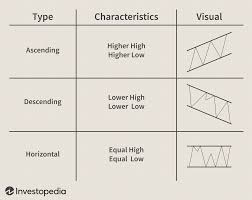
4. Ascending and Descending Triangles: Ascending and descending triangles are chart patterns
10/n
4. Ascending and Descending Triangles: Ascending and descending triangles are chart patterns
10/n
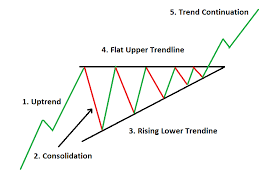
in technical analysis that can signal potential trend continuations or reversals.
The ascending triangle pattern is formed when an asset's price rises to a resistance level and then consolidates, creating a series of higher lows. The pattern is completed when the price
11/n
The ascending triangle pattern is formed when an asset's price rises to a resistance level and then consolidates, creating a series of higher lows. The pattern is completed when the price
11/n
breaks through the resistance level, indicating a potential continuation of the bullish trend.
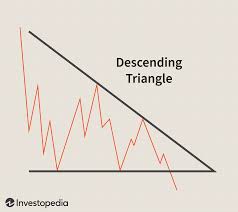
The descending triangle pattern is formed when an asset's price falls to a support level and then consolidates, creating a series of lower highs.
12/n
The descending triangle pattern is formed when an asset's price falls to a support level and then consolidates, creating a series of lower highs.
12/n
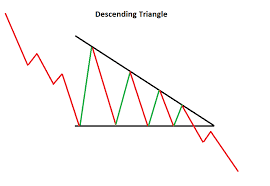
The pattern is completed when the price breaks through the support level, indicating a potential continuation of the bearish trend.
Traders can use these patterns to enter positions when the price breaks through the resistance or support level, respectively,
13/n
Traders can use these patterns to enter positions when the price breaks through the resistance or support level, respectively,
13/n
with a price target set based on the height of the pattern projected in the direction of the breakout.
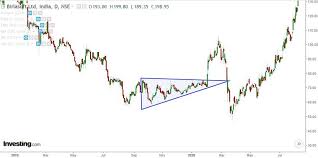
5. Wedges : The wedge pattern is a chart pattern in technical analysis that signals a potential trend reversal or continuation. It is formed by two trend lines that
14/n
5. Wedges : The wedge pattern is a chart pattern in technical analysis that signals a potential trend reversal or continuation. It is formed by two trend lines that
14/n
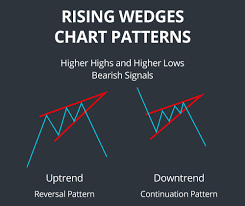
converge toward each other, creating a pattern that looks like a triangle or wedge.
There are two types of wedge patterns: the falling wedge and the rising wedge. The falling wedge is formed by a downward sloping trend line for the price lows and a flatter trend line for
15/n
There are two types of wedge patterns: the falling wedge and the rising wedge. The falling wedge is formed by a downward sloping trend line for the price lows and a flatter trend line for
15/n
the price highs. The rising wedge is formed by an upward sloping trend line for the price highs and a flatter trend line for the price lows.
A falling wedge pattern can signal a potential trend reversal from bearish to bullish, while a rising wedge pattern can signal
16/n
A falling wedge pattern can signal a potential trend reversal from bearish to bullish, while a rising wedge pattern can signal
16/n
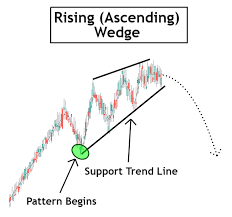
a potential trend reversal from bullish to bearish. Traders may enter positions based on a breakout from the wedge pattern, with a price target set based on the height of the wedge projected in the direction of the breakout.
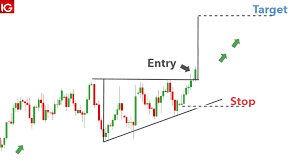
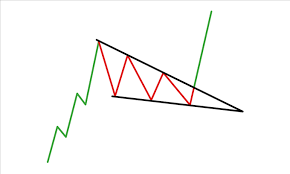
6. Flags and Pennants:
17/n
6. Flags and Pennants:
17/n
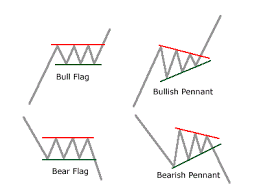
Flags and pennants are short-term continuation patterns that form when the stock price takes a brief pause before continuing in the same direction. They are formed by a short period of consolidation, following a sharp price move in either direction.
18/n
18/n
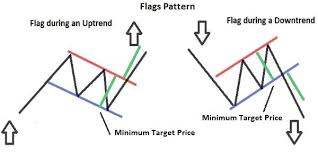
The flag pattern is characterized by a rectangular pattern that slopes against the preceding trend, while the pennant pattern is characterized by a triangle pattern that converges toward the preceding trend.
19/n
19/n
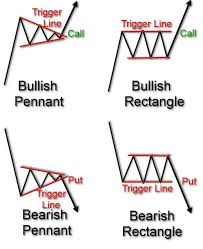
Flags and pennants are often seen as continuation patterns, meaning that the price is likely to continue in the same direction as the preceding trend after the pattern resolves. Traders can use these patterns to enter positions when the price breaks out from the
20/n
20/n
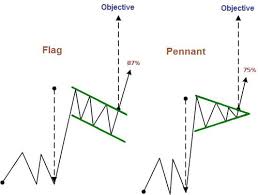
consolidation phase, with a price target set based on the height of the flag or pennant pole projected in the direction of the breakout.
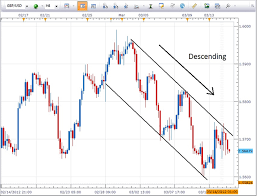
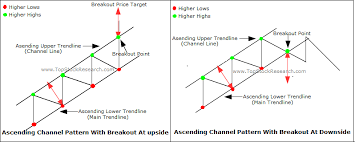
7. Channels: The channel pattern is a chart pattern in technical analysis that shows the price movements of an asset within two parallel
21/n
7. Channels: The channel pattern is a chart pattern in technical analysis that shows the price movements of an asset within two parallel
21/n
trend lines. The upper trend line connects the asset's price highs, while the lower trend line connects the asset's price lows.
A channel pattern can be either a bullish or bearish trend, depending on whether the price is trending upward or downward within the channel.
22/n
A channel pattern can be either a bullish or bearish trend, depending on whether the price is trending upward or downward within the channel.
22/n
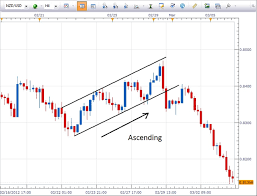
The pattern can signal a potential trend continuation if the price continues to bounce between the two trend lines, or a potential trend reversal if the price breaks out of the channel.
Traders can use channel patterns to enter positions when the price bounces off either
23/n
Traders can use channel patterns to enter positions when the price bounces off either
23/n
the upper or lower trend line, with a price target set based on the height of the channel projected in the direction of the breakout.
As with any trading strategy, there are no guarantees of success, and traders should manage risk carefully when using these patterns.
24/n
As with any trading strategy, there are no guarantees of success, and traders should manage risk carefully when using these patterns.
24/n
Additionally, it's important to use the pattern in conjunction with other forms of analysis, such as technical indicators and fundamental analysis.
Do follow @ArjunB9591 for more informative threads and knowledge
Do like share and retweet
Thankyou for reading 📚 💖 ❤️
25/n
Do follow @ArjunB9591 for more informative threads and knowledge
Do like share and retweet
Thankyou for reading 📚 💖 ❤️
25/n
Loading suggestions...