

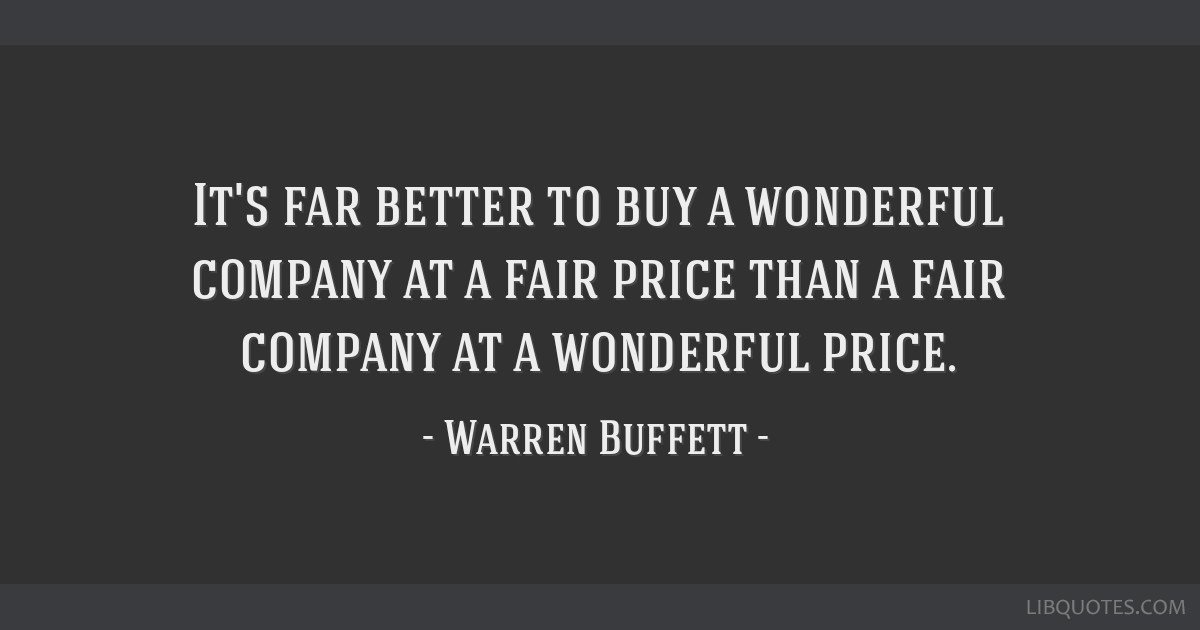
Price is what you pay. Value is what you get.
But how can you determine a company is undervalued?
Here's everything you need to know about valuation:
But how can you determine a company is undervalued?
Here's everything you need to know about valuation:
While in the long run stock prices always follow the evolution of the intrinsic value of a company, in the short term stock prices are mainly driven by fluctuations in valuation.
As a result, you can end up with horrible investment results if you pay too much for a company.
As a result, you can end up with horrible investment results if you pay too much for a company.
1️⃣ How to think about valuation
The essence of every intelligent form of investing is to buy stocks for less than what they’re worth.
The valuation of a company shows you how much the market is willing to pay for a certain stock.
The essence of every intelligent form of investing is to buy stocks for less than what they’re worth.
The valuation of a company shows you how much the market is willing to pay for a certain stock.
There are many different methods to look at a company’s valuation.
The most used valuation metric is the price-earnings ratio (P/E) ratio. You can calculate it as follows:
Price-earnings ratio= stock price / earnings per share
The most used valuation metric is the price-earnings ratio (P/E) ratio. You can calculate it as follows:
Price-earnings ratio= stock price / earnings per share
Let’s take S&P Global (a wide moat stock) as an example.
S&P Global currently trades at a stock price of $360 while its earnings per share for 2023 are expected to be equal to $11.07. As a result, S&P Global’s P/E is equal to 32.5.
S&P Global currently trades at a stock price of $360 while its earnings per share for 2023 are expected to be equal to $11.07. As a result, S&P Global’s P/E is equal to 32.5.
The lower the P/E ratio, the cheaper the stock.
When you divide the earnings per share of a company by its stock price, you get the earnings yield:
Earnings yield = earnings per share / stock price
When you divide the earnings per share of a company by its stock price, you get the earnings yield:
Earnings yield = earnings per share / stock price
S&P Global’s earnings yield is equal to 3.1% ($11.07/$360).
This means that when you would buy S&P Global for $10.000 today, the company would generate $310 (3.1%) in earnings for you next year.
This means that when you would buy S&P Global for $10.000 today, the company would generate $310 (3.1%) in earnings for you next year.
Here are some other valuation metrics you can use:
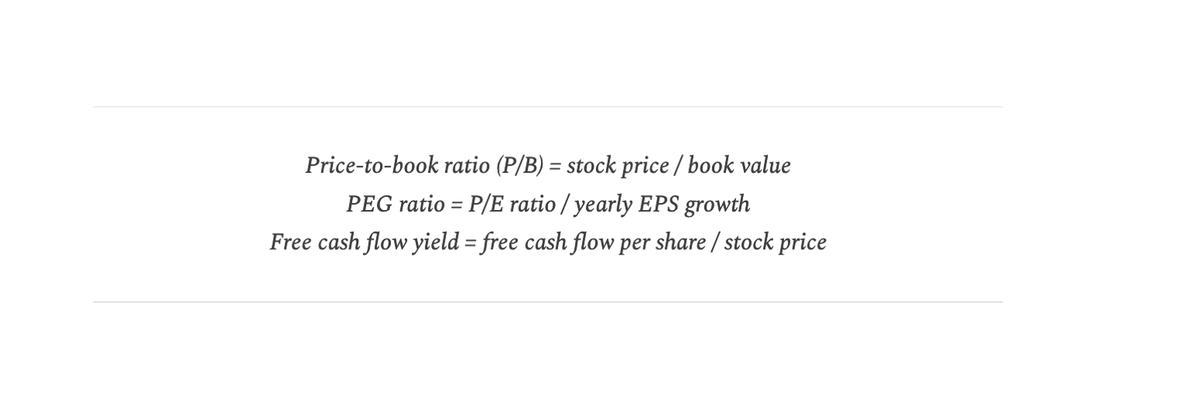
Personally, we prefer the free cash flow yield as free cash flow is more robust than earnings.
2️⃣ Always buy stocks at a discount
When you go to the mall, you like to buy your favorite products on sale.
When you go to the mall, you like to buy your favorite products on sale.
Are you able to buy the toothpaste you always use at a 30% discount? Or is there a special action on your favorite beer? That’s lovely. Let’s buy some extra toothpaste and beer.
The same goes for stocks. You want to buy a stock at its cheapest possible price and valuation.
The same goes for stocks. You want to buy a stock at its cheapest possible price and valuation.
The beautiful thing about the stock market is that Mr. Market often acts as a Manic-Depressive. You can use this volatility to your advantage.
For almost all stocks, the difference between the lowest and highest stock price in a certain year is larger than 50%.
For almost all stocks, the difference between the lowest and highest stock price in a certain year is larger than 50%.
You don’t believe me?
Let’s take S&P Global as an example again. The lowest stock price of the past 52 weeks was equal to $279 while the highest stock price over the same period was equal to $450. A difference of 61%.
Let’s take S&P Global as an example again. The lowest stock price of the past 52 weeks was equal to $279 while the highest stock price over the same period was equal to $450. A difference of 61%.
3️⃣ Short term 🆚 long term
Over a one-year period, most stock price fluctuations are driven by changes in valuation.
However, in the long run stock prices are driven by the evolution of the intrinsic value of a company.
Over a one-year period, most stock price fluctuations are driven by changes in valuation.
However, in the long run stock prices are driven by the evolution of the intrinsic value of a company.
This means that in the short term the valuation you pay for a company is very important while in the long term the rate at which a company can grow its earnings per share is the crucial factor.
"If you bought the S&P 500 at a P/E of 5.3x in 1917, and sold it in 1999 at a P/E of 34x, your annual return would have been 11.6%. Only 2.3% p.a. came from the massive increase in P/E. The rest of your return came from the companies’ earnings and reinvestments." - Terry Smith
4️⃣ How growth became value, and value didn’t
You already learned that you want to buy stocks at cheap valuation levels.
However, just because something is cheap doesn’t make it good value.
You already learned that you want to buy stocks at cheap valuation levels.
However, just because something is cheap doesn’t make it good value.
In the stock market, it is never a good idea to buy a stock just because it looks cheap.
Let’s get back to 2010 and take 2 examples. In 2010, S&P Global was trading at a P/E of 19.3 while General Electric was trading at a P/E of 15.3.
Let’s get back to 2010 and take 2 examples. In 2010, S&P Global was trading at a P/E of 19.3 while General Electric was trading at a P/E of 15.3.
Purely based on this information, you would say that General Electric is the more interesting investment because the company is valued more attractively.
Well… things turned out quite differently...
Well… things turned out quite differently...
Since 2010 S&P Global’s stock price increased with more than 2100% while General Electric’s stock only increased with 100%.
The reason for this?
When looking at the valuation of a company, you should always take other factors into account.Think about the Return On Invested Capital (ROIC) for example.
When looking at the valuation of a company, you should always take other factors into account.Think about the Return On Invested Capital (ROIC) for example.
It can be justified to pay a higher multiple for a stock when the company is fundamentally healthier.
In our example, we notice that S&P Global is the better company by far.
From 2010 until today, S&P Global reported an average ROIC of 27.4% compared to only 2.2% for General Electric.
From 2010 until today, S&P Global reported an average ROIC of 27.4% compared to only 2.2% for General Electric.
Another CRUCIAL factor is how the company can grow its earnings per share in the future.
Why? Because the valuation of a stock will come down when the company is able to grow its earnings per share.
Why? Because the valuation of a stock will come down when the company is able to grow its earnings per share.
5️⃣ The importance of growth
Let’s say we have two companies: Dividend Inc. and Quality Inc. You buy both companies today and you’ll sell them in 10 years from now.
Let’s say we have two companies: Dividend Inc. and Quality Inc. You buy both companies today and you’ll sell them in 10 years from now.
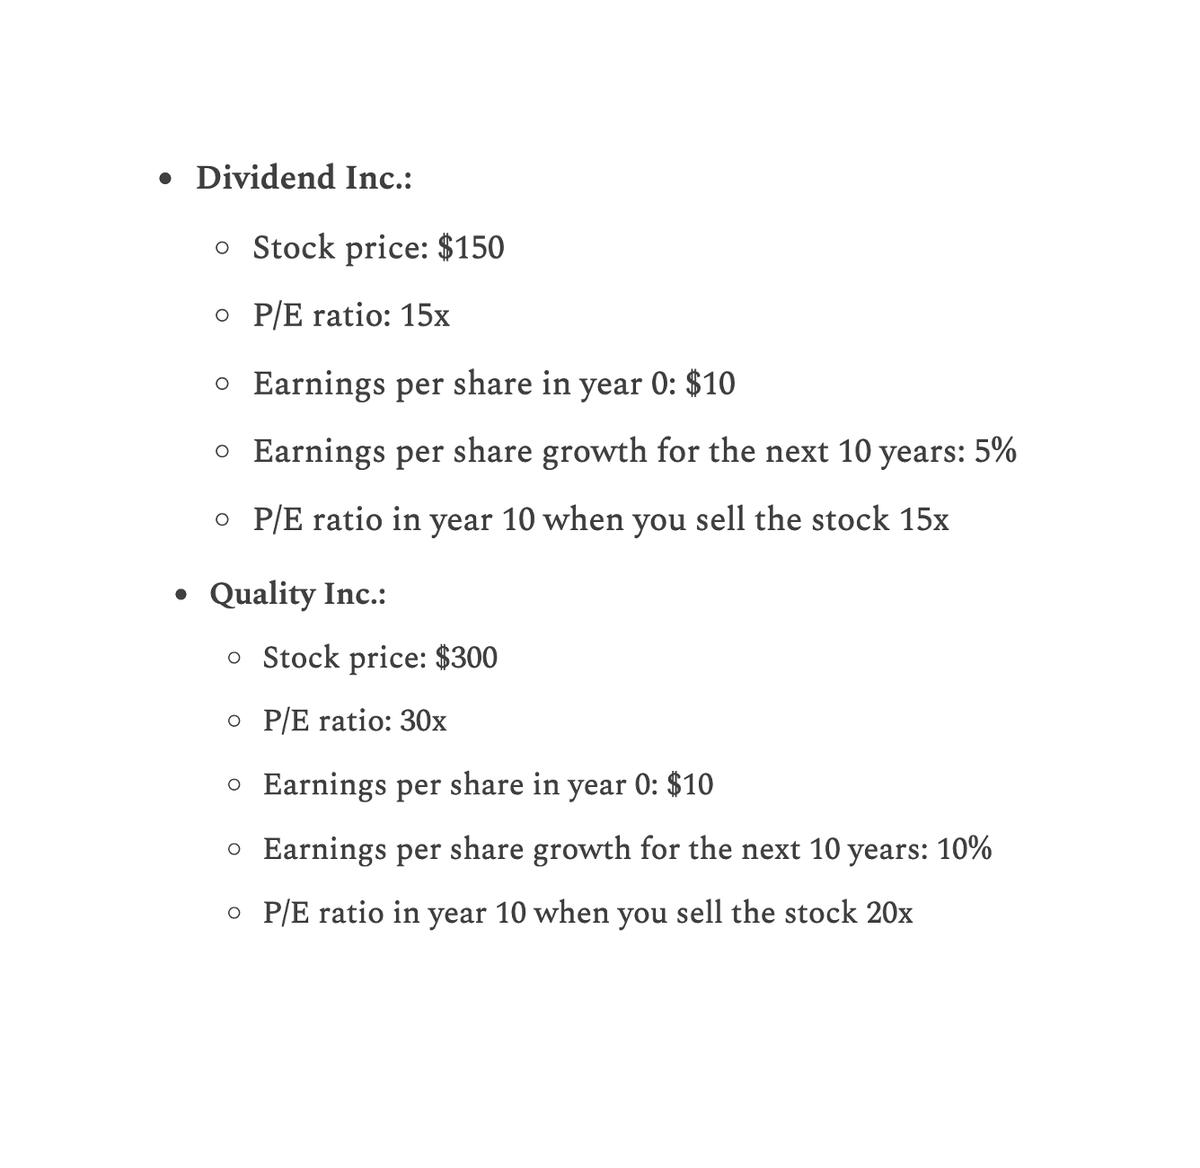
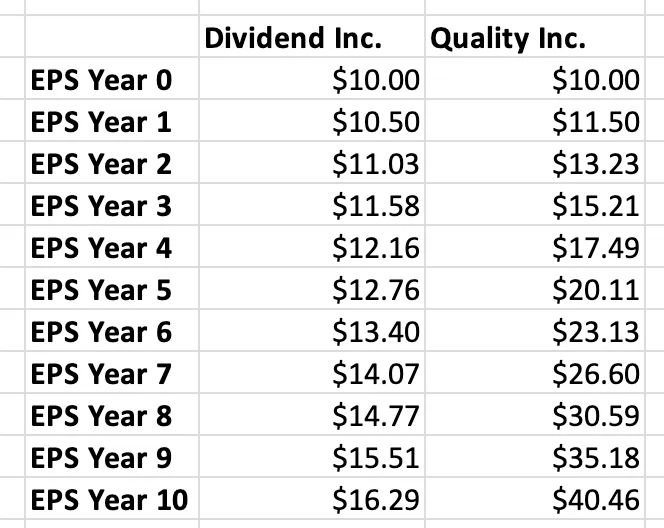
In this example, the evolution of the Earnings Per Share (EPS) of both companies will look as follows:
When you would sell Dividend Inc. in 10 years from now, the stock price will be equal to:
Stock price = Earnings per share in year 10 * P/E ratio in year 10
Stock price Dividend Inc. in year 10 = $16.29 * 15 = $244.35
Stock price = Earnings per share in year 10 * P/E ratio in year 10
Stock price Dividend Inc. in year 10 = $16.29 * 15 = $244.35
As a result, your return would be equal to:
Return = (selling price - initial price)/initial price
Return = ($244.35 - $150) / $150 = 62.9%
Return = (selling price - initial price)/initial price
Return = ($244.35 - $150) / $150 = 62.9%
An investment in Dividend Inc. would return you 62.9% over a period of 10 years, or a CAGR of 5% per year.
Please notice that the CAGR of 5% is exactly equal to the earnings per share growth of Dividend Inc.
When the valuation of a company remains equal, your return as an investor will be equal to the earnings per share growth (plus the dividend yield - more on this later).
When the valuation of a company remains equal, your return as an investor will be equal to the earnings per share growth (plus the dividend yield - more on this later).
On the other hand, the situation of Quality Inc. looks as follows:
Stock price = Earnings per share in year 10 * P/E ratio in year 10
Stock price Quality Inc. in year 10 = $40.46 * 20 = $809.2
Stock price = Earnings per share in year 10 * P/E ratio in year 10
Stock price Quality Inc. in year 10 = $40.46 * 20 = $809.2
Return = (selling price - initial price)/initial price
Return = ($809.2 - $300) / $300 = 169.7%
An investment in Quality Inc would return you 169.7% over a 10-year period %. This is equal to a CAGR of 10.4%!
Return = ($809.2 - $300) / $300 = 169.7%
An investment in Quality Inc would return you 169.7% over a 10-year period %. This is equal to a CAGR of 10.4%!
This means that even when you paid a valuation twice as high for Quality Inc. compared to Dividend Inc, an investment in Quality Inc. would return you twice as much as one in Dividend Inc.!
And this all happened while Quality Inc.’s P/E ratio declined from 30x to 20x while the valuation of Dividend Inc. remained constant.
The key lesson? Cheap looking stocks can turn out to be very expensive while expensive looking stocks can turn out to be very cheap.
The key lesson? Cheap looking stocks can turn out to be very expensive while expensive looking stocks can turn out to be very cheap.
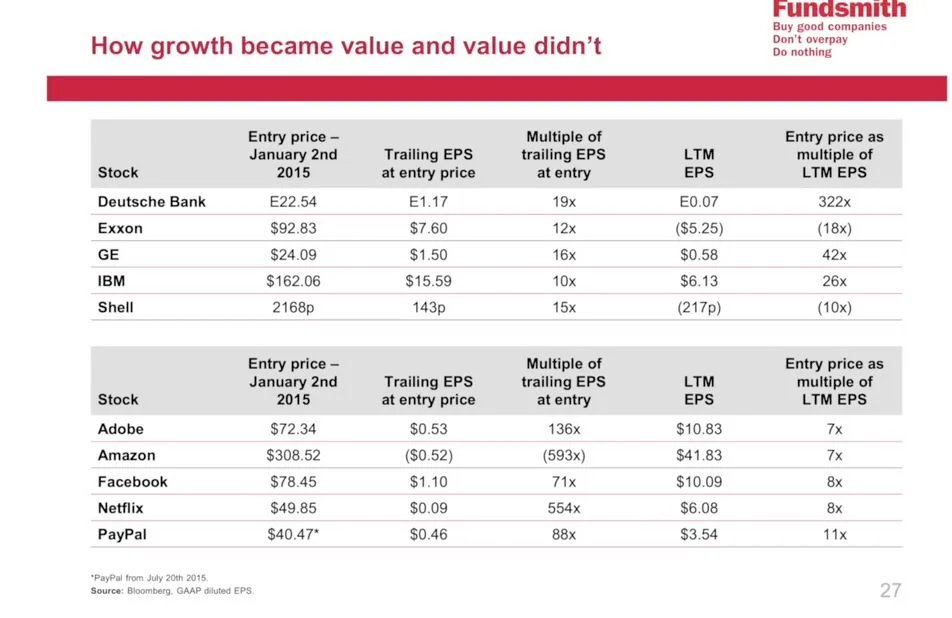
Not convinced yet? Here is another example of quality maestro Terry Smith:
6️⃣ Your expected return
The best investors are able to think on the long term.
Do you want to achieve this?
Print the formula below and take a look at it on a regular basis:
The best investors are able to think on the long term.
Do you want to achieve this?
Print the formula below and take a look at it on a regular basis:
Your expected yearly return = FCF per share growth + shareholder yield +/- multiple expansion (multiple contraction)
Shareholder yield= dividend yield + buyback yield
Shareholder yield= dividend yield + buyback yield
Let’s use S&P Global as an example again. We use the following assumptions:
▪️ FCF per share growth for the next 10 years: 10%
▪️Shareholder yield: 1.5%
▪️ S&P Global’s P/E to contract from 32.5 to 25 over the next 10 years
▪️ FCF per share growth for the next 10 years: 10%
▪️Shareholder yield: 1.5%
▪️ S&P Global’s P/E to contract from 32.5 to 25 over the next 10 years
In that case your return for the next 10 years will be equal to:
Yearly return = 10% + 1.5% - 2.3% = 9.2%
(Total multiple contraction of 23% over 10 years = 2.3% per year)
Yearly return = 10% + 1.5% - 2.3% = 9.2%
(Total multiple contraction of 23% over 10 years = 2.3% per year)
Are you happy if you would generate a return of 9.2% per year?
In that case, you should consider investing in S&P Global. If not, you should look for most interesting opportunities.
In that case, you should consider investing in S&P Global. If not, you should look for most interesting opportunities.
7️⃣ Conclusion
▪️Pay a stock for less than what it's worth
▪️Just because something is cheap doesn’t make it good value
▪️Always take into account the ROIC and EPS growth when valuing a company
▪️Pay a stock for less than what it's worth
▪️Just because something is cheap doesn’t make it good value
▪️Always take into account the ROIC and EPS growth when valuing a company
If you liked this, you'll love our website.
▪️ Each Tuesday we share 5 investment insights
▪️ Each Thursday we publish a deeper investment article
Start your journey here:
qualitycompounding.substack.com
▪️ Each Tuesday we share 5 investment insights
▪️ Each Thursday we publish a deeper investment article
Start your journey here:
qualitycompounding.substack.com

Loading suggestions...