

I have observed many people using PE ratio for life insurance companies. If you are new to the industry, it is natural to be confused. However, look no further than the FY17 AR of ICICI PRU. It contains the definitions of various terms used in the insurance industry, and why

PE ratio might not be a good approach.
First, I want you to think about how a life insurance company works. We pay a premium every year, and we are assured a certain sum. The costs of acquiring a customer in a life insurance company don't get covered in the first year. Just
First, I want you to think about how a life insurance company works. We pay a premium every year, and we are assured a certain sum. The costs of acquiring a customer in a life insurance company don't get covered in the first year. Just
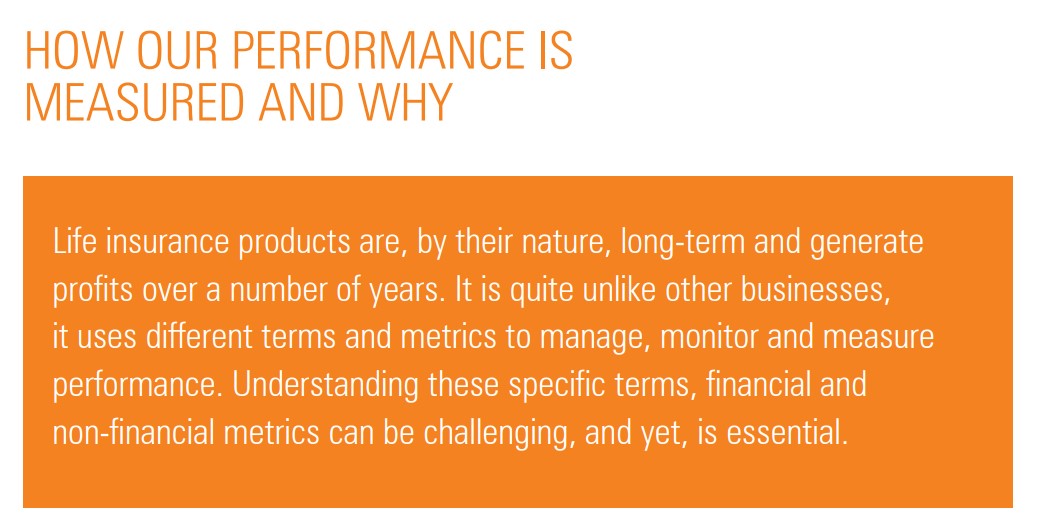
keep this idea in your mind for now. So, now comes the first definition i.e GWP. Now think about it: every year the business receives two kinds of premiums:
- People taking life insurance for the first time (new business premium)
- People who are paying for their 2nd, 3rd year.
- People taking life insurance for the first time (new business premium)
- People who are paying for their 2nd, 3rd year.
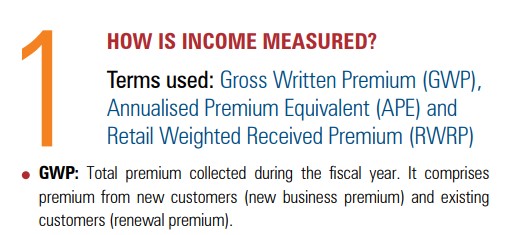
.. etc premiums (renewal premiums).
The sum of these two forms the gross written premium (received premium) for the year.
Second, comes the VNB margins. This might sound complicated, but remember that it's like the operating margins of a life insurance company. Like we do a
The sum of these two forms the gross written premium (received premium) for the year.
Second, comes the VNB margins. This might sound complicated, but remember that it's like the operating margins of a life insurance company. Like we do a
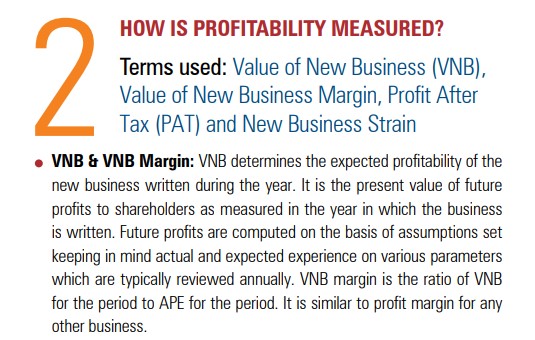
DCF, similarly we are trying to gauge the future profitability of the new premiums that year (value of new business/VNB) coming in. That's all you have to remember. Just like in manufacturing companies where product mix decides the EBITDA margins, in insurance cos as well product
mix decides the VNB margins. Persistency also forms a key role in the assumptions of future profitability. We will discuss the various types of products and the persistency ratio further.
If you have made it this far, kudos! Shows your learning spirit⚡️
If you have made it this far, kudos! Shows your learning spirit⚡️

Now comes the important part. Why shouldn't we use the PE ratio for valuing Life insurance companies? Here is the problem: Say it costs 1000rs to acquire a customer. Where does this show up on the PnL?
You guessed it right: the expenses. However, here's an accounting catch. The
You guessed it right: the expenses. However, here's an accounting catch. The
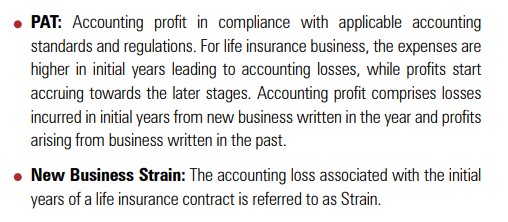
expenses are recorded fully, but the future premiums aren't (you know why). The insurance company makes a profit ONLY in the future when the future premiums start covering the costs. Thus, technically according to the accounting standards, it has to book an "accounting loss".

And now you understand, why PAT of these companies might not be a good idea to gauge their profitability, and that's exactly what the management has mentioned in the AR.
Now I want you to think again. How do we value companies where we have temporary losses/accounting issues?
Now I want you to think again. How do we value companies where we have temporary losses/accounting issues?
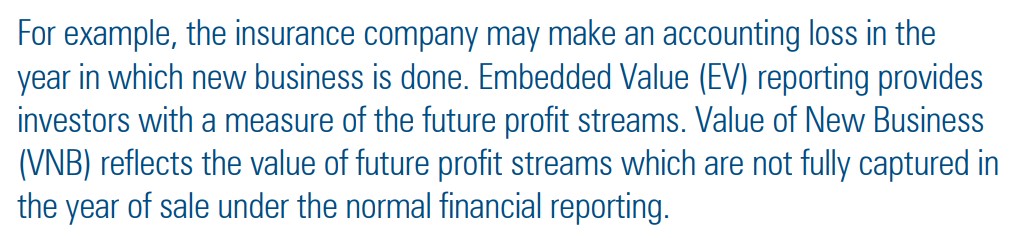
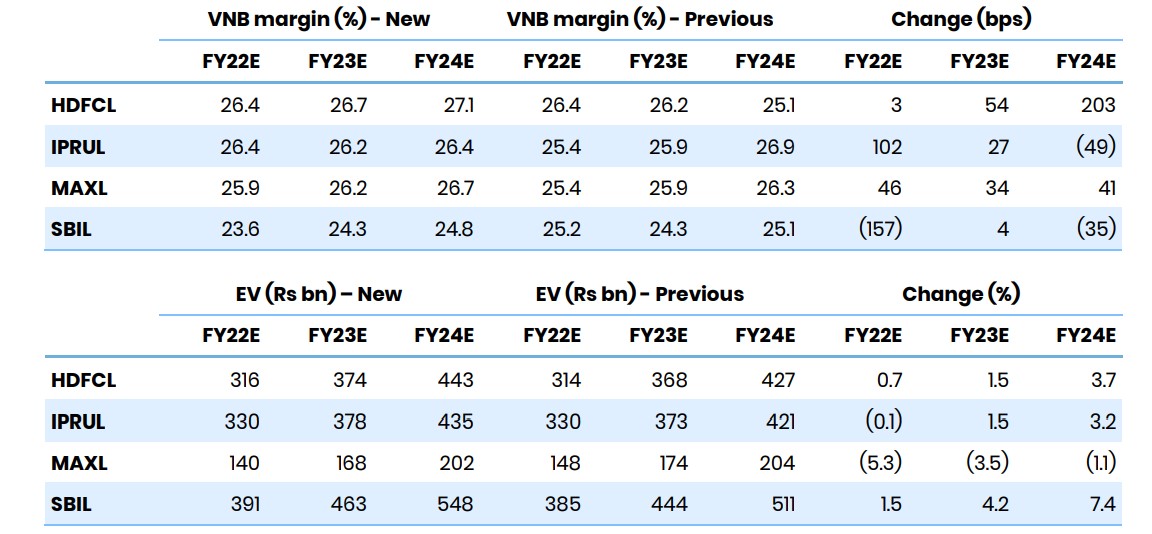
We use the book value. Remember how we use price/book for companies going through cyclical losses and temporary pain periods? Similarly, in the case of Life insurance cos, we use Embedded value (similar to book value). Embedded value (EV) takes into account the present net-worth
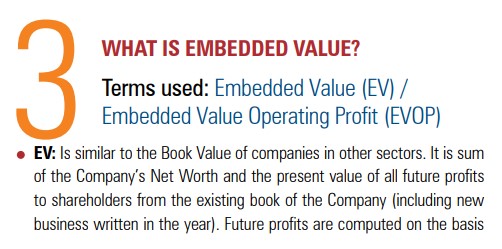
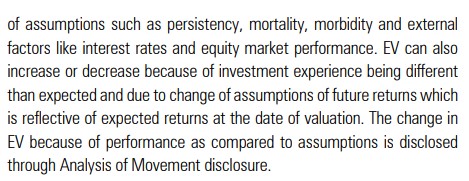
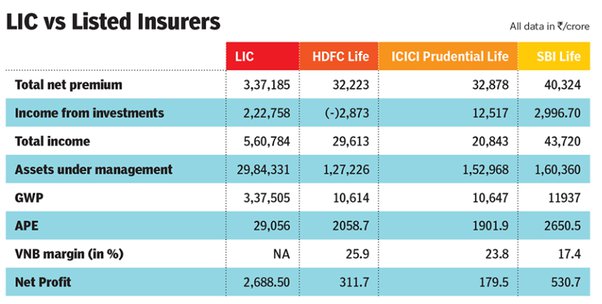
(Equity) and adds the estimated future profitability. This estimated profitability can depend on a lot of reasons, but we won't go into such depth. Observe the image below, a snippet from B&K securities with the value of EV and VNB margins for various cos (current and estimated).
Still here? Amazing job! The tough part is done, now comes the easy part.😁

Now that the accounting part is done, we will discuss some softer aspects, that move the needle of VNB margins and EV.
First comes the Persistency ratio. It measures the retention of a policyholder. The higher the persistency, the higher the chances of renewal premiums, leading
First comes the Persistency ratio. It measures the retention of a policyholder. The higher the persistency, the higher the chances of renewal premiums, leading
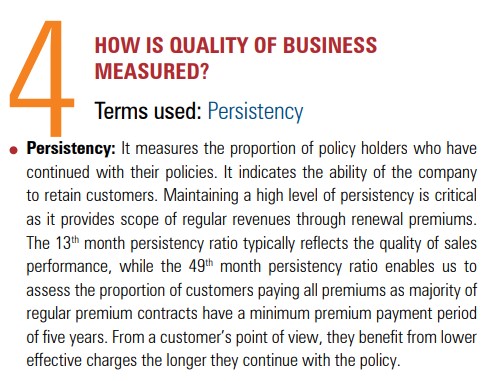
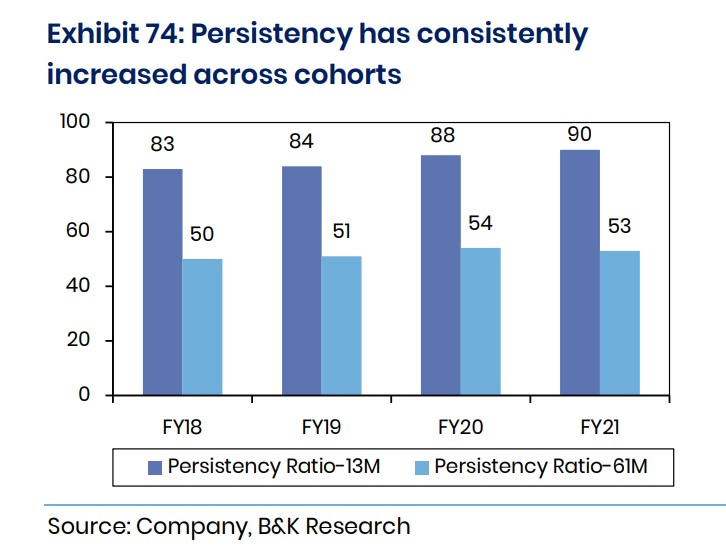
to better profitability estimates. For example, here's the persistency ratio from one of the best-run life insurance cos: HDFC life (no comments on valuations). 13M means 13 months. It's natural that as the time period increases, the persistency ratio drops as well.
Two more concepts to go: Solvency ratio and the product categories.
Solvency ratio: This is the minimum amount of capital that has to be maintained as a percentage of total capital, to tackle future contingencies. IRDAI recommends that every company should have 150% solvency.
Solvency ratio: This is the minimum amount of capital that has to be maintained as a percentage of total capital, to tackle future contingencies. IRDAI recommends that every company should have 150% solvency.
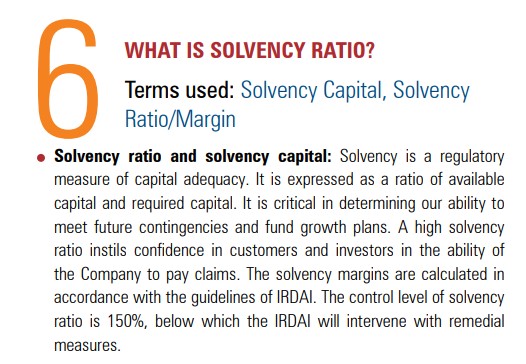
The solvency ratio of SBI Life, over the years.

Finally comes the different types of products. It is an important part as this decides the profitability of the firm.
There are two broad categories of insurance products:
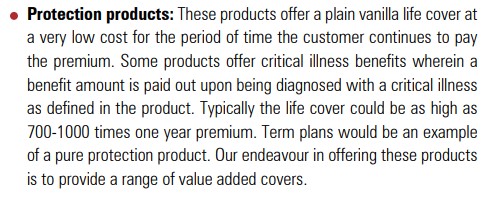
- Pure protection products
- Savings products
There are two broad categories of insurance products:
- Pure protection products
- Savings products

Pure protection: The life cover (sum assured) can be as high as 700-1000X of the one-year premium. This means that if a person pays a premium of 100 rs in any given year, the person gets a cover of nearly 70k-1L rs. This is the best product from the customer's perspective.
Savings products: They have very low coverage (10X of yearly premium) but since people like some returns on their premium as well, these are much stickier and thus the persistency ratio is very high for these products, leading to higher VNB margins.
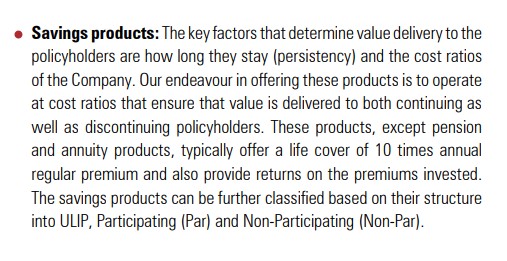
Savings products have three categories:
- ULIPs
- PAR
- NON-PAR
Almost all these products are similar with minor differences. ULIPs are linked to stock markets or fixed deposits, where the customer gets a cover and also a return on his premium invested. NON-PAR is a fixed
- ULIPs
- PAR
- NON-PAR
Almost all these products are similar with minor differences. ULIPs are linked to stock markets or fixed deposits, where the customer gets a cover and also a return on his premium invested. NON-PAR is a fixed
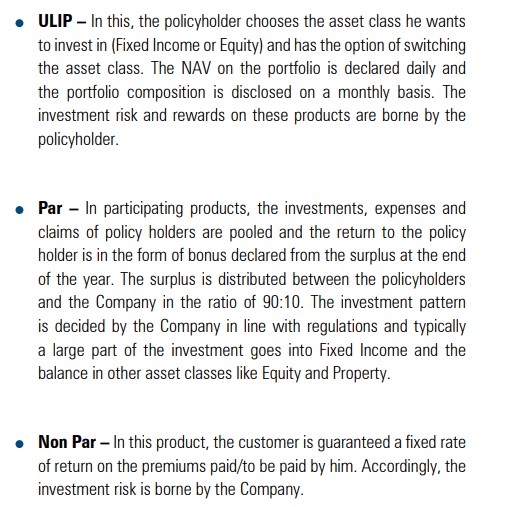
guarantee product. PAR products have given returns in the form of bonuses. All you have to remember is that these products carry higher VNB margins and have higher persistency ratios. All these products have group (corporates) or individual products.
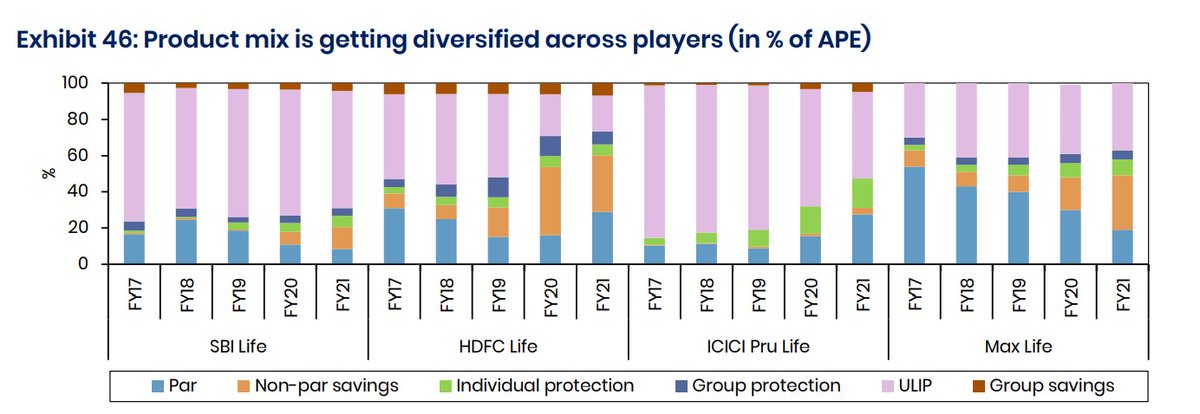
For eg. in the image above observe how HDFClife has good exposure to savings products (NON-PAR, ULIPs) due to which it commands higher VNB margins.
This write-up should serve as a good starting point for us to understand Life insurance cos. better. I highly recommend that
This write-up should serve as a good starting point for us to understand Life insurance cos. better. I highly recommend that
you get into the AR yourself, after going through this write-up. Thank you for reading. I also write on my LinkedIn:
linkedin.com
linkedin.com
Please like and RT the first tweet, if you found this useful:
Loading suggestions...