

The New Week in Charts video is up.
Topics include:
-Spike in credit card debt
-Millennials have highest delinquency rates
-Mortgage application collapse
-Rising bond yields
-60/40 drawdowns
-Why many investors are still fearful
-And more...
youtu.be
Topics include:
-Spike in credit card debt
-Millennials have highest delinquency rates
-Mortgage application collapse
-Rising bond yields
-60/40 drawdowns
-Why many investors are still fearful
-And more...
youtu.be
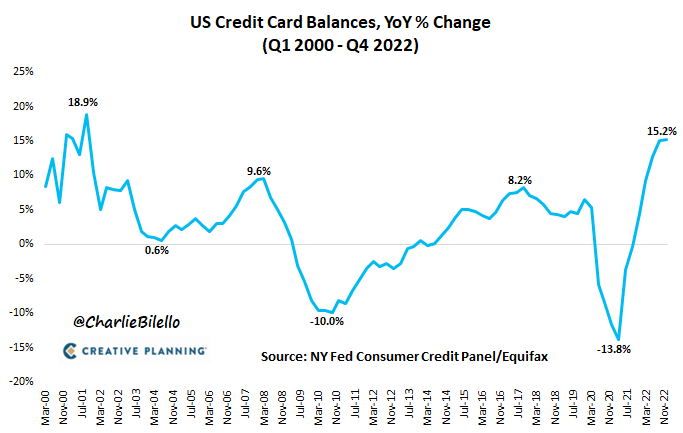
(1) Spike in Credit Card Debt
Credit card balances in the US increased 15.2% over the last year, the biggest YoY jump since the 2001 recession.
Video: youtube.com
Credit card balances in the US increased 15.2% over the last year, the biggest YoY jump since the 2001 recession.
Video: youtube.com
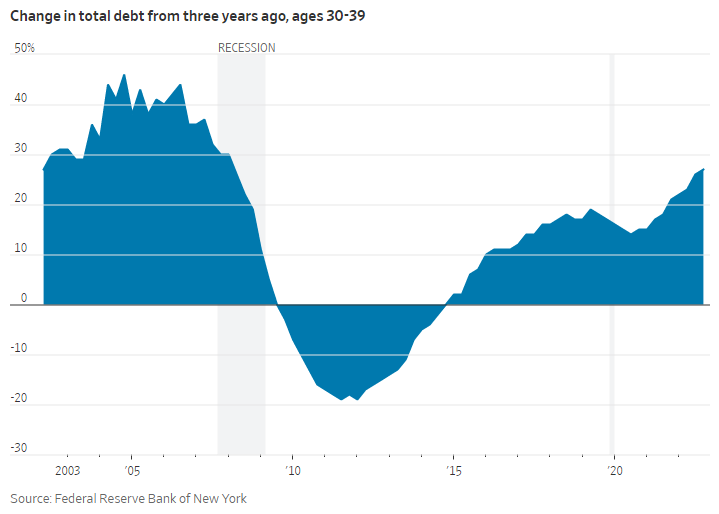
(2) The Millennial Malady
Total debt balances for Millennials hit more than $3.8 trillion in the fourth quarter of 2022, a 27% increase from late 2019. That’s largest increase for any age group.
Video: youtube.com
Total debt balances for Millennials hit more than $3.8 trillion in the fourth quarter of 2022, a 27% increase from late 2019. That’s largest increase for any age group.
Video: youtube.com
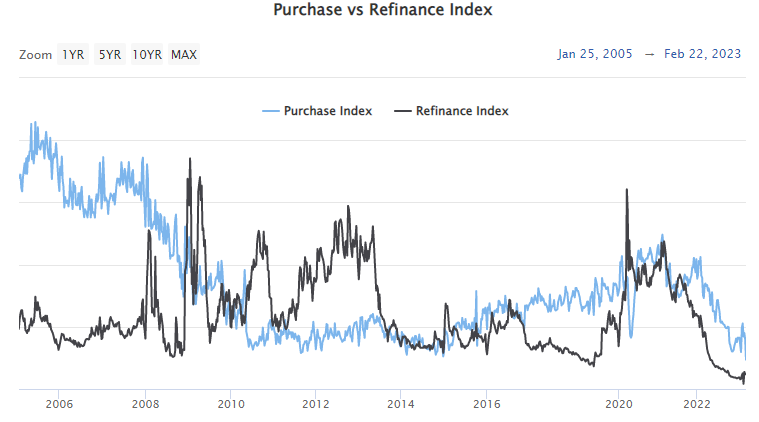
(3) The Mortgage Application Collapse
Mortgage purchase applications in the US are at their lowest level since 1995...
Video: youtube.com
Mortgage purchase applications in the US are at their lowest level since 1995...
Video: youtube.com
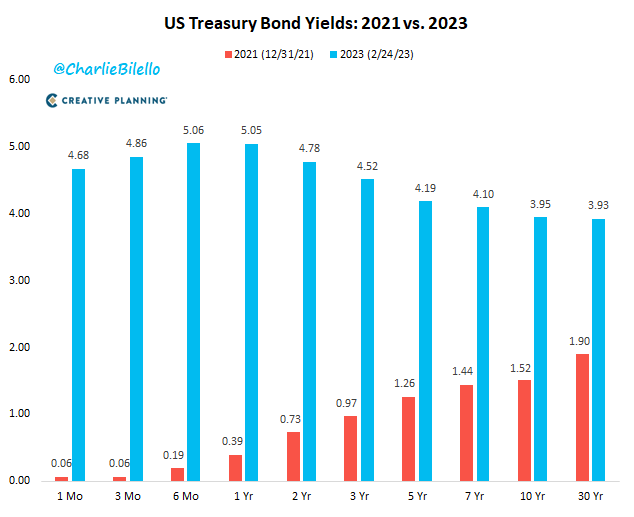
(4) Rising Yields
Stunning increases in US Treasury yields over the last 14 months, from historic lows to 16-year highs…
Video: youtube.com
Stunning increases in US Treasury yields over the last 14 months, from historic lows to 16-year highs…
Video: youtube.com
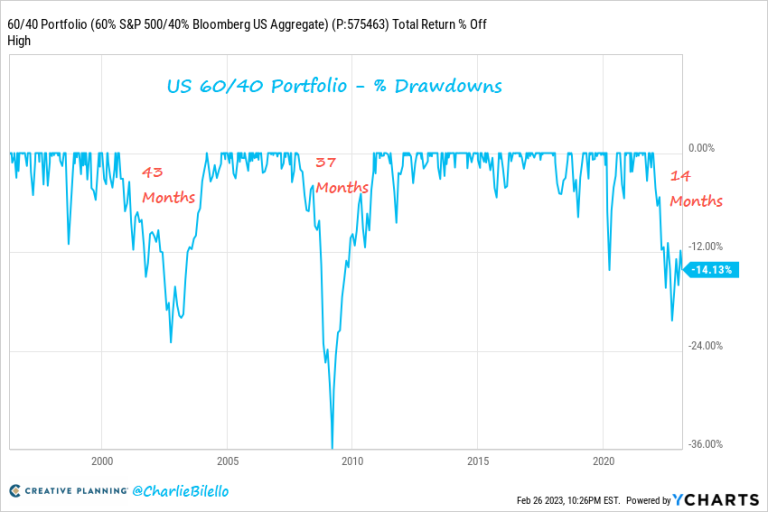
(5) 60/40 Drawdowns
A US 60/40 portfolio is currently in a 14-month drawdown, 14% below its high. This is now the longest drawdown for a 60/40 portfolio since the financial crisis (37 months) and before that the dot-com bubble (43 months).
Video: youtube.com
A US 60/40 portfolio is currently in a 14-month drawdown, 14% below its high. This is now the longest drawdown for a 60/40 portfolio since the financial crisis (37 months) and before that the dot-com bubble (43 months).
Video: youtube.com
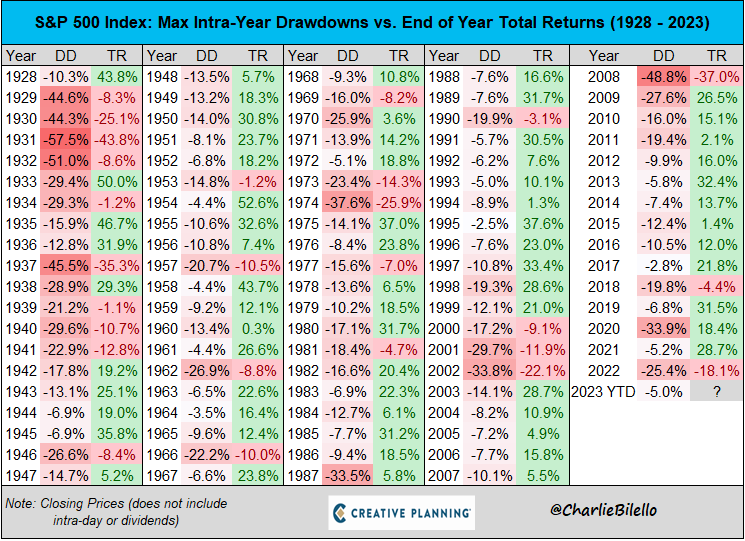
6) The First Pullback
After a booming start to 2023, the S&P 500 has come back to earth, suffering its first 5% pullback of the year. This is not at all unusual with an average intra-year drawdown of 16% since 1928.
Video: youtube.com
After a booming start to 2023, the S&P 500 has come back to earth, suffering its first 5% pullback of the year. This is not at all unusual with an average intra-year drawdown of 16% since 1928.
Video: youtube.com
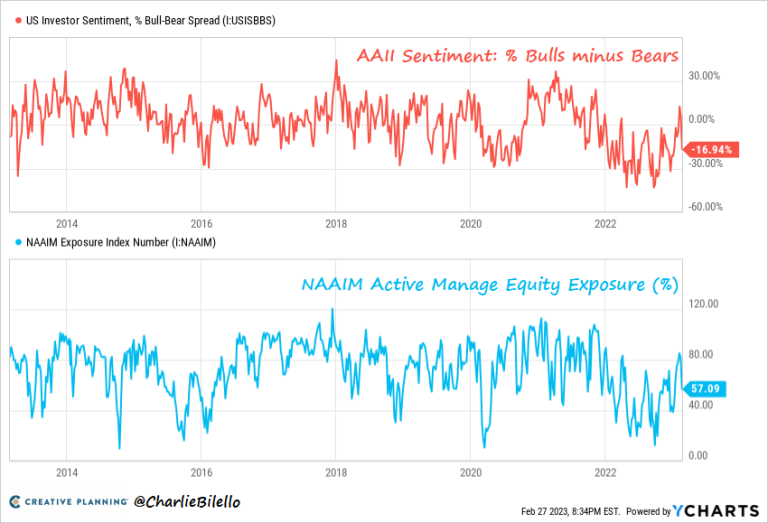
7) A Sentiment Shift
It only took a 5% S&P 500 pullback to push the AAII poll back into bearish territory, with bears once again outnumbering bulls. At the same time, active managers have quickly reduced their exposures (from 85% down to 57%).
Video: youtube.com
It only took a 5% S&P 500 pullback to push the AAII poll back into bearish territory, with bears once again outnumbering bulls. At the same time, active managers have quickly reduced their exposures (from 85% down to 57%).
Video: youtube.com
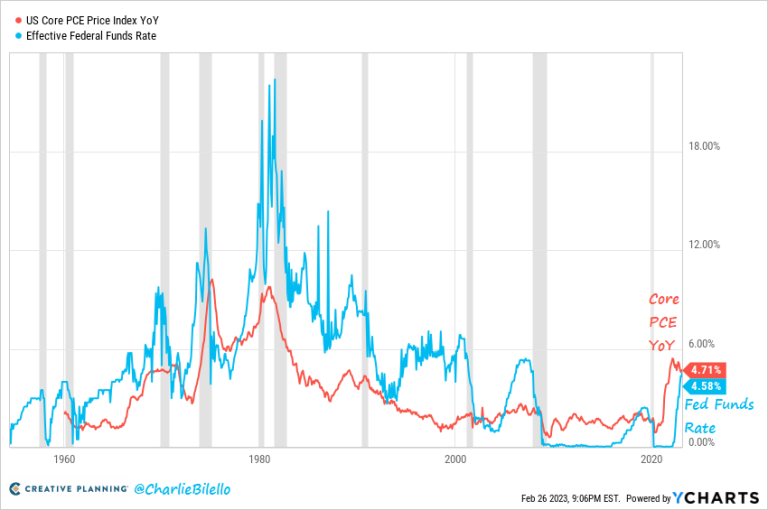
8a) Investor Fears - Inflation
At 4.71%, Core PCE (the Fed’s preferred measure of inflation) remains above the Effective Fed Funds Rate (4.58%) and was above expectations in its latest reading.
Video: youtube.com
At 4.71%, Core PCE (the Fed’s preferred measure of inflation) remains above the Effective Fed Funds Rate (4.58%) and was above expectations in its latest reading.
Video: youtube.com
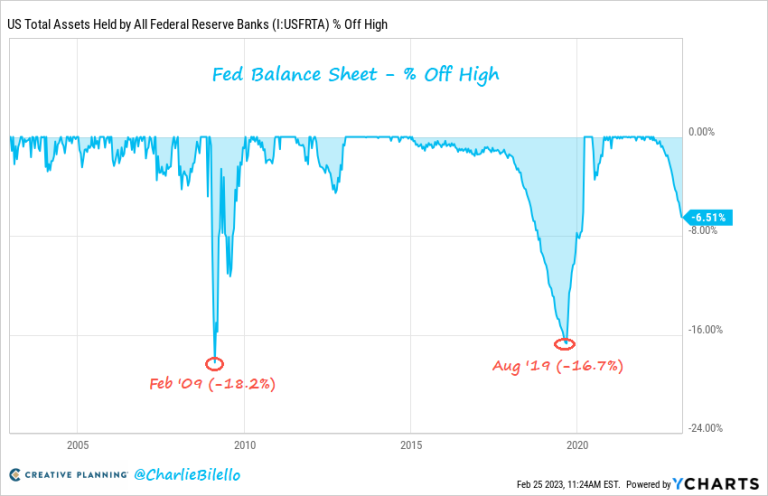
8b) Investor Fears - Fed Tightening
The market is currently expecting 3 more 25 bps rate hikes (to 5.25-5.50%) and a continued reduction in the Fed’s balance sheet which still has a long way to go before normalizing.
Video: youtube.com
The market is currently expecting 3 more 25 bps rate hikes (to 5.25-5.50%) and a continued reduction in the Fed’s balance sheet which still has a long way to go before normalizing.
Video: youtube.com
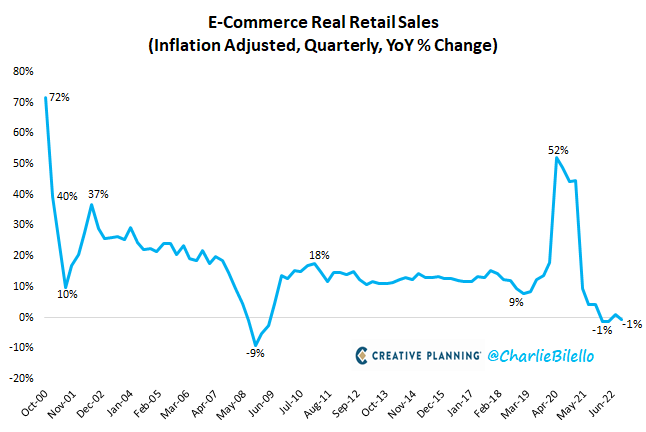
8c) Investor Fears - Recession
After adjusting for inflation, e-commerce retail sales fell 1% over the last year (down in 3 out of the last 4 quarters). The last time we saw negative real e-commerce sales was during the 2008-09 recession.
Video: youtube.com
After adjusting for inflation, e-commerce retail sales fell 1% over the last year (down in 3 out of the last 4 quarters). The last time we saw negative real e-commerce sales was during the 2008-09 recession.
Video: youtube.com
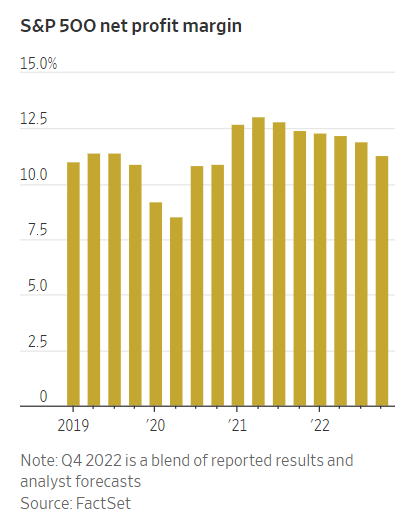
8d) Investor Fears - Profit Margins
S&P 500 net profit margins were down for the 6th consecutive quarter (to 11.3% from a peak of 13% in 2021). While sales are still rising, higher input costs (labor/materials/energy) are hurting the bottom line.
Video: youtube.com
S&P 500 net profit margins were down for the 6th consecutive quarter (to 11.3% from a peak of 13% in 2021). While sales are still rising, higher input costs (labor/materials/energy) are hurting the bottom line.
Video: youtube.com
9) WeWork for Losses?
WeWork has lost a total of $15.7 billion since the start of 2016…
2022: -$2.0 billion
2021: -$4.4 billion
2020: -$3.1 billion
2019: -$3.3 billion
2018: -$1.6 billion
2017: -$884 million
2016: -$430 million
Video: youtube.com
WeWork has lost a total of $15.7 billion since the start of 2016…
2022: -$2.0 billion
2021: -$4.4 billion
2020: -$3.1 billion
2019: -$3.3 billion
2018: -$1.6 billion
2017: -$884 million
2016: -$430 million
Video: youtube.com
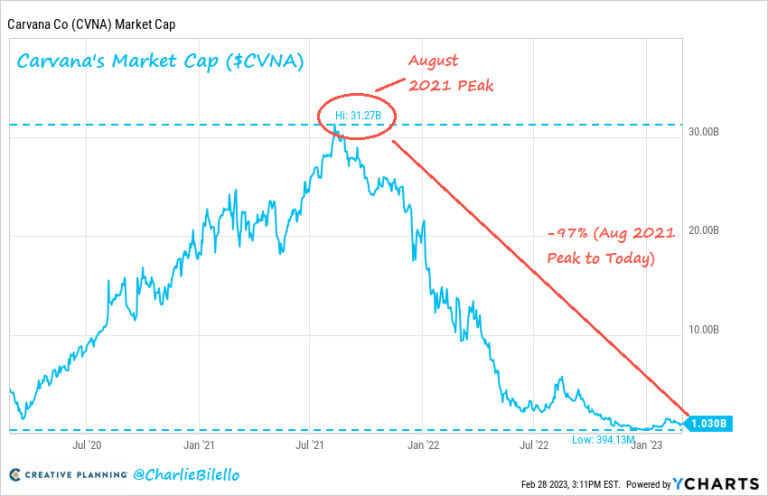
10) Carvana
Back in August 2021, Carvana was valued at over $31 billion with investors caring only about top-line revenue growth. Fast forward to today & the bottom-line matters again, resulting in a 97% decline in its market cap to $1 billion.
Video: youtube.com
Back in August 2021, Carvana was valued at over $31 billion with investors caring only about top-line revenue growth. Fast forward to today & the bottom-line matters again, resulting in a 97% decline in its market cap to $1 billion.
Video: youtube.com
Loading suggestions...