

In crypto you often hear "It's too late, it has already pumped"
This could not be further from the truth
This is how to use trend continuation to print millions on altcoins such as $MATIC, $SOL, $FET, $AGIX
🧵👇🏽
This could not be further from the truth
This is how to use trend continuation to print millions on altcoins such as $MATIC, $SOL, $FET, $AGIX
🧵👇🏽
Let me first tell you a story of how I missed out on millions of dollars of profit just because of a dumb psychological mindset I adapted early in my trading career
For the longest time I was the one that used to think "it has already pumped its too risky to enter now"
For the longest time I was the one that used to think "it has already pumped its too risky to enter now"
I would then proceed to try and find lagging altcoins in the same sector/with the same narrative that haven't pumped yet and buy these.
This is the dumbest thing you can do. Let me explain
This is the dumbest thing you can do. Let me explain
You want to bet on winners 🏆
Always.
The last thing you want is sitting days or weeks in a lagging asset that might or might not start catching up.
Just because something started to pump does not mean it is too late to enter.
You just gotta be smart about it 👇🏽
Always.
The last thing you want is sitting days or weeks in a lagging asset that might or might not start catching up.
Just because something started to pump does not mean it is too late to enter.
You just gotta be smart about it 👇🏽
Most of the time you won't catch the first leg up and thats fine cuz it does not matter.
Here is a step by step blueprint on how to:
1. Find winners
2. Keep track of winners
3. How to enter on consolidations/retraces
let's get into it
Here is a step by step blueprint on how to:
1. Find winners
2. Keep track of winners
3. How to enter on consolidations/retraces
let's get into it
1. How to find winners early.
We want to keep watchlists of assets and observe when something starts going up.
For Binance watchlists head over to sandwich.finance download the newest USDT/BUSD pair list.
Import into tradingview.
Click sort by % change once a day
We want to keep watchlists of assets and observe when something starts going up.
For Binance watchlists head over to sandwich.finance download the newest USDT/BUSD pair list.
Import into tradingview.
Click sort by % change once a day
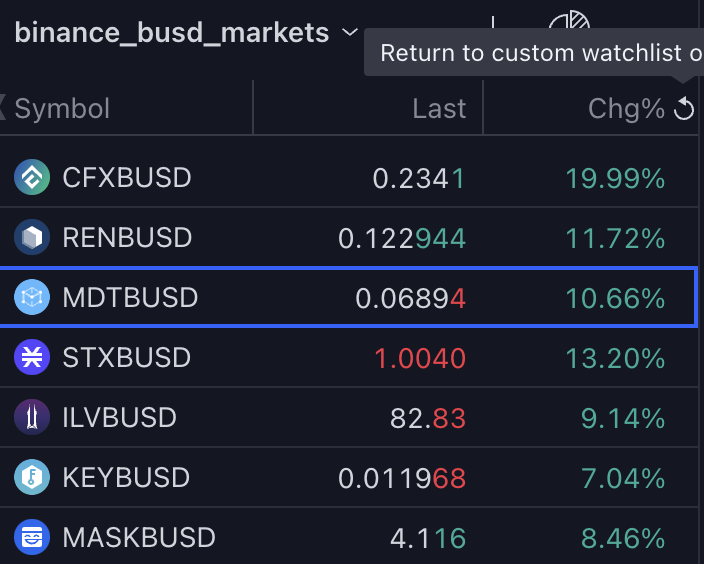
2. Keep track of winners:
We want to keep track of assets that are on top of daily % change. Import them to your main watchlist.
Let's now look at an example of how this would look in practice.
We want to keep track of assets that are on top of daily % change. Import them to your main watchlist.
Let's now look at an example of how this would look in practice.
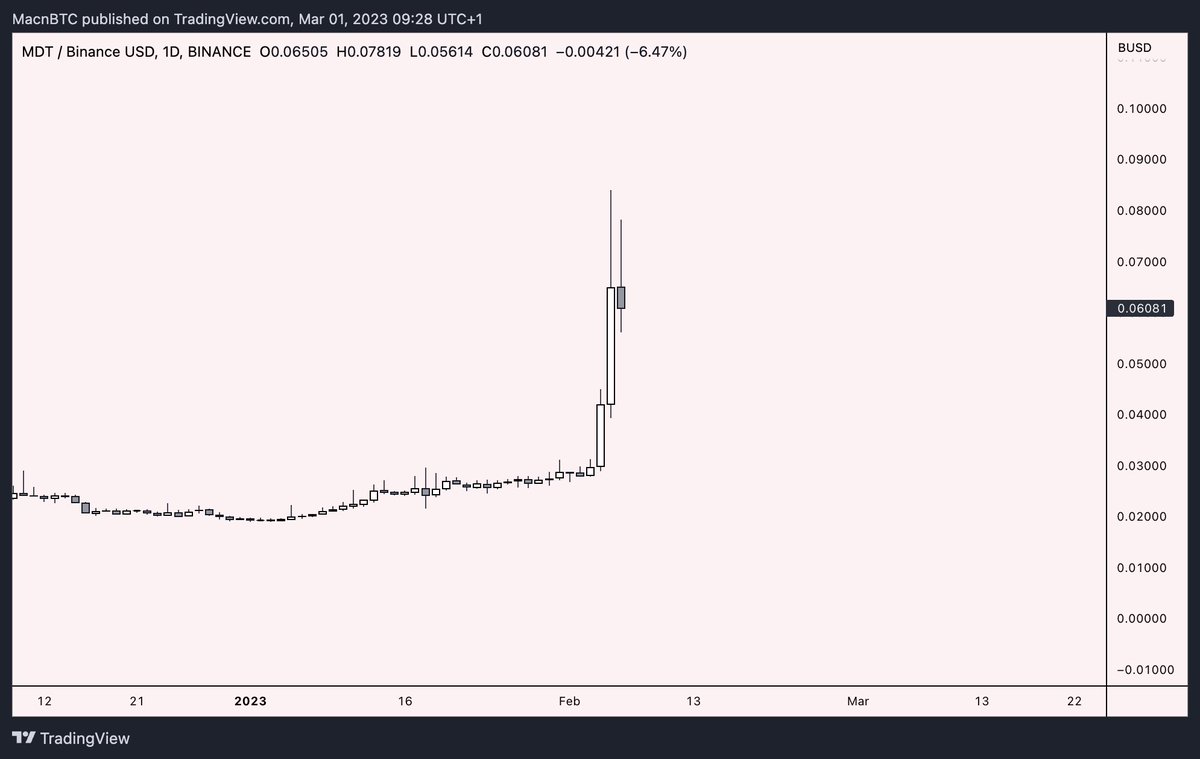
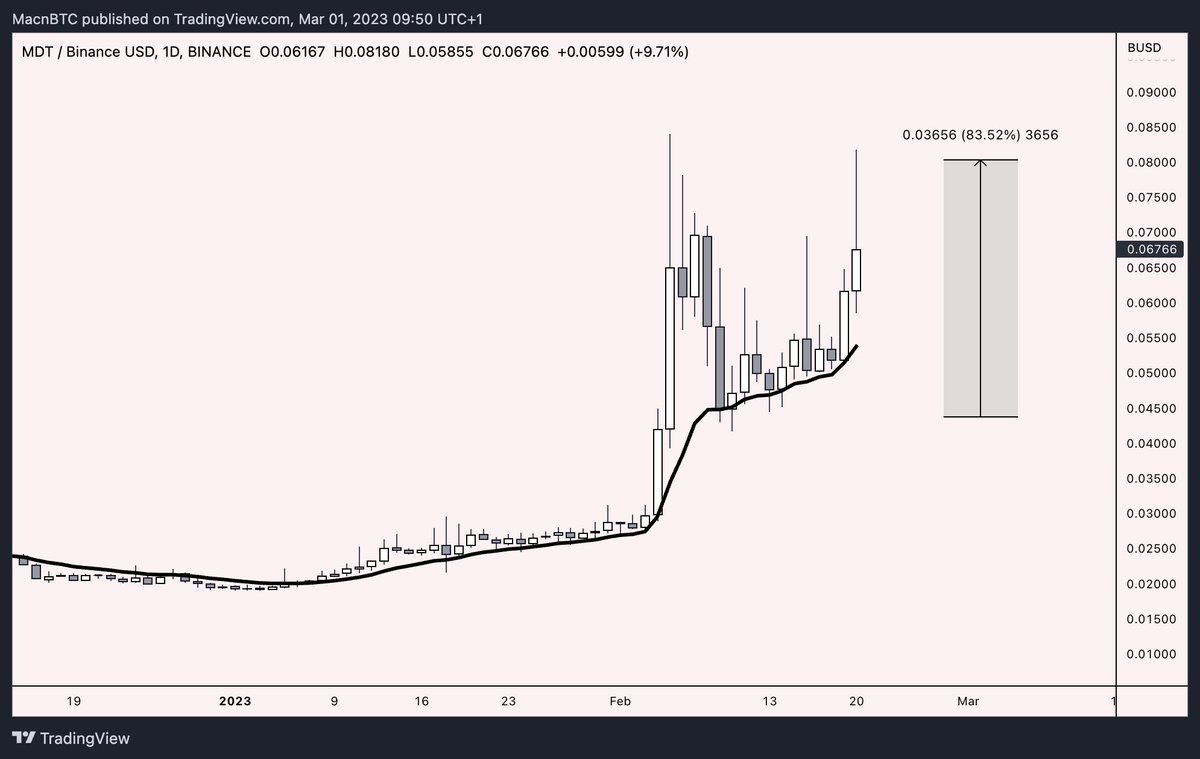
$MDT a recent example. Start of Feb $MDT was the top daily % gainer for 2 days.
We missed both leg ups but we aren't coping. We know a retrace will come where we can enter for a nice bounce
We missed both leg ups but we aren't coping. We know a retrace will come where we can enter for a nice bounce
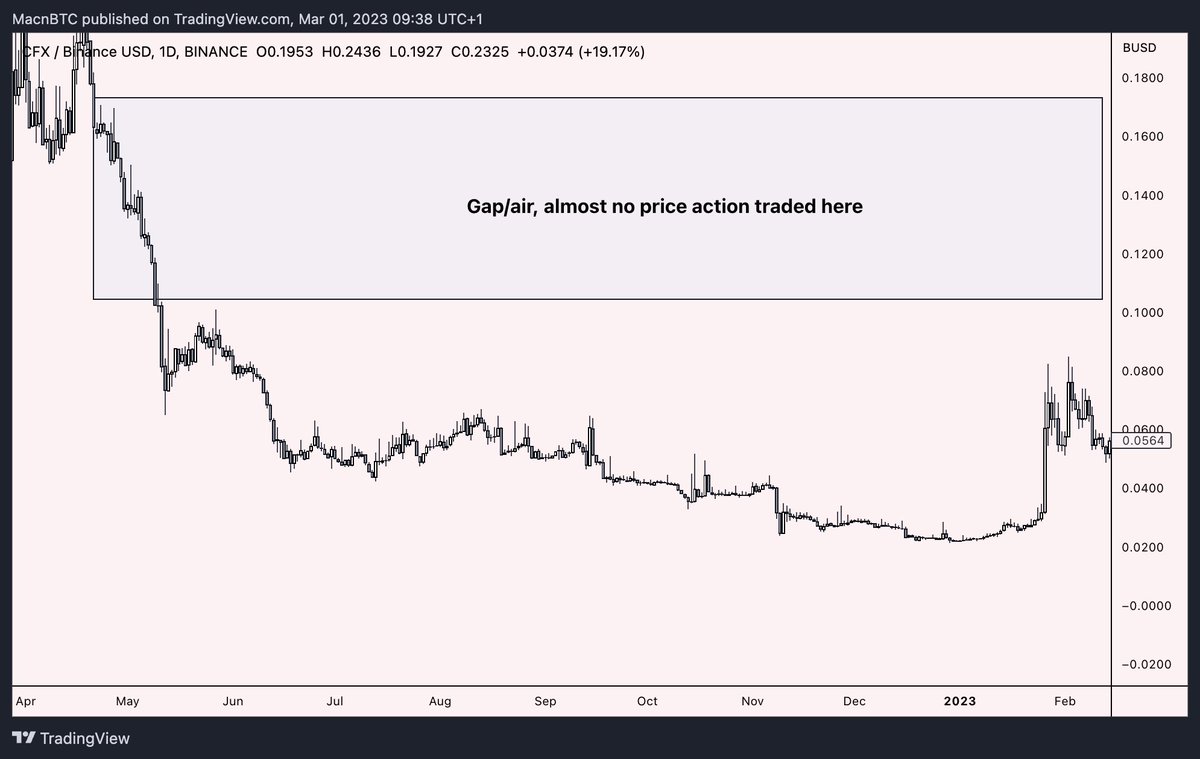
Now you probably have a lot of questions like "how do I know it will continue pumping" - simply put you zoom out, check the resistance levels and MAs.
I will cover some very simple strategies but please head over to my profile and read the pinned tweet where I covered this
I will cover some very simple strategies but please head over to my profile and read the pinned tweet where I covered this
If the high timeframe trend looks reset or there is a big gap till next resistance/MAs above then the asset is a good candidate for continuation.
We want to only buy/enter on either:
a) consolidations
b) retraces
Tools we are going to use to mark out levels and trends that will help us with this.
- Moving averages such as daily SMMA 7, SSMA 25, 4H MA 200, 4H EMA 200
- VWAPs
a) consolidations
b) retraces
Tools we are going to use to mark out levels and trends that will help us with this.
- Moving averages such as daily SMMA 7, SSMA 25, 4H MA 200, 4H EMA 200
- VWAPs
In this thread I will only cover how we can enter using moving averages. I will cover VWAPs in a future thread so make sure you follow.
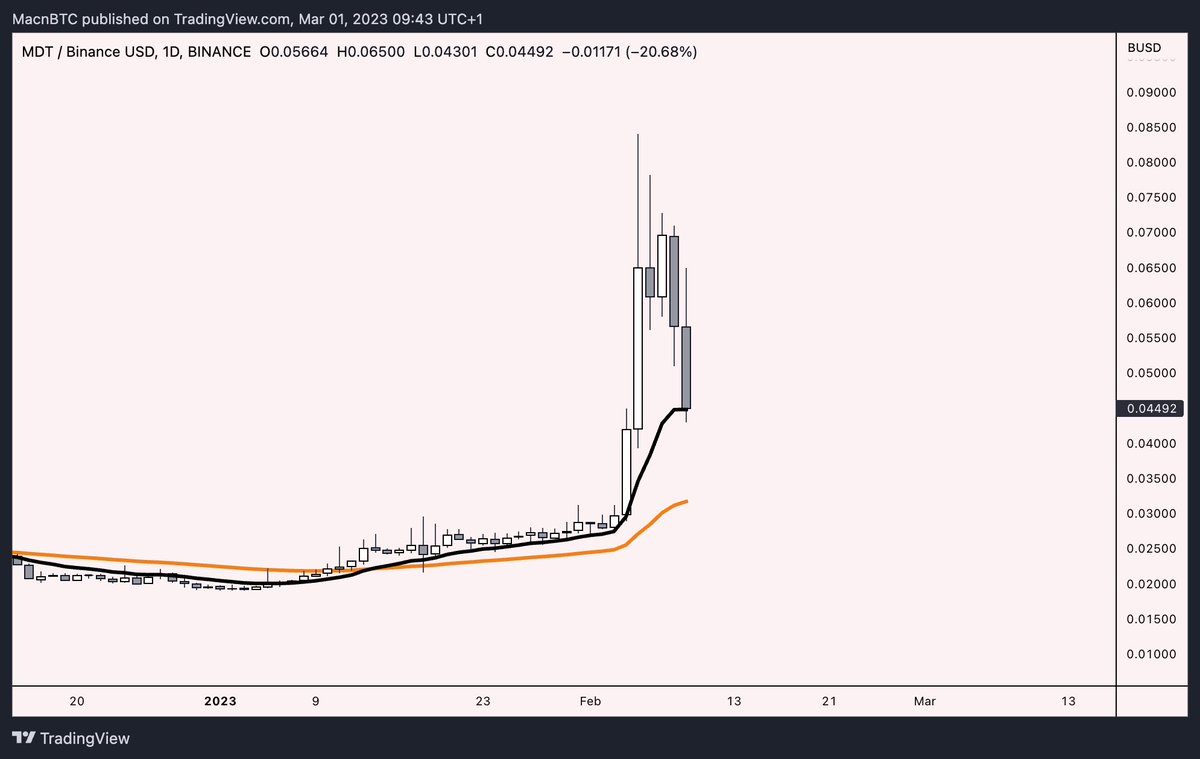
Let's now head back to our example of $MDT
Let's now head back to our example of $MDT
Alright so how do we enter on retraces..
There is a lot of strategies but let me tell you the ones that work well for me.
After a pump you want to wait for the retrace. Often the harder and faster the coin has pumped the more aggressive the retrace is gonna be
There is a lot of strategies but let me tell you the ones that work well for me.
After a pump you want to wait for the retrace. Often the harder and faster the coin has pumped the more aggressive the retrace is gonna be

Simple strategy: Buying the first tap retrace of daily SSMA 7
This is a highly profitable strategy with a clear stoploss.
I like to put a conditional stoploss similar to "if daily candle closes way under under SSMA 7 then I exit"
This is a highly profitable strategy with a clear stoploss.
I like to put a conditional stoploss similar to "if daily candle closes way under under SSMA 7 then I exit"
This strategy is so simple and great, we are simply bidding the daily trend under the condition that if the asset is bullish it will bounce and continue pumping.
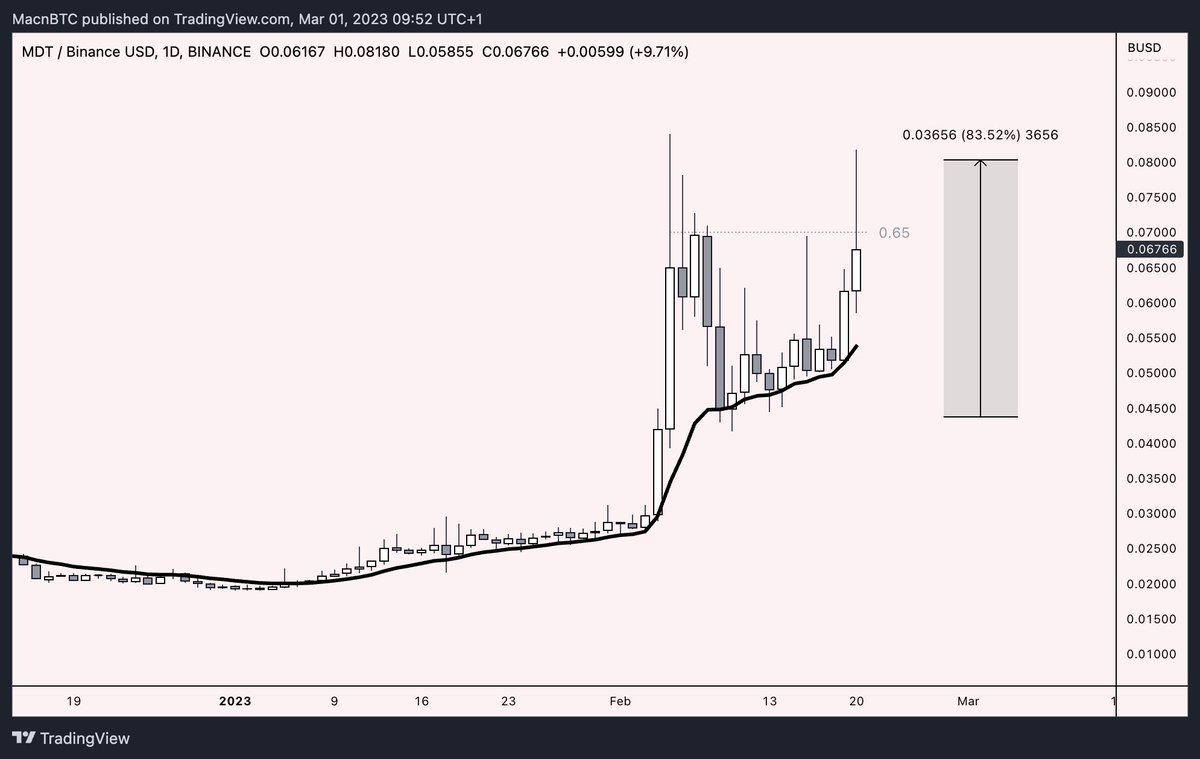
If you want to know what targets to put you can simply draw a fib from the top of the pump to the daily SSMA7 and target the 0.65 fib like so.
It usually at least retests the 0.65 fib level.
It usually at least retests the 0.65 fib level.
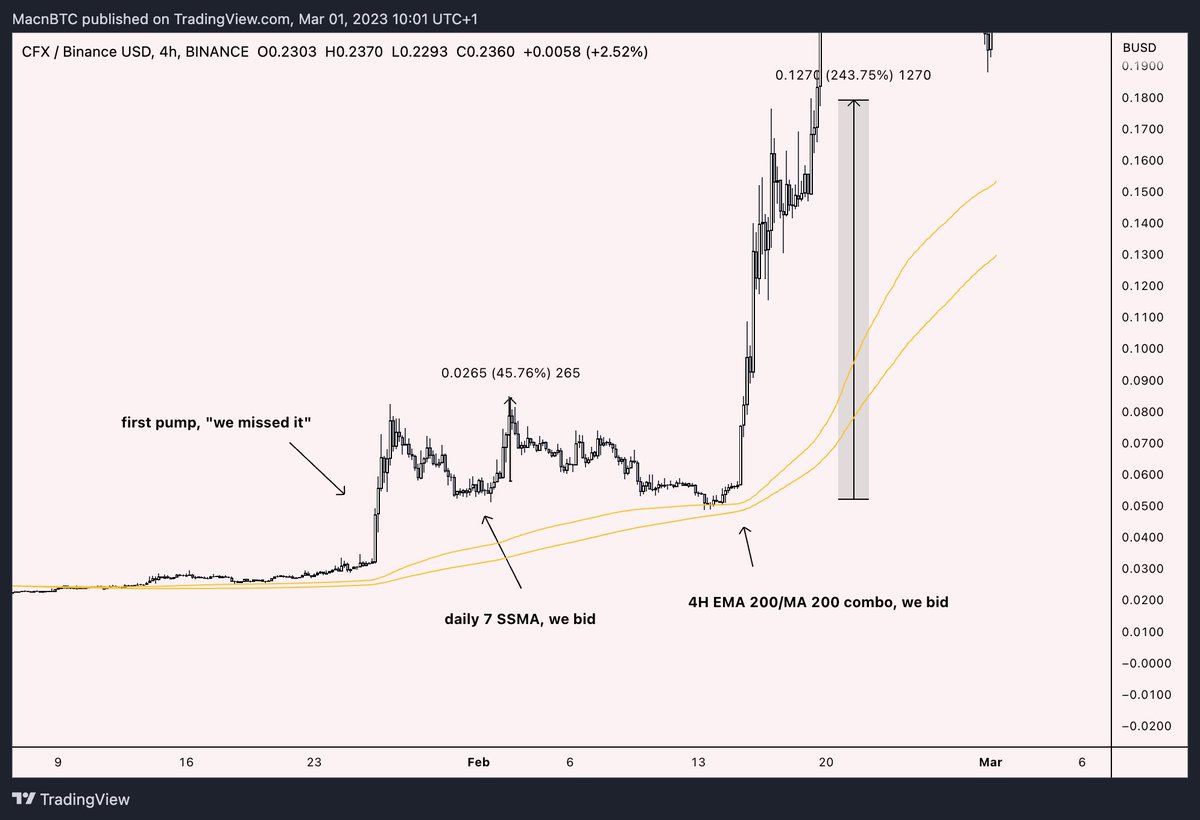
Buying retraces strategy nr 2: Bidding the first retrace tap of EMA 200/MA 200 combo 👇🏽
Retests of daily trend are powerful, but what is even more powerful is the first tap of EMA 200/MA 200
This strategy is great because we can easily bid these with a clear stoploss level
Retests of daily trend are powerful, but what is even more powerful is the first tap of EMA 200/MA 200
This strategy is great because we can easily bid these with a clear stoploss level
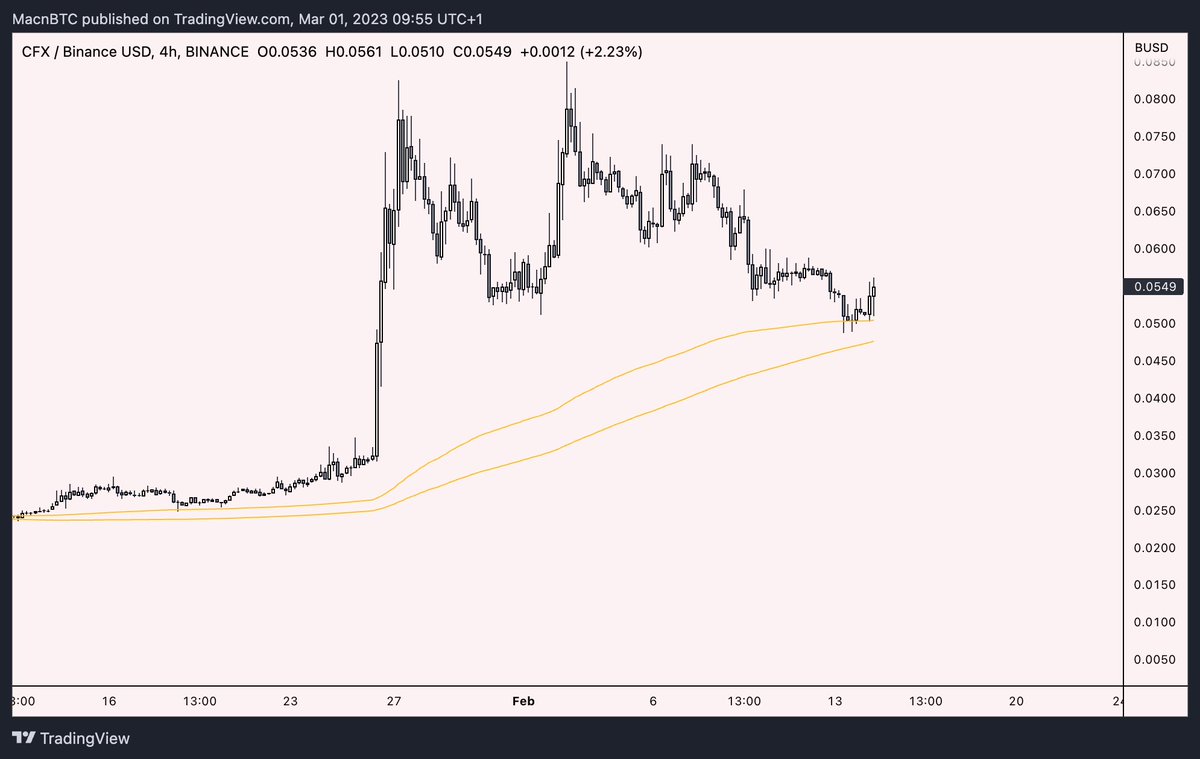
a chart says more than a thousand words...
$CFX
$CFX
Alright now you have two simple strategies to bid on retraces, lfg🤝
Let's jump into spotting consolidations and how to play them.
Let's jump into spotting consolidations and how to play them.
First I think the common question people have is: how do I know if an asset is consolidating or getting distributed
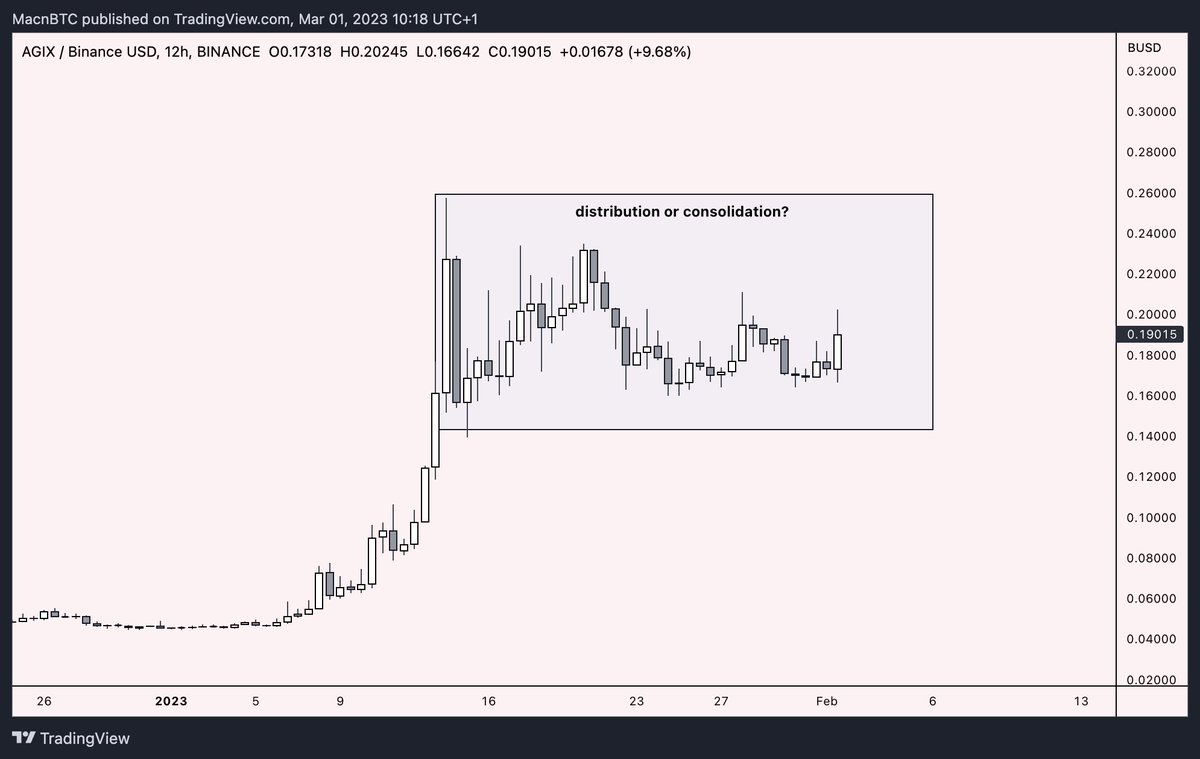
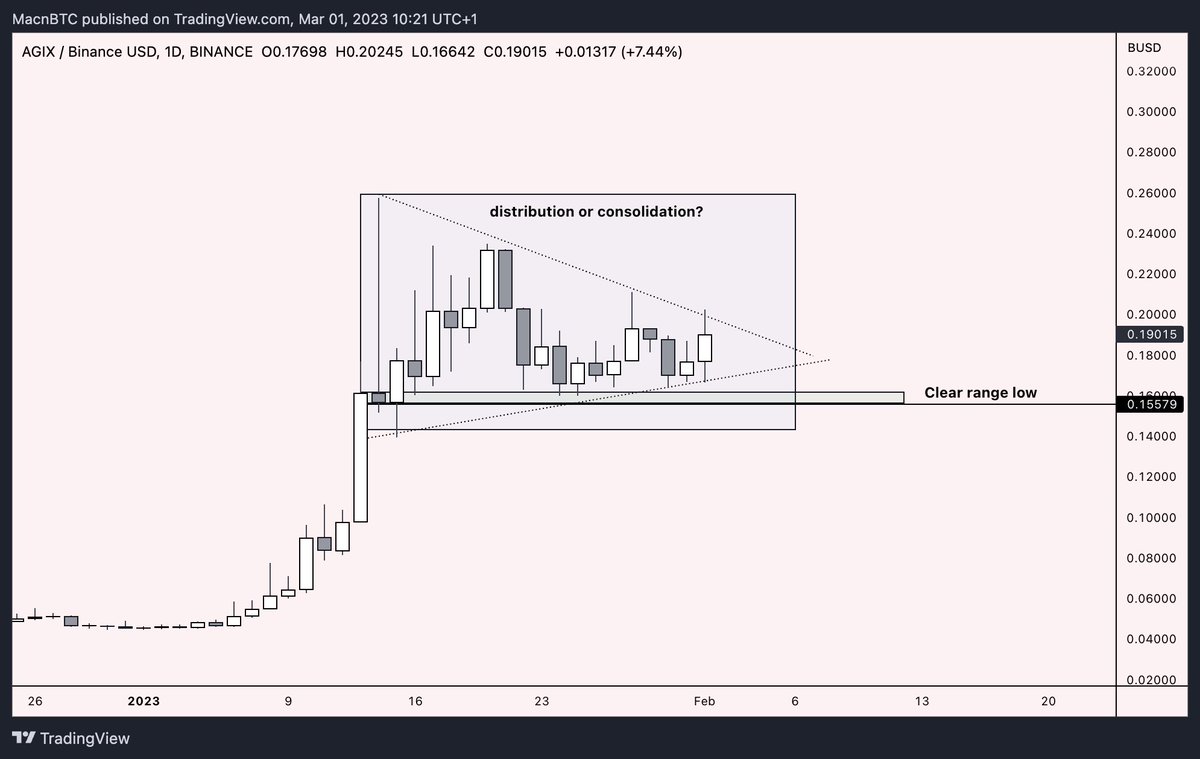
Firstly consolidations often have a clear range low that is defended.
Once price comes close to range low it often prints small candle bodies and continues sideways in a triangle shape constantly getting tighter and tighter
We can use MAs + indicators like VWAPs or MFI confirm
Once price comes close to range low it often prints small candle bodies and continues sideways in a triangle shape constantly getting tighter and tighter
We can use MAs + indicators like VWAPs or MFI confirm
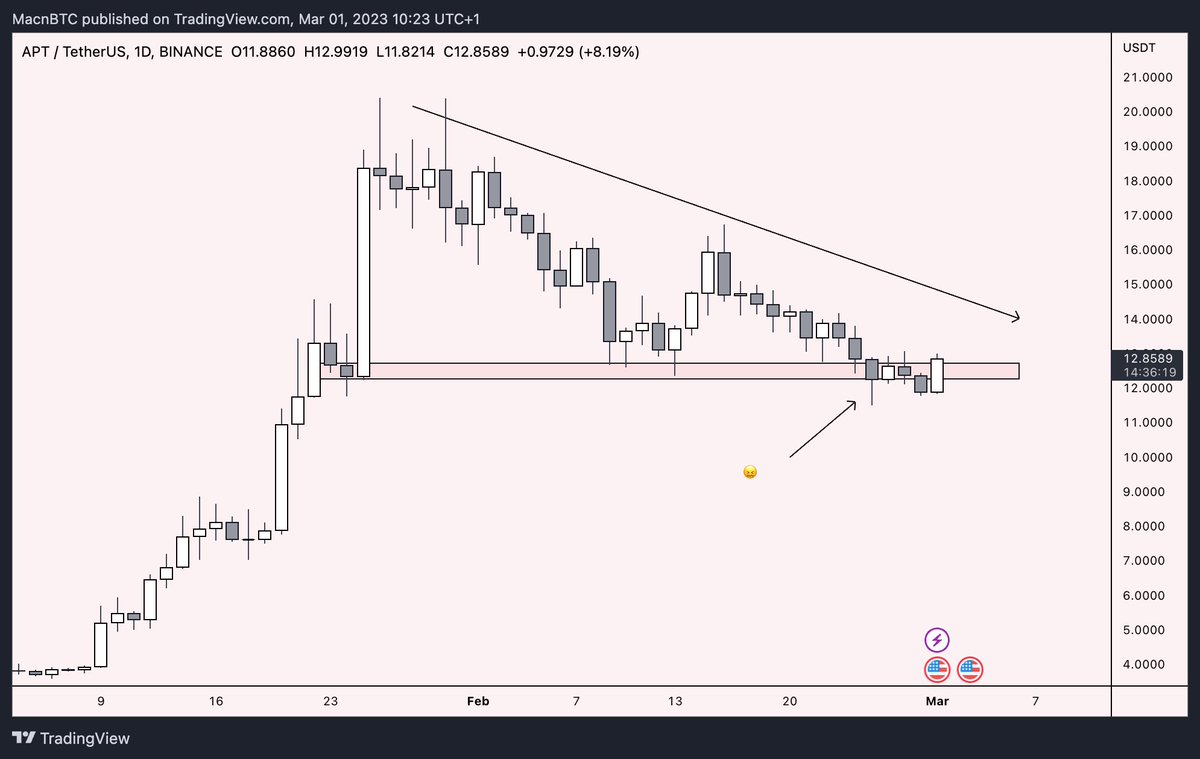
Below is what distribution looks like.
Market-makers often print what I call the staircase of death.
Slowly decreasing price in a straicase matter generating the most amount of liquidity from reking shorts and longs.
Don't get trapped in these.
Market-makers often print what I call the staircase of death.
Slowly decreasing price in a straicase matter generating the most amount of liquidity from reking shorts and longs.
Don't get trapped in these.
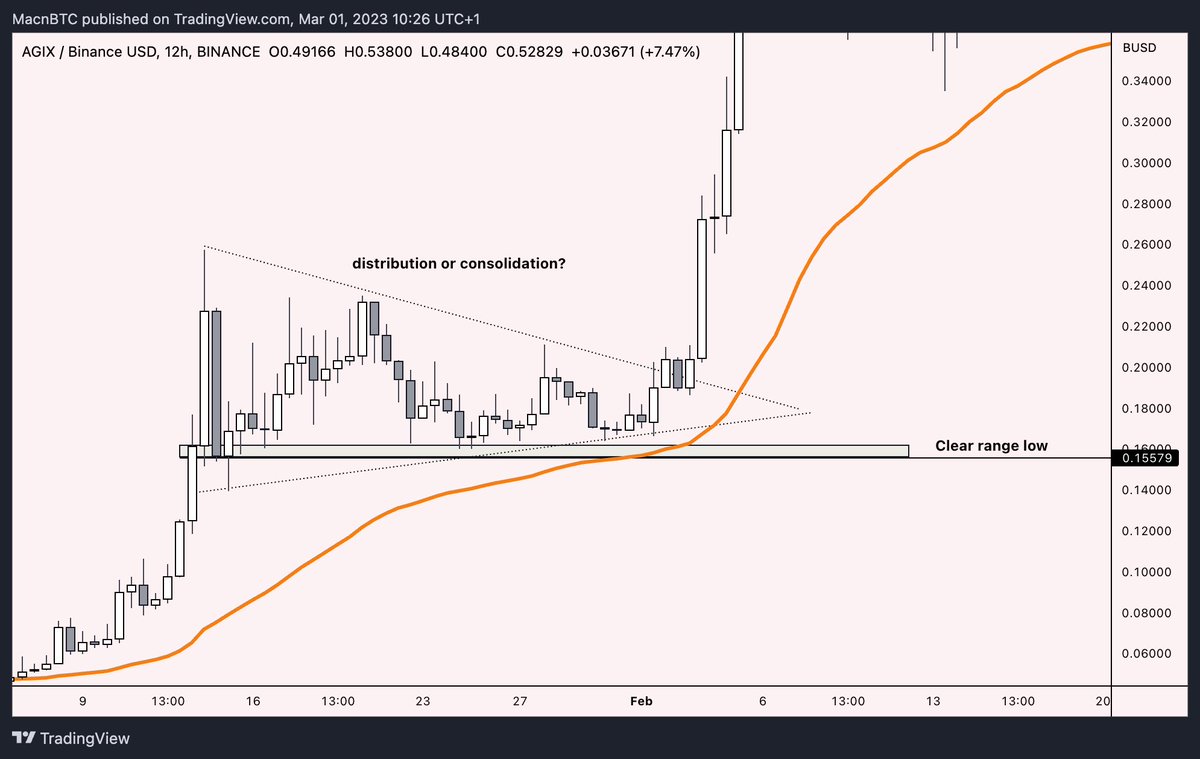
Alright back to our example of $AGIX
Simple strategy of bidding consolidations:
Mark out daily breaker/range low. Bid if a clear triangle forms, use indicators such as 12H SSMA 25, 1D SSMA 25, 4H MA 200/4H EMA 200 for confirmation to know when chart is ready for the next leg
Simple strategy of bidding consolidations:
Mark out daily breaker/range low. Bid if a clear triangle forms, use indicators such as 12H SSMA 25, 1D SSMA 25, 4H MA 200/4H EMA 200 for confirmation to know when chart is ready for the next leg

Loading suggestions...