

📚 - This is everything you need to know about MACD
As one of the simpler indicators to use, the MACD indicator is a great indicator to get started with technical analysis.
Let's see how it works!
As one of the simpler indicators to use, the MACD indicator is a great indicator to get started with technical analysis.
Let's see how it works!
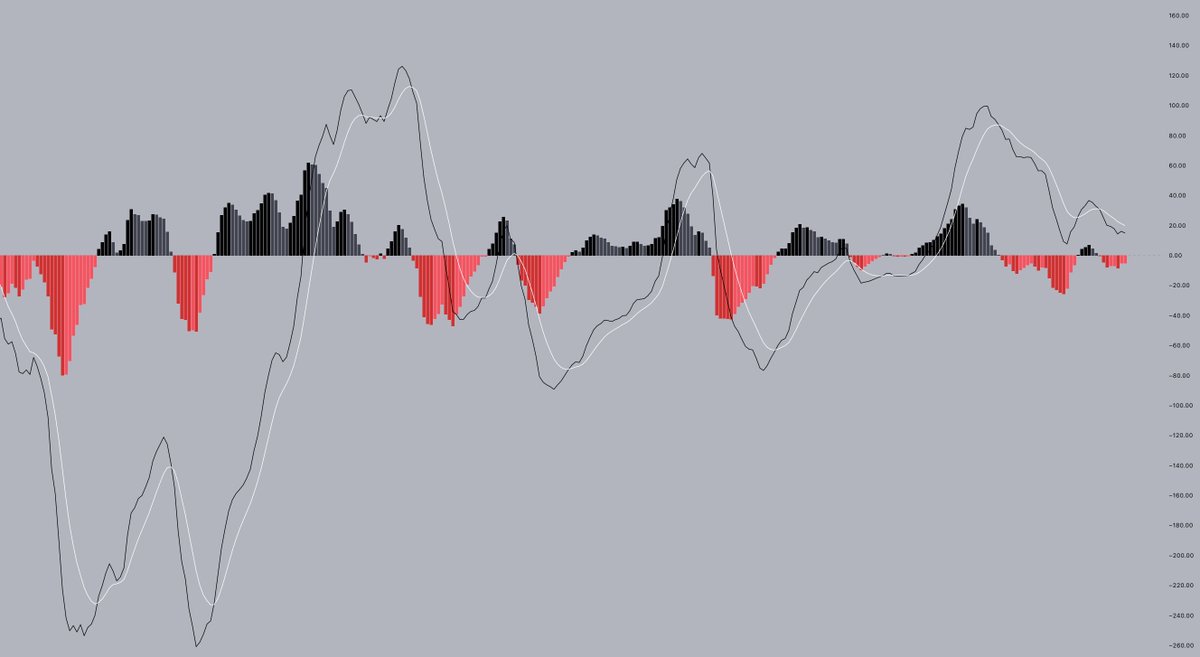
The MACD indicator (short for moving average convergence divergence) is a trend-following indicator used to gauge the momentum behind a move.
It combines two EMAs, in order to print these insights.
It combines two EMAs, in order to print these insights.
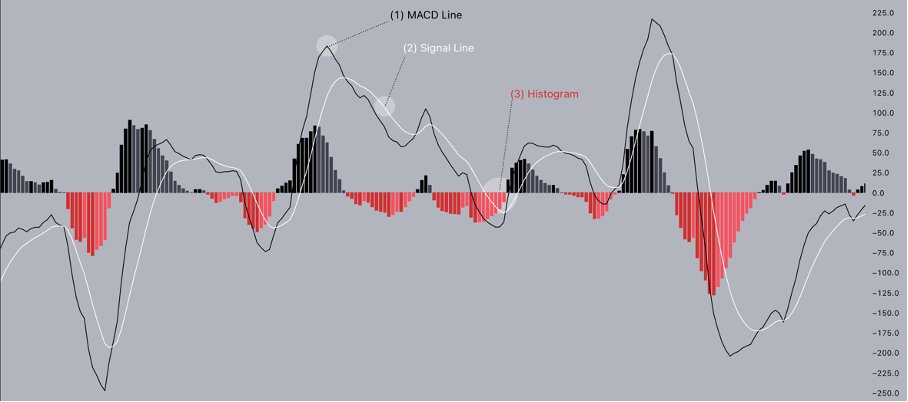
The indicator has three distinct elements:
1⃣ The MACD Line (shows the trend)
2⃣ The Signal Line (shows reversals)
3⃣ The Histogram (shows the momentum)
1⃣ The MACD Line (shows the trend)
2⃣ The Signal Line (shows reversals)
3⃣ The Histogram (shows the momentum)
There are three main ways to use this:
1⃣ Zero Line Crossovers:
Using the zero line as a gauge. Bullish when the MACD line is above it, and bearish below.
2⃣ Signal Line Crossovers:
Bullish when the MACD line crosses above the signal line, bearish when it crosses below.
1⃣ Zero Line Crossovers:
Using the zero line as a gauge. Bullish when the MACD line is above it, and bearish below.
2⃣ Signal Line Crossovers:
Bullish when the MACD line crosses above the signal line, bearish when it crosses below.
3⃣ MACD Divergences:
Similar to RSI divergences, they occur when the highs or lows of the MACD diverge from price action.
Example: Bitcoin prints a lower low, while MACD prints a higher low. This is a bullish MACD divergence, signalling a potential bounce.
Similar to RSI divergences, they occur when the highs or lows of the MACD diverge from price action.
Example: Bitcoin prints a lower low, while MACD prints a higher low. This is a bullish MACD divergence, signalling a potential bounce.
All in all, the MACD indicator can provide meaningful insights to use in your trading. Keep in mind indicators can provide false or misleading signals too, and you should therefore never trade based on indicators alone.
Thats all for today! Leave me a like on the main tweet if you enjoyed this, and stay tuned for a more detailed writeup on MACD.
Cheers!
Cheers!
Loading suggestions...