

𝐖𝐡𝐚𝐭 𝐢𝐬 𝐒𝐰𝐢𝐧𝐠 𝐓𝐫𝐚𝐝𝐢𝐧𝐠, 𝐓𝐡𝐞 𝐔𝐥𝐭𝐢𝐦𝐚𝐭𝐞 𝐁𝐞𝐠𝐢𝐧𝐧𝐞𝐫𝐬 𝟐𝟎𝟐𝟑 𝐆𝐮𝐢𝐝𝐞!
A Master Thread.👇🧵
A Master Thread.👇🧵
This is what will discuss into thread!
- Trading Styles vs. Strategies
- What is Swing Trading?
- Day Trading vs. Swing Trading
Step 1: Move to the Daily TF
Step 2: Draw Key S&R Levels
Step 3: Evaluate Momentum
Step 4: Watch for Price Action Signals
Step 5: Identify Exit Point
- Trading Styles vs. Strategies
- What is Swing Trading?
- Day Trading vs. Swing Trading
Step 1: Move to the Daily TF
Step 2: Draw Key S&R Levels
Step 3: Evaluate Momentum
Step 4: Watch for Price Action Signals
Step 5: Identify Exit Point
Trading Styles vs. Strategies
Styles and strategies must be identified before proceeding.
As noted, trading styles are significantly less than strategies.
Popular styles include:
Swing trading
Day-trading
Styles and strategies must be identified before proceeding.
As noted, trading styles are significantly less than strategies.
Popular styles include:
Swing trading
Day-trading
Scalping (typically a subcategory of day trading) (often a subset of day trading)
Speculating
HFT
Each has hundreds or thousands of strategies. Hence, day and swing trading have several methods.
Speculating
HFT
Each has hundreds or thousands of strategies. Hence, day and swing trading have several methods.
Each trader determines their style.
One day trader may use 3 and 8 exponential moving averages with slow stochastics. A similar trader may utilize a 5 and 10 simple moving average with a relative strength index.
Their day trading techniques differ.
One day trader may use 3 and 8 exponential moving averages with slow stochastics. A similar trader may utilize a 5 and 10 simple moving average with a relative strength index.
Their day trading techniques differ.
What is Swing Trading?
Swing trading, as the name suggests, is a way to try to make money from the ups and downs swings of the market.
There are two parts to these swings: the body and the swing point.
Swing trading, as the name suggests, is a way to try to make money from the ups and downs swings of the market.
There are two parts to these swings: the body and the swing point.
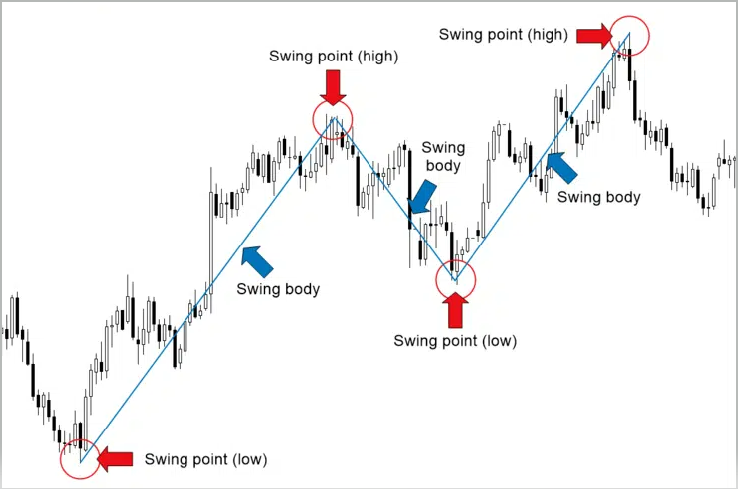
As traders, it's our job to time our entries so that we catch the majority of each swing body.
Even though catching a swing point can be very profitable, it's not a must.
Even though catching a swing point can be very profitable, it's not a must.
Day Trading vs. Swing Trading
Day trading is on the other end of the spectrum from swing trading. These two things couldn't be more different.
You now know that the goal of swing trading is to take advantage of big changes in the market.
Day trading is on the other end of the spectrum from swing trading. These two things couldn't be more different.
You now know that the goal of swing trading is to take advantage of big changes in the market.
This, of course, needs a waiting period of a few days to a few weeks.
In day trading, on the other hand, you only hold on to your investments for a very short time, sometimes just a few seconds.
In day trading, on the other hand, you only hold on to your investments for a very short time, sometimes just a few seconds.
Step 1: Move to the Daily Time Frame
Most of my time is spent looking at the daily charts. They show a bigger picture of what's going on with the price action and give more reliable signals.
Most of my time is spent looking at the daily charts. They show a bigger picture of what's going on with the price action and give more reliable signals.
Start with the daily time frame, which is what I suggest. Once you learn how to swing trade and make money with the daily time frame, you can switch to the 4-hour time frame.
Price action signals tend to be more accurate as you move from lower time frames to higher ones.
Price action signals tend to be more accurate as you move from lower time frames to higher ones.
Step 2: Draw Key S&R Levels
This is the most important part of the whole process, after Step 1.
Think of drawing key support and resistance levels as building the foundation of your house. Without them, it's impossible to find good swing trades.
This is the most important part of the whole process, after Step 1.
Think of drawing key support and resistance levels as building the foundation of your house. Without them, it's impossible to find good swing trades.
Step 3: Evaluate Momentum
At this point, you should be looking at the daily chart and have marked all of the important support and resistance areas.
Remember how I said earlier in the post that you can measure momentum by using swing points?
At this point, you should be looking at the daily chart and have marked all of the important support and resistance areas.
Remember how I said earlier in the post that you can measure momentum by using swing points?
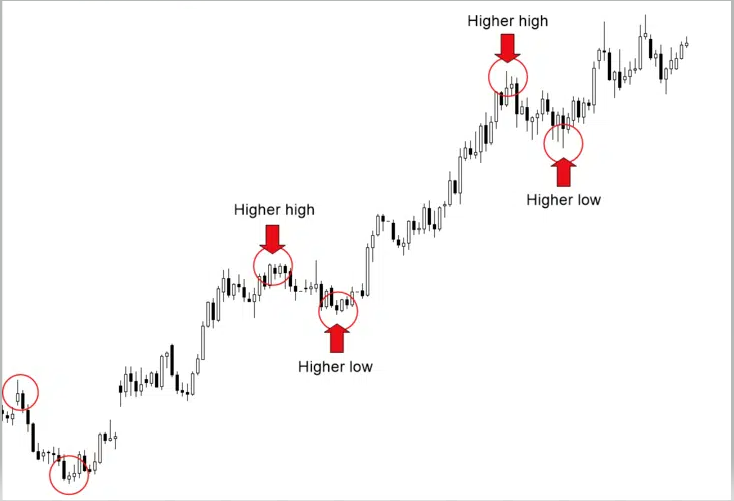
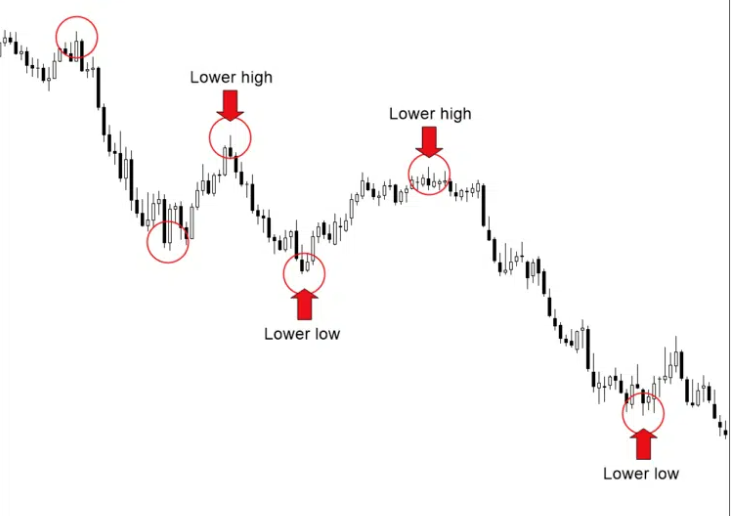
There are three types of market momentum or lack thereof.
Uptrend: Higher highs and higher lows
Downtrend: Lower highs and lower lows
Range: Sideways movement
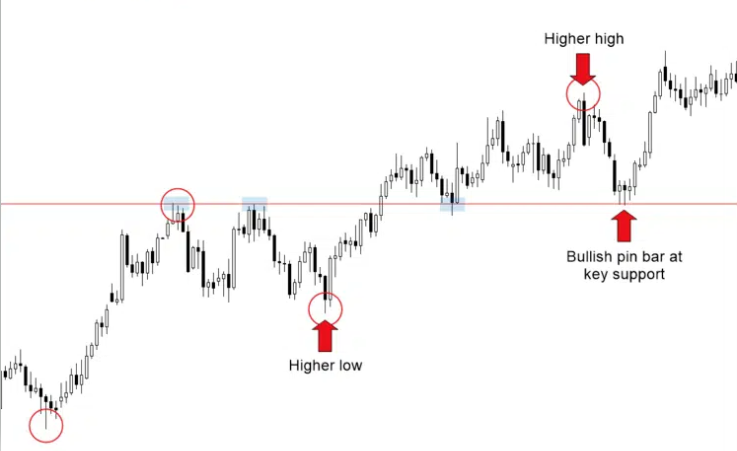
A market that’s in an uptrend is carving higher highs and higher lows.
Uptrend: Higher highs and higher lows
Downtrend: Lower highs and lower lows
Range: Sideways movement
A market that’s in an uptrend is carving higher highs and higher lows.
Notice how each swing point is higher than the last. You want to be a buyer during bullish momentum such as this.
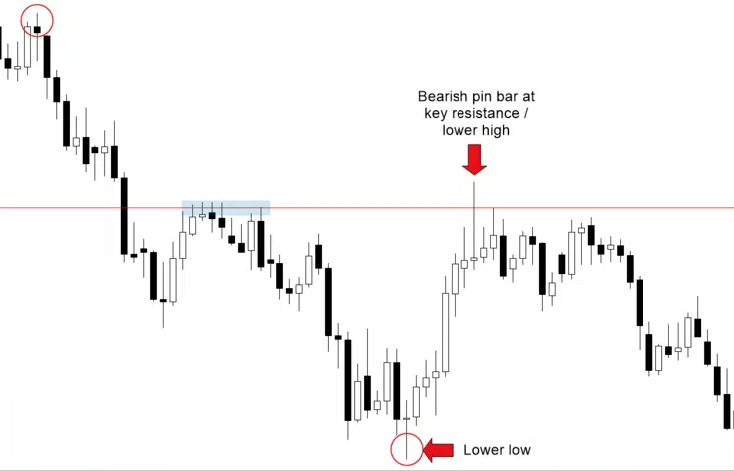
On the opposite end of the spectrum we have a downtrend. In this case, the market is carving lower highs and lower lows.
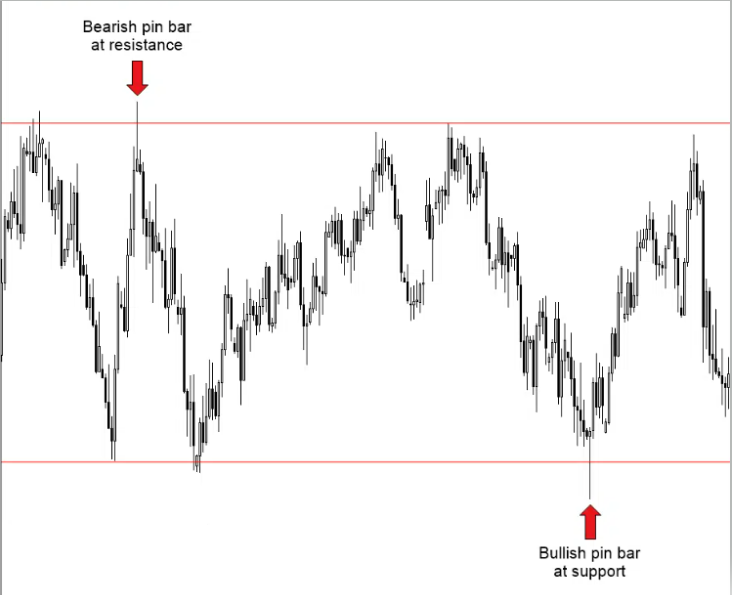
Last but not least is a ranging market. As the name implies, this occurs when a market moves sideways within a range.
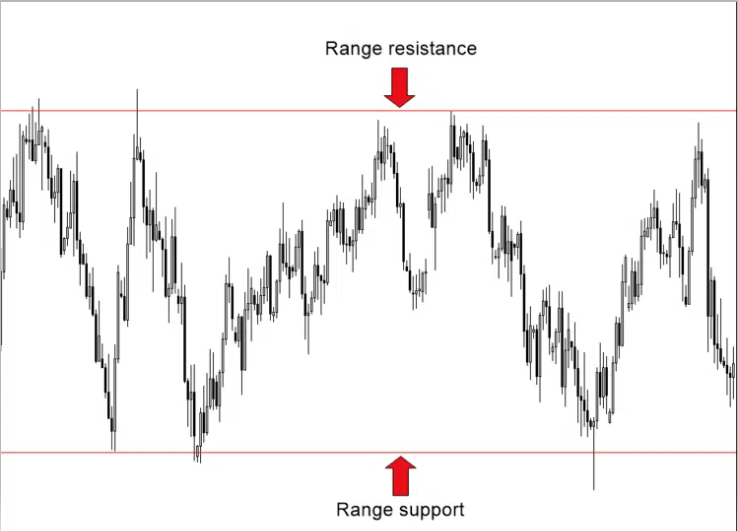
In fact, ranges like the one above can sometimes lead to the best trades. Most of this is because support and resistance levels stand out from the price action around them.
Look at the two pin bars in the chart below.
Look at the two pin bars in the chart below.
Step 4: Watch for Price Action Signals
Let's talk about where you should be right now.
Steps 1 and 2 showed you how to use the daily time frame to find key support and resistance levels.
Let's talk about where you should be right now.
Steps 1 and 2 showed you how to use the daily time frame to find key support and resistance levels.
Then, in Step 3, you learned how to figure out how fast the market was going. This tells you if the market is going up, going down, or staying in a certain range.
If the market is going up, you should start looking for signs to buy from key support.
If the market is going up, you should start looking for signs to buy from key support.
Here is a great example of a bullish pin bar that occurred at key support during an uptrend.
The goal is to use this pin bar signal to buy the market. By doing this, we can profit as the market swings upward and continues the current rally.
The goal is to use this pin bar signal to buy the market. By doing this, we can profit as the market swings upward and continues the current rally.
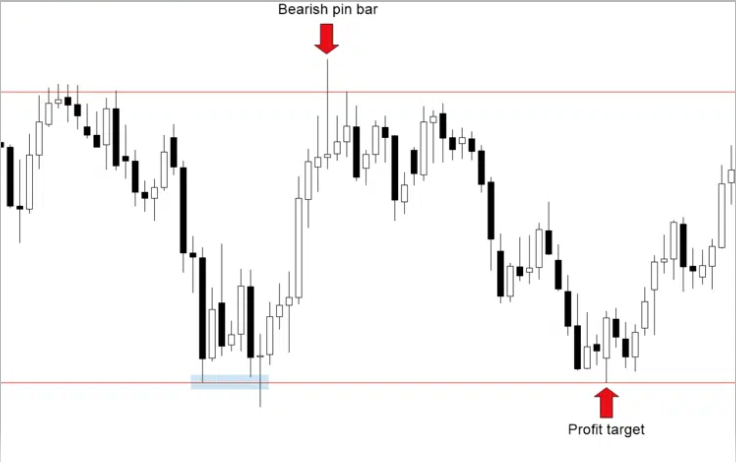
On the flip side, if the market is in a downtrend, you want to watch for sell signals from resistance.
Again, we use a signal like the pin bar to identify the swing high, also called the swing point.
Again, we use a signal like the pin bar to identify the swing high, also called the swing point.
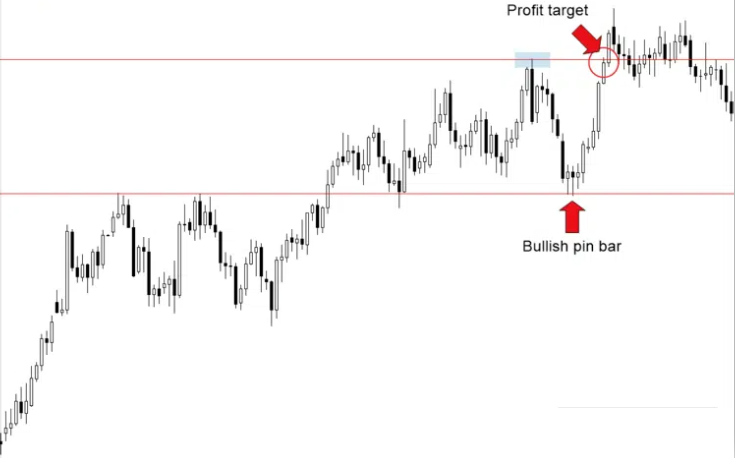
Step 5: Identify Exit Points
When it comes to finding exit points, there are two rules to follow.
The first rule is to set a profit goal and a loss limit. Many traders make the mistake of setting a goal but forgetting to set a stop loss.
When it comes to finding exit points, there are two rules to follow.
The first rule is to set a profit goal and a loss limit. Many traders make the mistake of setting a goal but forgetting to set a stop loss.
The second rule is to find these two levels before putting money at risk. This is the only time when you have no bias at all.
Simple. Just use the support and resistance levels you identified in Step 2.
Simple. Just use the support and resistance levels you identified in Step 2.
That's the wrap now!
I hope you found our content helpful and do spread the word about it.
Do Retweet the "first tweet" to help us educate traders!🙏🙏
@chartmojo @Rishikesh_ADX @BeyondTrading07 @Puretechnicals9 @PAlearner @PatilBankNifty @kuttrapali26 @KommawarSwapnil
I hope you found our content helpful and do spread the word about it.
Do Retweet the "first tweet" to help us educate traders!🙏🙏
@chartmojo @Rishikesh_ADX @BeyondTrading07 @Puretechnicals9 @PAlearner @PatilBankNifty @kuttrapali26 @KommawarSwapnil
Loading suggestions...