

2021 was the year of L1's.
As different chain ecosystems developed, users benefited from bridge projects allowing them to quickly and easily swap value between networks.
Let’s take a look at the catalysts causing users to transfer funds through bridges such as @MultichainOrg 👇
As different chain ecosystems developed, users benefited from bridge projects allowing them to quickly and easily swap value between networks.
Let’s take a look at the catalysts causing users to transfer funds through bridges such as @MultichainOrg 👇

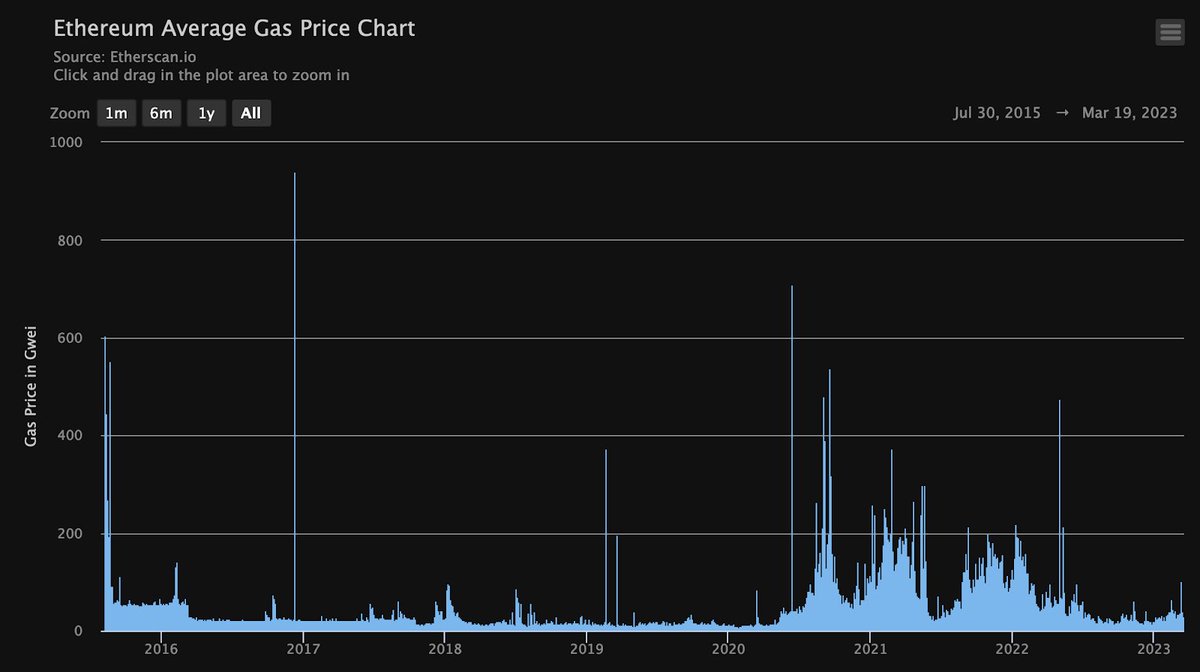
The crypto user surge over 2020-2021 increased gas prices on ETH, incentivizing many traders to search for affordable transactions on Alternative Layer 1 Blockchains (Alt-L1's).
These users were happy to trade-off decentralized architecture for speed, scalability and cheap fees.
These users were happy to trade-off decentralized architecture for speed, scalability and cheap fees.
This led them to Alt-L1's such as BNB Chain.
In early December 2021, Multichain saw a peak number of unique addresses using its service to bridge funds to BNB Chain.
This coincided with an ATH in $BNB price, with users purchasing BNB to submit transactions on the network.
In early December 2021, Multichain saw a peak number of unique addresses using its service to bridge funds to BNB Chain.
This coincided with an ATH in $BNB price, with users purchasing BNB to submit transactions on the network.
This flood of excess users led to a popular narrative forming around alternative L1’s - dubbed the L1 thesis.
Many L1 valuation models in 2021 made use of user count, number of transactions and similar usage-based statistics.
An L1 Valuation flywheel began to form.
Many L1 valuation models in 2021 made use of user count, number of transactions and similar usage-based statistics.
An L1 Valuation flywheel began to form.
Increased usage justified higher valuations, which led to more incentives for developers to launch chain-native projects.
This again attracted users to the ecosystem.
The alt-L1 thesis of 2021 motivated users to explore different blockchain ecosystems, often for the first time.
This again attracted users to the ecosystem.
The alt-L1 thesis of 2021 motivated users to explore different blockchain ecosystems, often for the first time.
However, catalysts for bridge volume are not quite as common in a bear market.
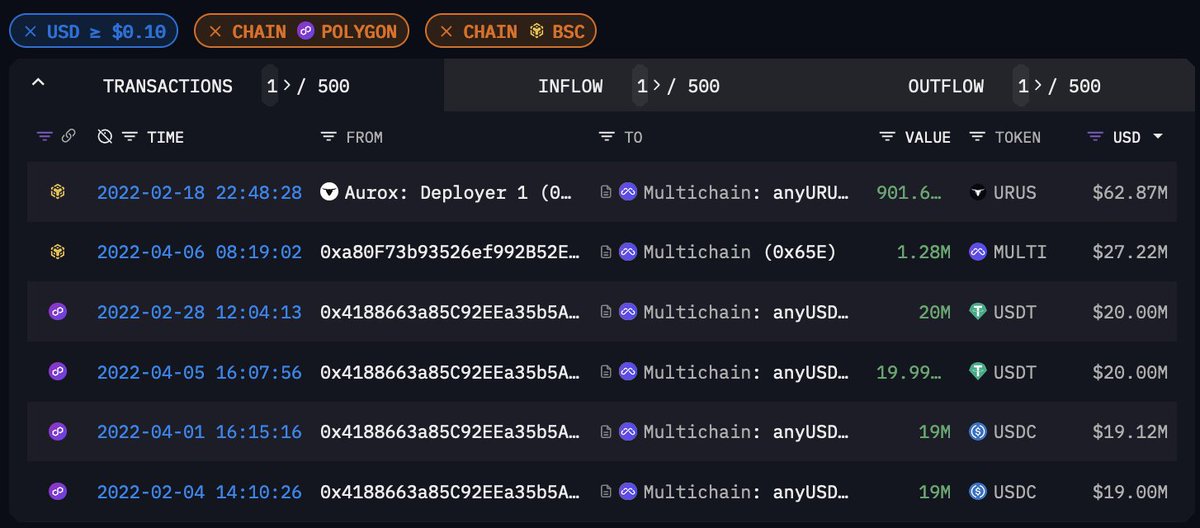
Regardless, ecosystems like Polygon and BNB Chain have seen some notable events provoking significant capital movements, with the highest single transactions being well into the 8-figure range.
Regardless, ecosystems like Polygon and BNB Chain have seen some notable events provoking significant capital movements, with the highest single transactions being well into the 8-figure range.
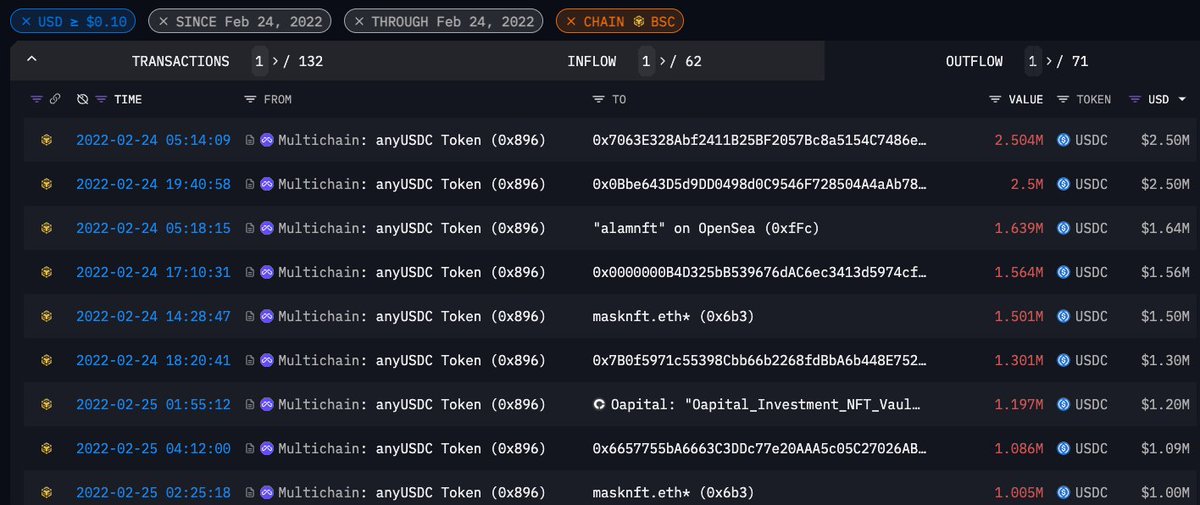
On February 24, 2022, Multichain experienced the highest bridge volume to BNB Chain it had all year.
On this same day, $BNB experienced an over 12% drop in price but closed down only 2% on the day.
The volatility on that day caused plenty of arbitrage movements between chains.
On this same day, $BNB experienced an over 12% drop in price but closed down only 2% on the day.
The volatility on that day caused plenty of arbitrage movements between chains.
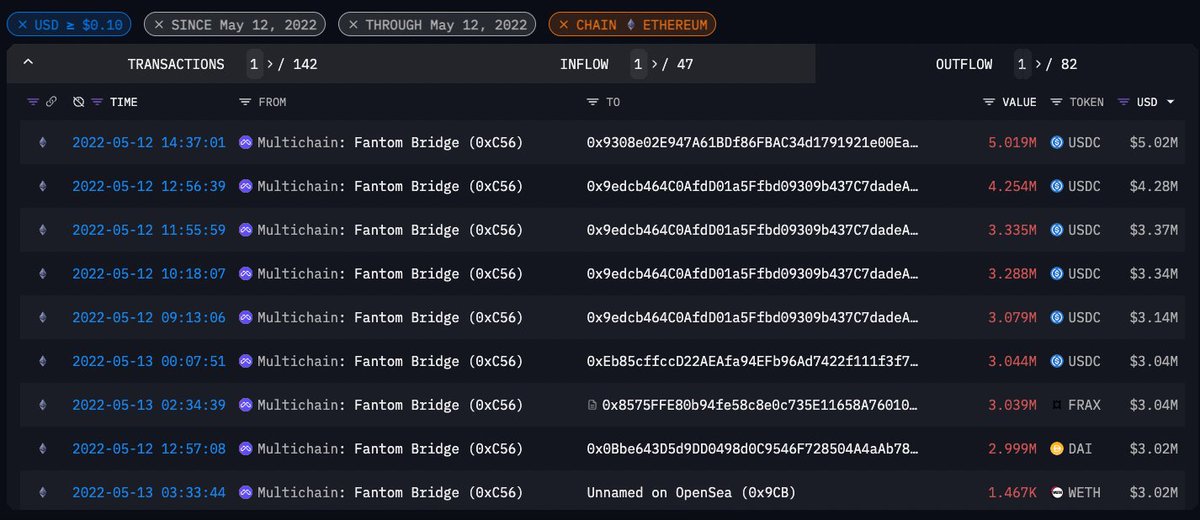
On May 12, 2022, Luna's collapse began. As a result, Multichain experienced a massive uptick in volume as over $221M was sent to Ethereum via their bridge.
As before, most of this volume was in stablecoins, with participants seemingly attempting to flee risk.
As before, most of this volume was in stablecoins, with participants seemingly attempting to flee risk.
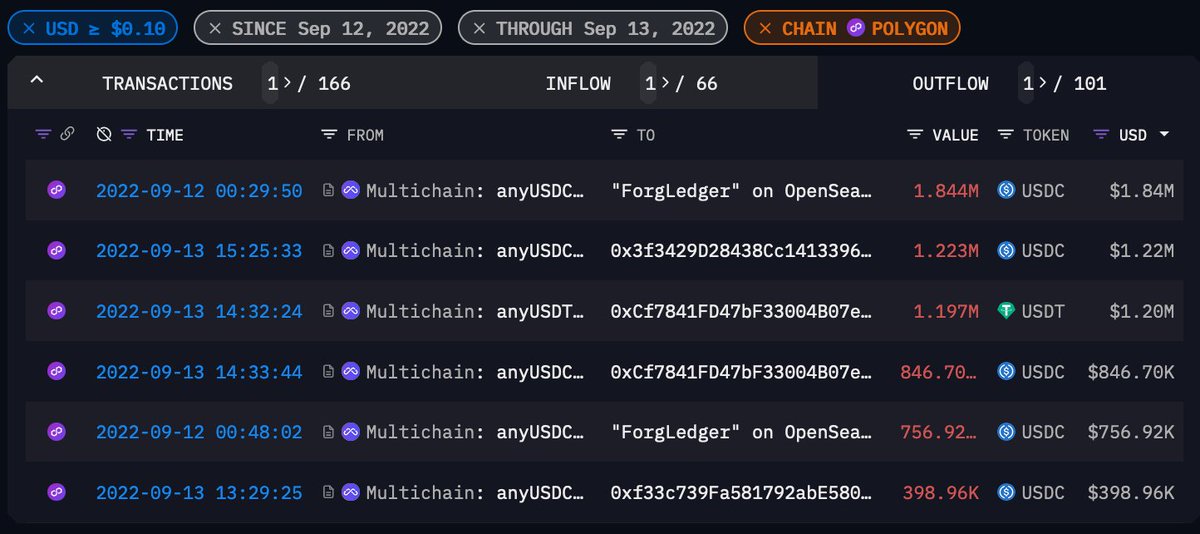
On September 12, 2022, Polygon announced a partnership with Starbucks.
Shortly after the announcement, Multichain saw its Polygon bridge daily volume increase from ~$3M to a peak of nearly $10M.
2 transactions alone on the 13th September constituted the prior daily volume ($3M)
Shortly after the announcement, Multichain saw its Polygon bridge daily volume increase from ~$3M to a peak of nearly $10M.
2 transactions alone on the 13th September constituted the prior daily volume ($3M)
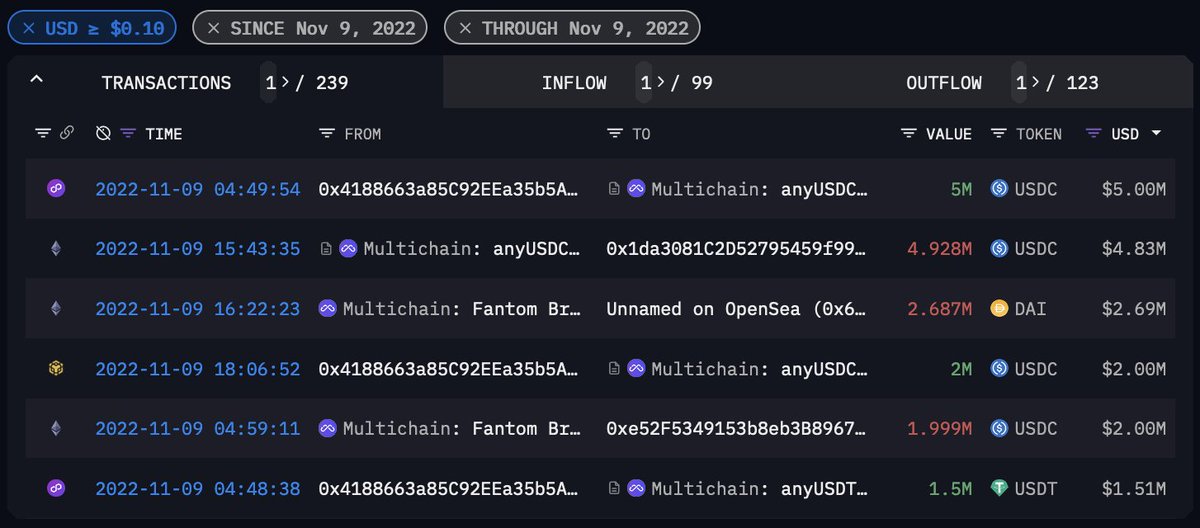
Predictably, Multichain saw high volume on many of the most volatile days in crypto, such as Nov 9, 2022, at the beginning of the FTX collapse.
Other days provide an interesting glimpse behind the curtain of large firms and projects.
Other days provide an interesting glimpse behind the curtain of large firms and projects.
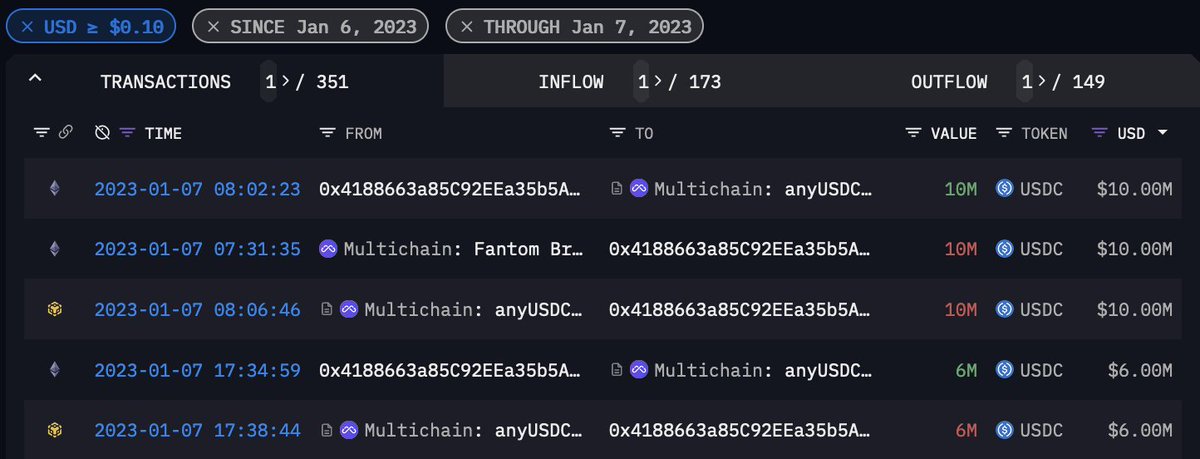
On Jan 7, 2023, Multichain facilitated large transfers of MIM across chains for both Abracadabra (the makers of MIM) and Alameda Research.
Interestingly, the day of Jan 7 saw high volume on Multichain in both dollar value and unique users.
Interestingly, the day of Jan 7 saw high volume on Multichain in both dollar value and unique users.
Keeping an eye on bridge volume yields many valuable insights, indicating important market events or long-term trends.
Arkham labels important entities so users can see which actors are moving value cross-chain.
Make sure to set those Arkham alerts for bridges like Multichain.
Arkham labels important entities so users can see which actors are moving value cross-chain.
Make sure to set those Arkham alerts for bridges like Multichain.
We hope you enjoyed this thread on @MultichainOrg and how analyzing bridge volume can provide market insights.
For more discussion and analysis, join our discord!
discord.gg
For more discussion and analysis, join our discord!
discord.gg
Loading suggestions...