

Relying on hope and predictions is the perfect recipe for a financial disaster.
If you want to become profitable, you need to work step by step.
So here is my framework on how you can evaluate the market using a level-by-level approach and set realistic targets.
🧵👇1/23.
If you want to become profitable, you need to work step by step.
So here is my framework on how you can evaluate the market using a level-by-level approach and set realistic targets.
🧵👇1/23.
1.
Forget everything you learned from common influencers.
Profitability isn't based on hope, but on a solid plan.
In this thread I’ll show you how I evaluate the market using key points.
Little talk, let's get started.
Forget everything you learned from common influencers.
Profitability isn't based on hope, but on a solid plan.
In this thread I’ll show you how I evaluate the market using key points.
Little talk, let's get started.
2.
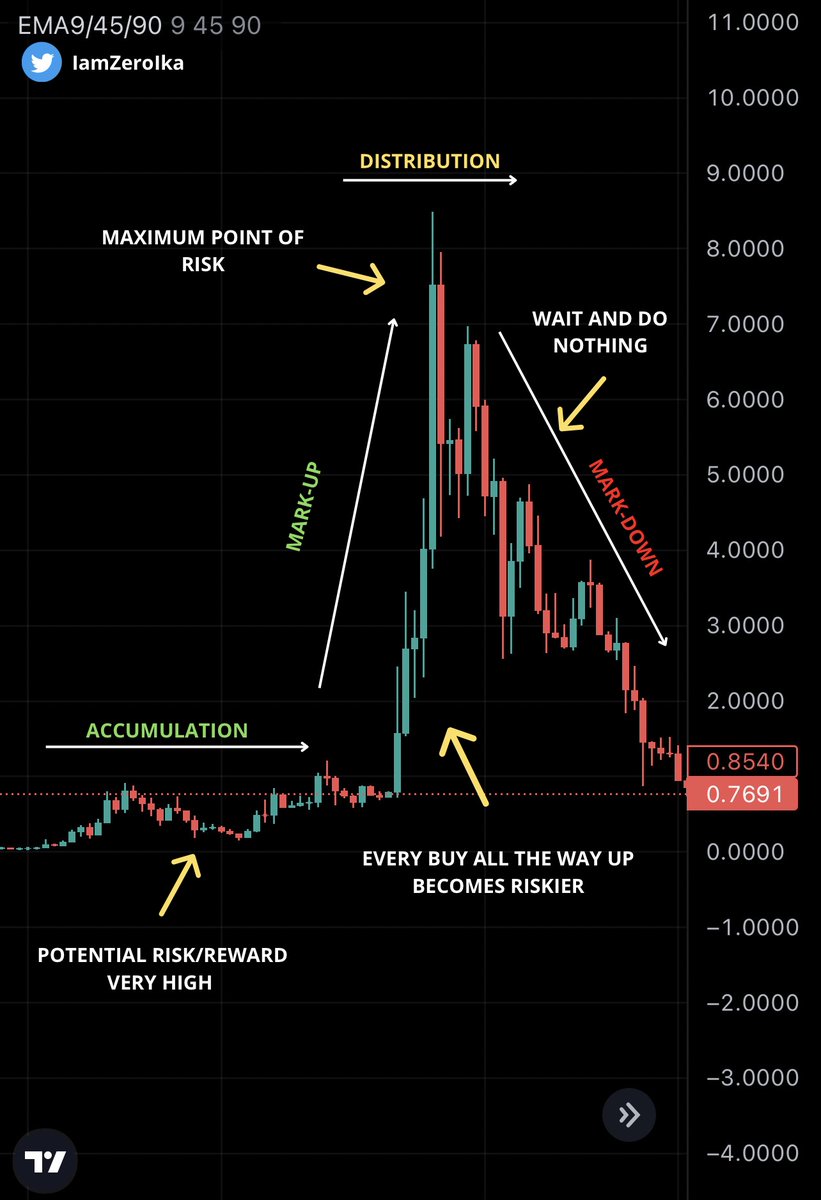
♦️Market structure.
Understanding market structure is key.
You saw me plenty of times posting this chart because it is highly effective.
It doesn't matter the asset you want to buy, all of your investment decisions must be adapted to the charts.
♦️Market structure.
Understanding market structure is key.
You saw me plenty of times posting this chart because it is highly effective.
It doesn't matter the asset you want to buy, all of your investment decisions must be adapted to the charts.
3.
If you're buying during the accumulation zone the risk (if the asset is strong) is very low and the reward is very high.
During the markup you'll know that you're already too late to deploy capital and every buy will be riskier.
Better wait for a new opportunity.
If you're buying during the accumulation zone the risk (if the asset is strong) is very low and the reward is very high.
During the markup you'll know that you're already too late to deploy capital and every buy will be riskier.
Better wait for a new opportunity.
4.
This chart is valid because I'm not a day trader, I take long-term positions so the structure can be identified on high timeframes.
It is not useful if you're planning to day-trade or scalp.
Every strategy must be adapted to our goals/time horizons.
This chart is valid because I'm not a day trader, I take long-term positions so the structure can be identified on high timeframes.
It is not useful if you're planning to day-trade or scalp.
Every strategy must be adapted to our goals/time horizons.
5.
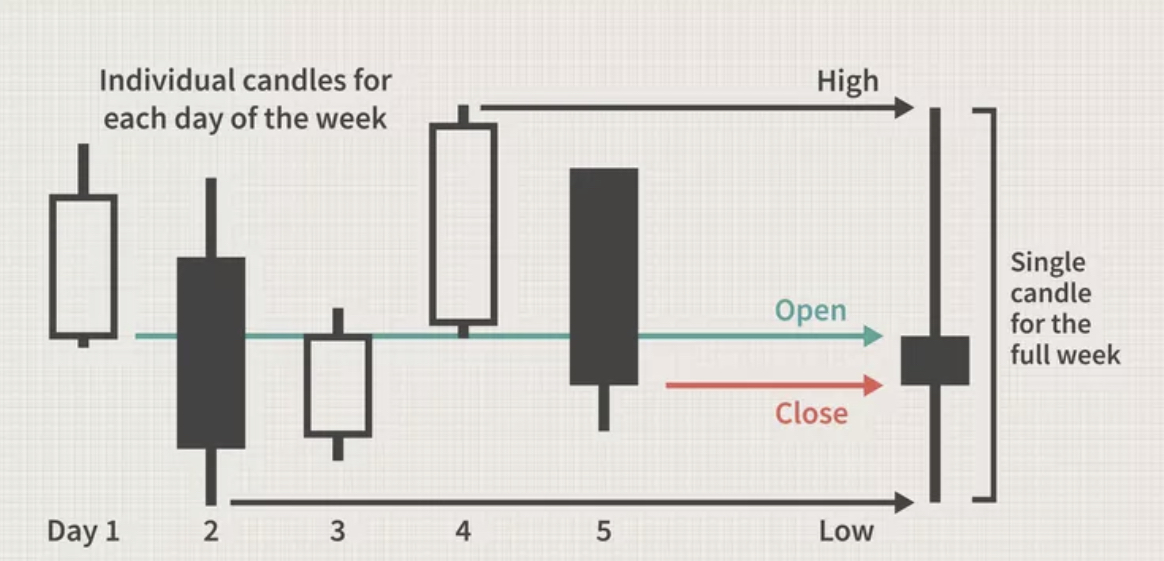
♦️Weekly-monthly closes.
On a weekly chart, each candle represents the price summary for a single week of trading, same applies to the monthly.
They can therefore give us a better overlook of which is the potential trend ongoing.
♦️Weekly-monthly closes.
On a weekly chart, each candle represents the price summary for a single week of trading, same applies to the monthly.
They can therefore give us a better overlook of which is the potential trend ongoing.
6.
There is a lot to say and many indicators could be applied to weekly/monthly closes but will summarize by giving you an easy hint.
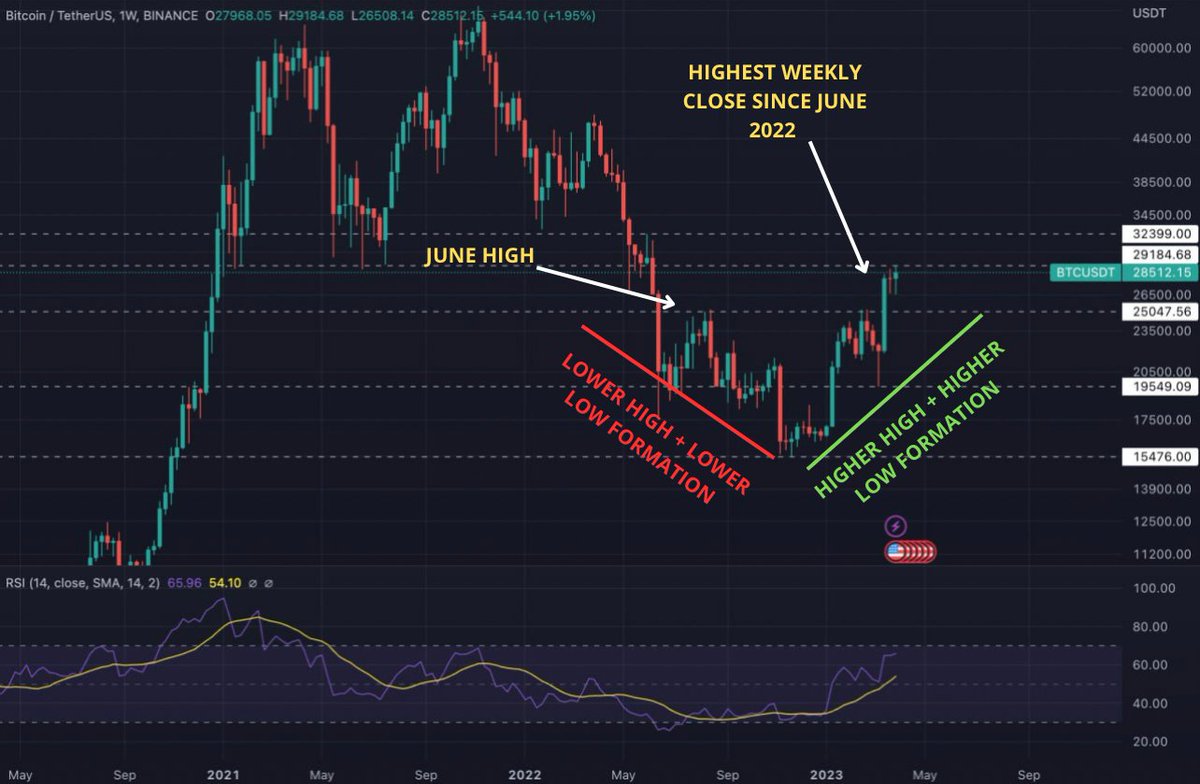
To evaluate the potential strength/weakness of a trend, look for weekly/monthly closes above/below past high/resistances.
There is a lot to say and many indicators could be applied to weekly/monthly closes but will summarize by giving you an easy hint.
To evaluate the potential strength/weakness of a trend, look for weekly/monthly closes above/below past high/resistances.
7.
Dotted lines are support & resistance.
As you can see the latest weekly candle has closed above the 2022 June high and the trend formed is an HH+HL, bullish.
Remember: the trend is your friend until the end.
Weekly starts to close lower than the last one?
Be careful.
Dotted lines are support & resistance.
As you can see the latest weekly candle has closed above the 2022 June high and the trend formed is an HH+HL, bullish.
Remember: the trend is your friend until the end.
Weekly starts to close lower than the last one?
Be careful.
8.
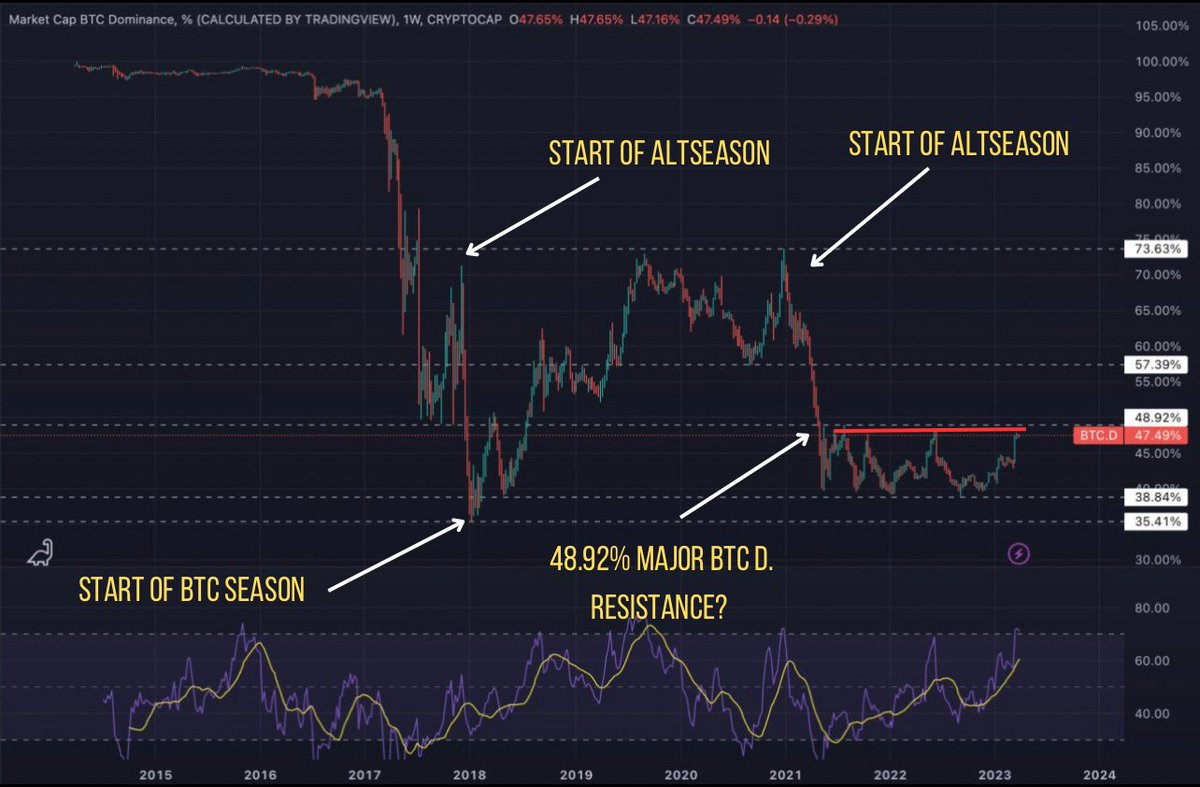
♦️BTC dominance.
Looking at Bitcoin dominance is a great indicator to gauge strength/weakness in the altcoin market.
Simplified:
• BTC D. going up 👉 my altcoin exposure reduces.
• BTC D. going down 👉 my altcoin exposure increases.
That's how I basically play the market
♦️BTC dominance.
Looking at Bitcoin dominance is a great indicator to gauge strength/weakness in the altcoin market.
Simplified:
• BTC D. going up 👉 my altcoin exposure reduces.
• BTC D. going down 👉 my altcoin exposure increases.
That's how I basically play the market
9.
In the red zone, I highlighted the 48.92% resistance.
If BTC breaks this strong resistance, then it will be a full BTC season and the risk on altcoins will decrease.
On the contrary, a rejection could ignite some bullish price action in the altcoin market.
In the red zone, I highlighted the 48.92% resistance.
If BTC breaks this strong resistance, then it will be a full BTC season and the risk on altcoins will decrease.
On the contrary, a rejection could ignite some bullish price action in the altcoin market.
10.
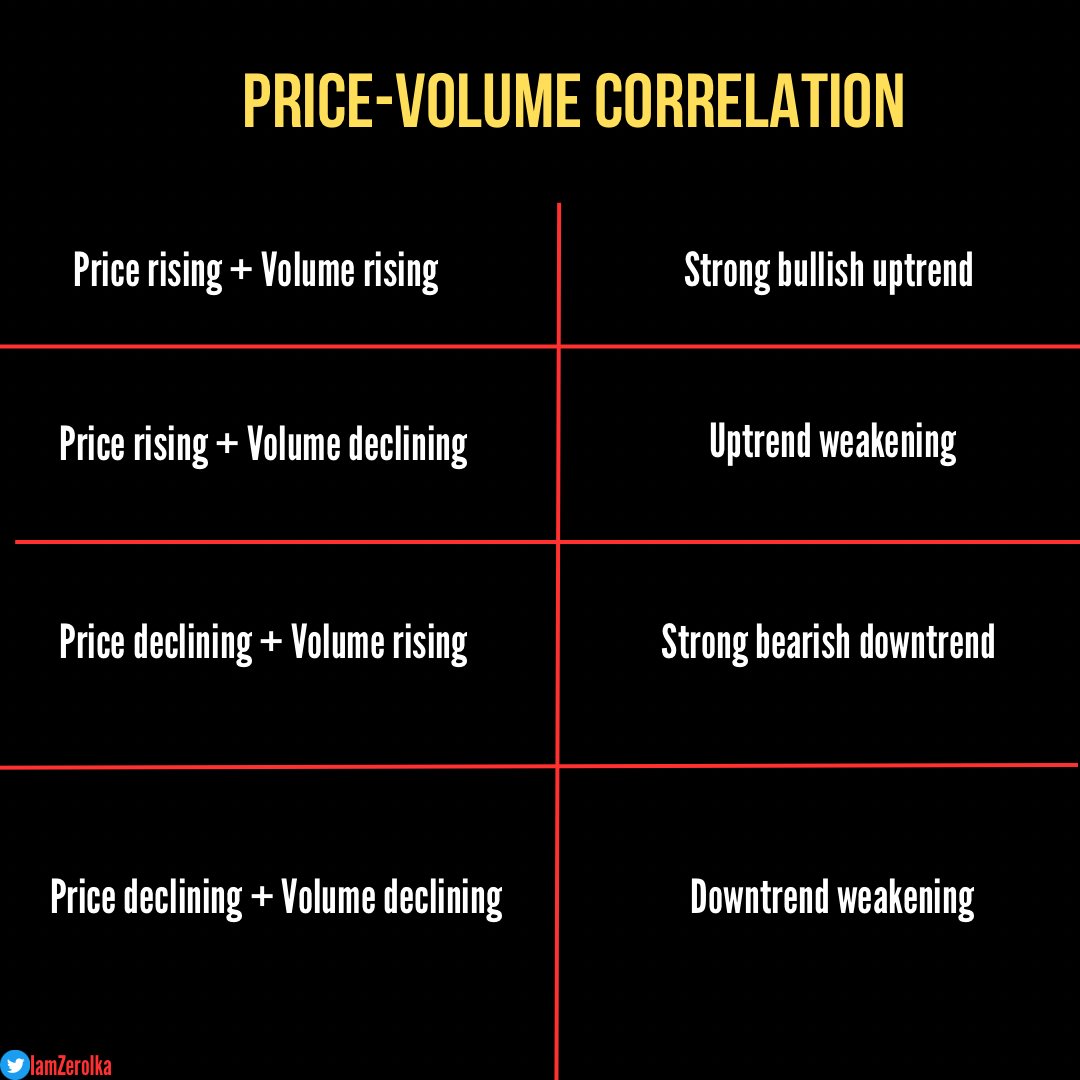
♦️Volumes.
To have a better overlook I also check the volumes implicated in a trend.
Take note that this is not an iron statement, there are cases in which the volumes have misled the price action that continued to develop following the trend.
♦️Volumes.
To have a better overlook I also check the volumes implicated in a trend.
Take note that this is not an iron statement, there are cases in which the volumes have misled the price action that continued to develop following the trend.
11.
But in general, it can be a very helpful indicator.
During the last markdown (69k-16k) the selling pressure was very heavy showing a positive correlation with the volumes.
That's why after looking at the PA, volumes come next, to me.
But in general, it can be a very helpful indicator.
During the last markdown (69k-16k) the selling pressure was very heavy showing a positive correlation with the volumes.
That's why after looking at the PA, volumes come next, to me.
12.
♦️ Setting realistic targets.
Bad influencers and echo chambers are 2 of your worst enemies.
“If this happens, Bitcoin will turbo run to 150/200k, you're not prepared!”
This is a clear example of how they mislead you so you'll rely on hope and not a solid plan.
♦️ Setting realistic targets.
Bad influencers and echo chambers are 2 of your worst enemies.
“If this happens, Bitcoin will turbo run to 150/200k, you're not prepared!”
This is a clear example of how they mislead you so you'll rely on hope and not a solid plan.
13.
So what does it means setting realistic targets?
Many coins that have ran hard in the past will never break their ATH ever again.
There are too many factors: hype goes down, projects get abandoned, bad tokenomics..
That's the reality, whether you like it or not.
So what does it means setting realistic targets?
Many coins that have ran hard in the past will never break their ATH ever again.
There are too many factors: hype goes down, projects get abandoned, bad tokenomics..
That's the reality, whether you like it or not.
14.
Being realistic means:
• Buying as much low as you can (so you'll not need ATH to make gains).
• Selling all the way up based on resistance levels.
• Accept that coins are just coins, your project might be here now and not here in 2 years.
Being realistic means:
• Buying as much low as you can (so you'll not need ATH to make gains).
• Selling all the way up based on resistance levels.
• Accept that coins are just coins, your project might be here now and not here in 2 years.
15.
• Case study: MATIC.
Let's suppose you both MATIC in the 0.60$/1$ range.
After testing and getting rejected by the resistance the first time, it broke it up starting a small uptrend.
The plan:
• Sell after the break.
• Continue to sell at November high + eventual break.
• Case study: MATIC.
Let's suppose you both MATIC in the 0.60$/1$ range.
After testing and getting rejected by the resistance the first time, it broke it up starting a small uptrend.
The plan:
• Sell after the break.
• Continue to sell at November high + eventual break.
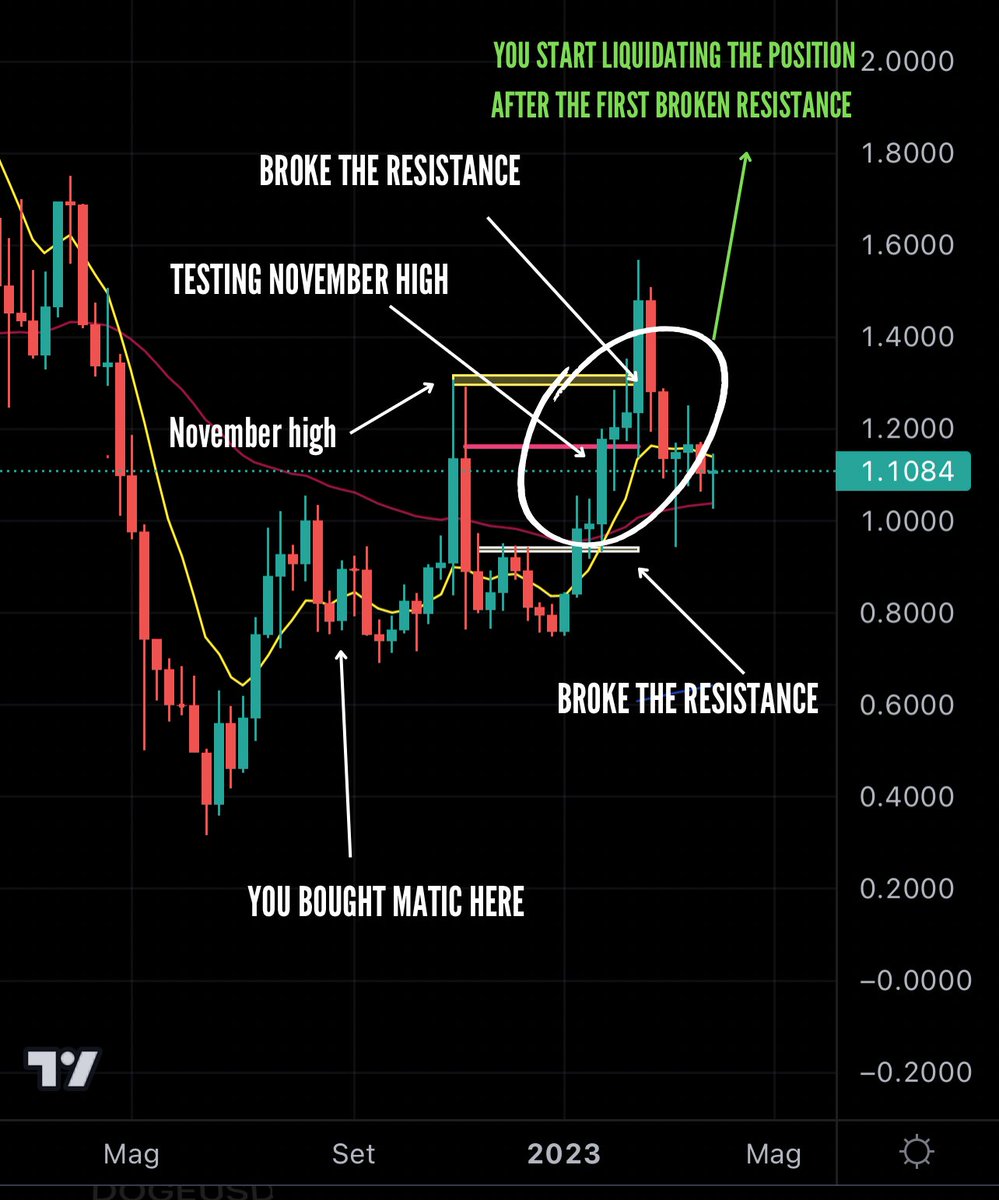
16.
This concept applies to every asset allowing you to not “hope” but to have fixed targets.
You'll start to care less about ATH and you'll be more focused on levels.
Support & resistance becomes a key strategy for your plan.
This concept applies to every asset allowing you to not “hope” but to have fixed targets.
You'll start to care less about ATH and you'll be more focused on levels.
Support & resistance becomes a key strategy for your plan.
17.
♦️Key takeaways.
• ATH break.
If an asset breaks its previous high this might be considered a strong one but it also becomes riskier (everyone wants to buy it).
Holding a position in ATH?
Shave off the profits aggressively, if you don't do it, someone else will.
♦️Key takeaways.
• ATH break.
If an asset breaks its previous high this might be considered a strong one but it also becomes riskier (everyone wants to buy it).
Holding a position in ATH?
Shave off the profits aggressively, if you don't do it, someone else will.
18.
• ATH illusion.
You need to realize that all-time highs are just a bonus, not the end goal.
The eco-chamber created by influencers forces you to HODL until ATH as it must happen.
But this is not a rule.
It might happen..what if not?
• ATH illusion.
You need to realize that all-time highs are just a bonus, not the end goal.
The eco-chamber created by influencers forces you to HODL until ATH as it must happen.
But this is not a rule.
It might happen..what if not?
19.
• Be grateful.
Be grateful for what the market provides you.
Remember that there is no financial market that gives you 20/30% in one day.
When the moment comes, make it count and sell.
Little profits step by step compound into bigger ones one day.
• Be grateful.
Be grateful for what the market provides you.
Remember that there is no financial market that gives you 20/30% in one day.
When the moment comes, make it count and sell.
Little profits step by step compound into bigger ones one day.
20.
• Evaluate the market level by level.
Look for.
• Daily close.
• Weekly close.
• Monthly close.
The strongest the closes above resistance, the better it will be for the market.
Bad weekly closure?
You can start to be more careful.
• Evaluate the market level by level.
Look for.
• Daily close.
• Weekly close.
• Monthly close.
The strongest the closes above resistance, the better it will be for the market.
Bad weekly closure?
You can start to be more careful.
21.
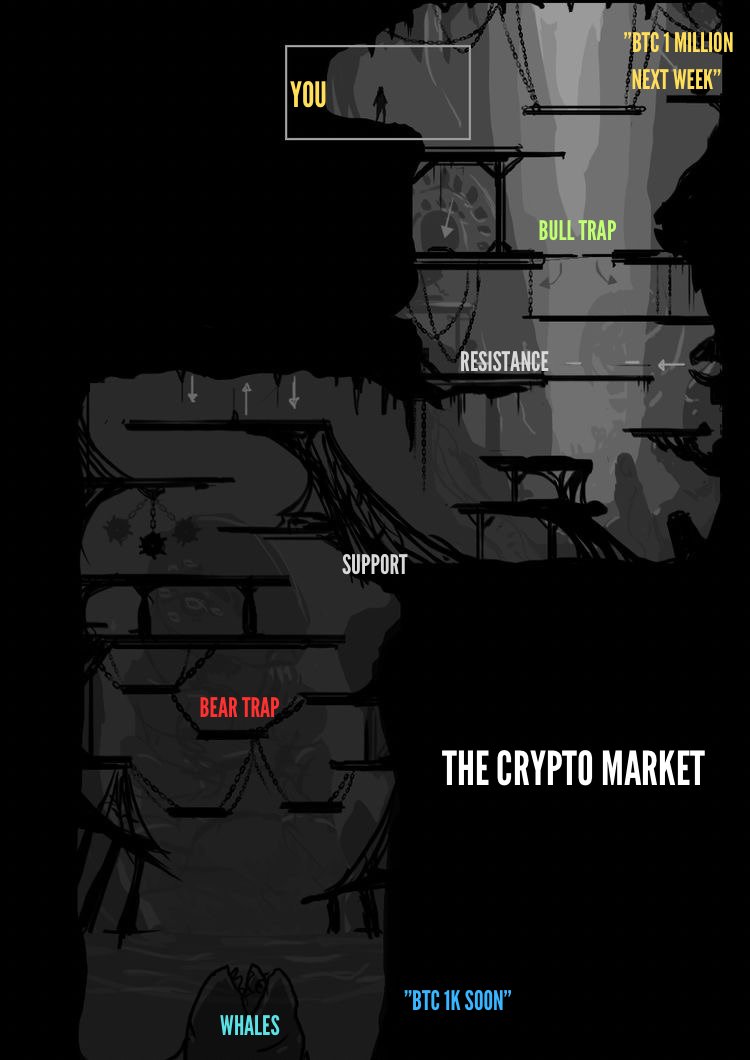
• Say bye-bye to fairytales.
As said, during your journey you'll find unrealistic price predictions both for the upside and the downside.
“BTC to 200k soon!”
“BTC is a ponzi, 2k incoming!”
These are just bullshits that print you an emotional condition.
Be cold as ice.
• Say bye-bye to fairytales.
As said, during your journey you'll find unrealistic price predictions both for the upside and the downside.
“BTC to 200k soon!”
“BTC is a ponzi, 2k incoming!”
These are just bullshits that print you an emotional condition.
Be cold as ice.
22.
There is a lot to cover in trading but I hope that this can give you a better idea of what you have to do.
If you want to have another boost of knowledge I made a TA plan with simple concepts.
There is a lot to cover in trading but I hope that this can give you a better idea of what you have to do.
If you want to have another boost of knowledge I made a TA plan with simple concepts.
23.
That's it!
• If you liked this thread follow me @IamZeroIka for more crypto insights.
• Want to have access to deeper guides?
Subscribe to my FREE newsletter!👇
extensivevision.substack.com
That's it!
• If you liked this thread follow me @IamZeroIka for more crypto insights.
• Want to have access to deeper guides?
Subscribe to my FREE newsletter!👇
extensivevision.substack.com
Loading suggestions...