

Thread on Power of 3 (PO3) / Accumulation, Manipulation, Distribution (AMD)🧵
♥️&🧵
♥️&🧵

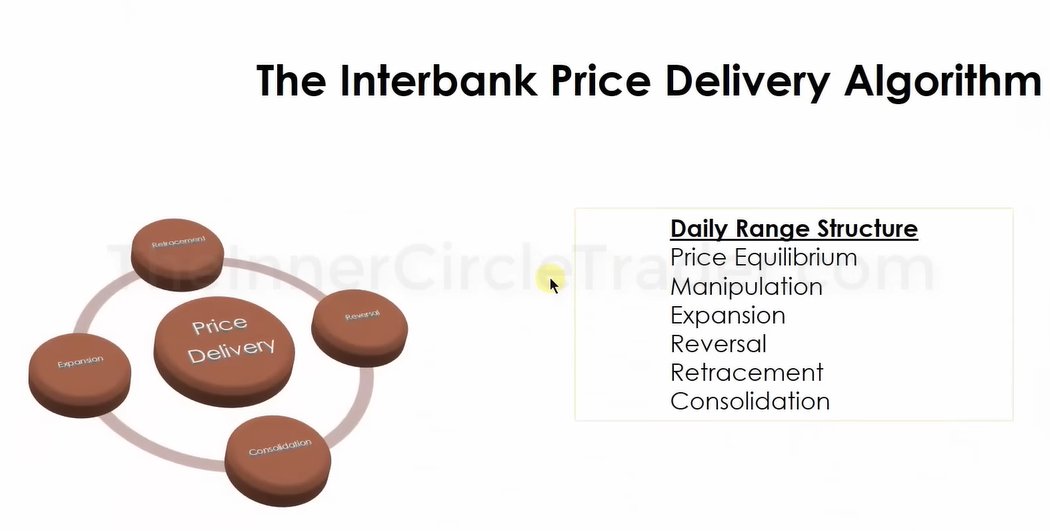
PO3 & AMD is the same thing and this can happen on every timeframe as long as a candlestick chart can be shown. Me personally, I like applying this to the HTF such as H1, D, W, M timeframes.
There are 3 parts to PO3-accumulation, manipulation, and distribution. Accumulation will be a consolidation period on the chart usually near the opening price. Manipulation is the juda swing which is the fake move. Distribution is the expansion period which is the real move.
The Interbank Price Delivery Algorithm moves from consolidation periods to expansion periods and in-between these two periods manipulation will happen to take out retail buy or sell stops before the real expansion move.

After an expansion move, there will either be a retracement in price or a reversal. It can never go from consolidation straight into a reversal, never consolidation straight into a retracement, and never expansion straight into consolidation.
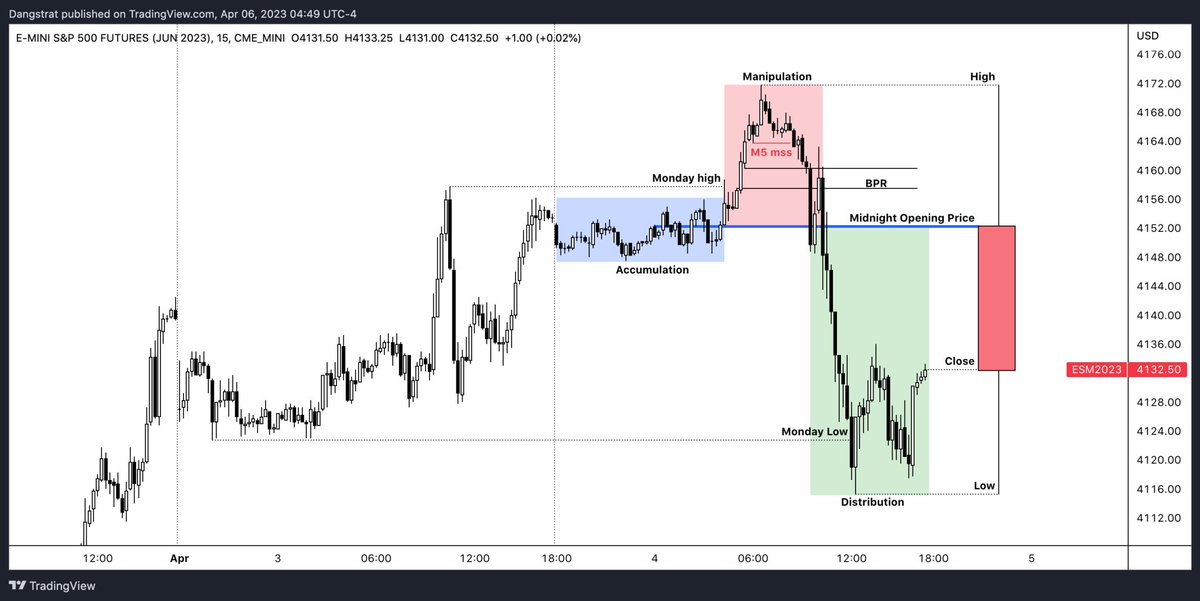
Now for PO3/AMD I will use the OLHC/OHLC on the daily timeframe as an example because this is the timeframe I refer to the most. You want to see consolidation/accumulation occur near the midnight opening price. Blue boxes = consolidation/accumulation


If bullish then you're looking for manipulation to happen under the midnight opening price and if bearish you're looking for manipulation to happen above the midnight opening price. When manipulation occurs, this is where smart money is accumulating short/long positions.
To confirm the manipulation move you need to see a market structure shift & price needs to get back and stay above or below the midnight opening price depending if it's bullish or bearish. Red boxes = Manipulation
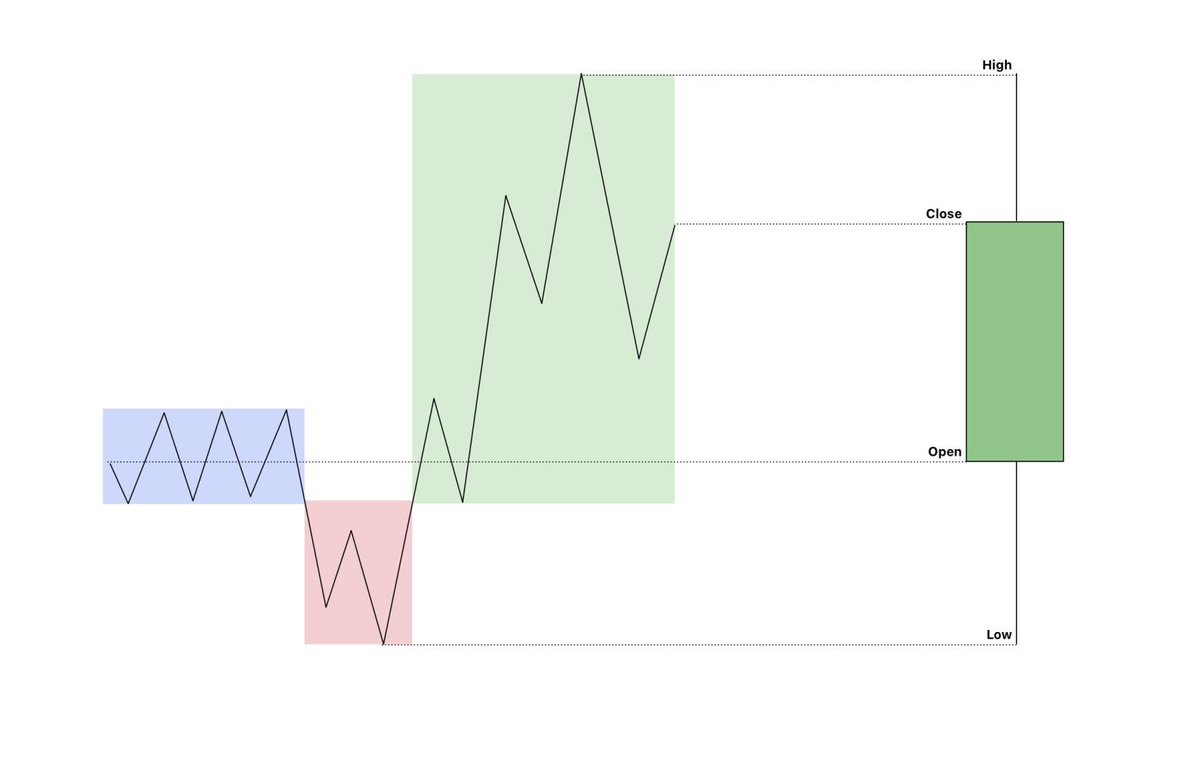
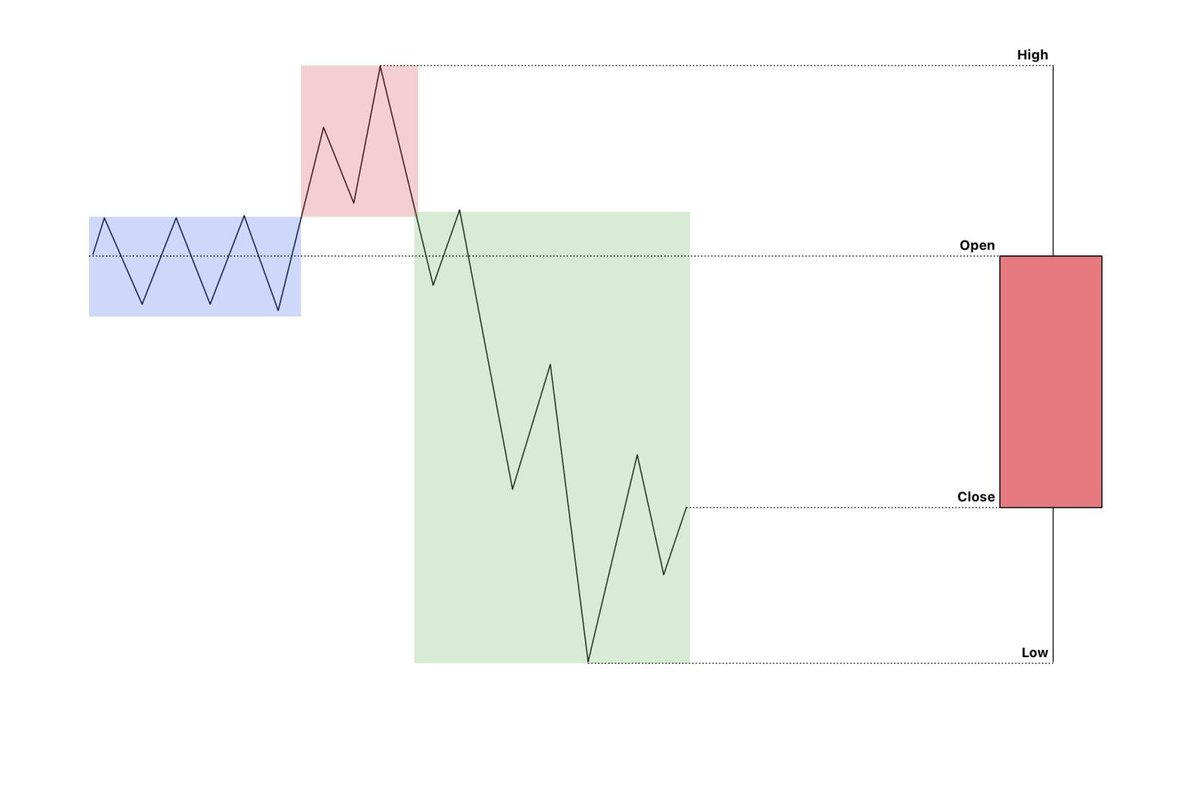
Once price is back below or above the midnight opening price you can expect distribution/expansion move to the next draw on liquidity. Green Boxes = Distribution/Expansion


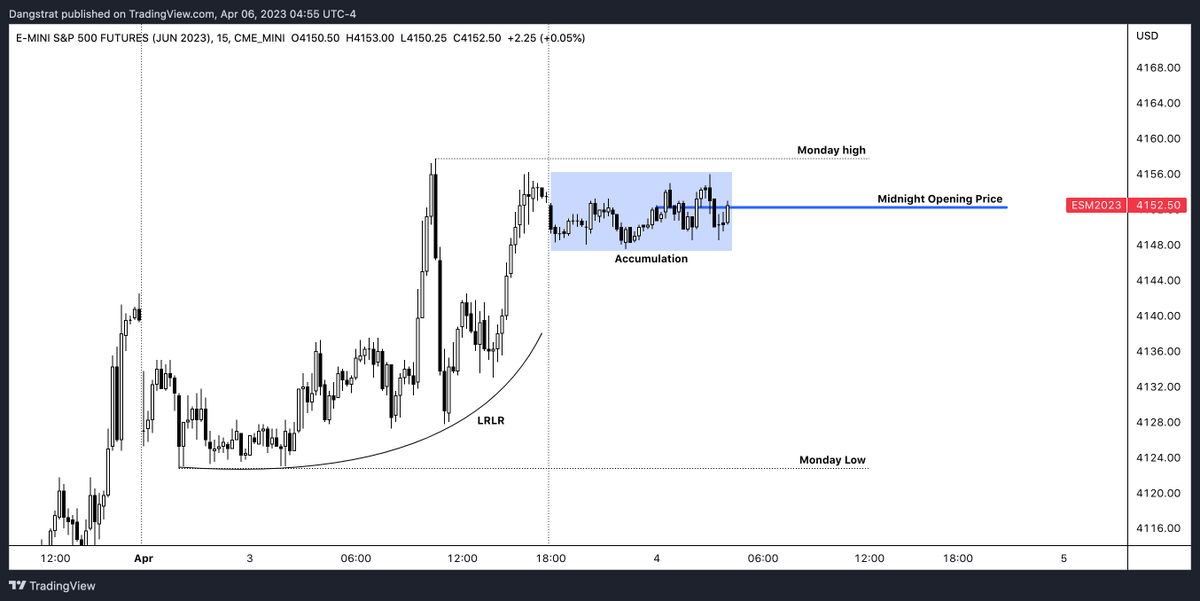
Here is an example on $ES earlier this week. It starts with accumulation at the midnight opening price just under Monday high. Because we have a LRLR & EQL at Monday low we could anticipate that Monday low could potentially be the next draw on liquidity.
More on Draw on Liquidity
Because we are expecting expansion to Monday Low as DOL we want to see manipulation happen above the Midnight Opening Price (MOP). Price then takes out PDH (Monday High) and then you get an M5 mss + M15 BPR where shorts are being accumulated and then price goes back below MOP.
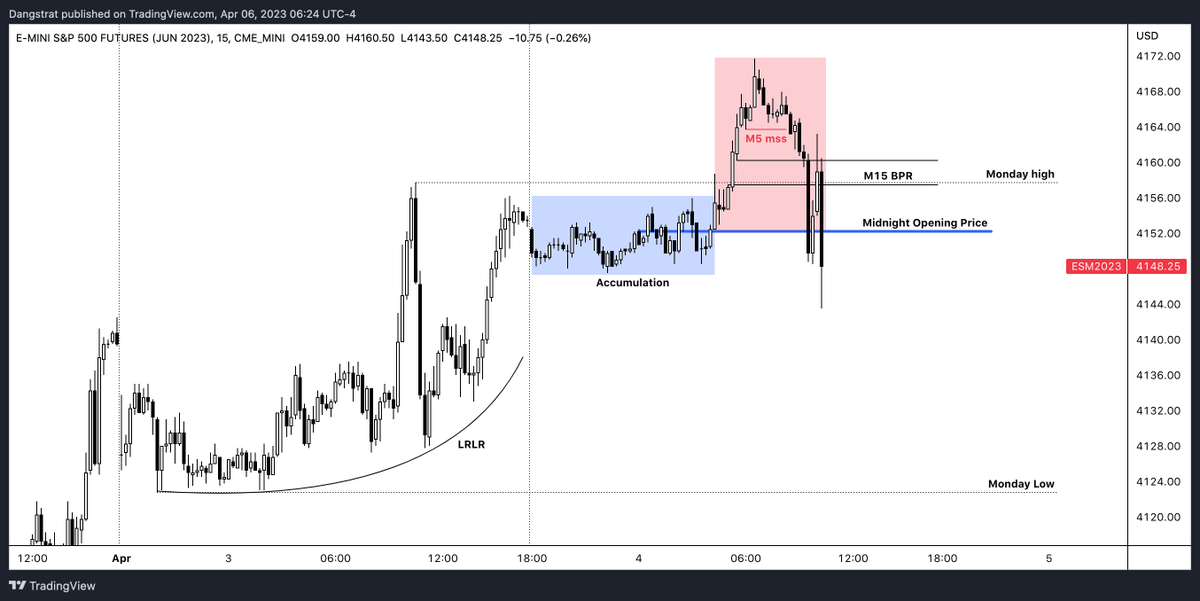
Now that price is back below MOP, we have confirmation that it's manipulation and now we can look for distribution/expansion to downside to target the DOL which was Monday low.
Again, PO3/AMD can occur on any timeframe whether it's M5, M15, H1, D, W, or on the Monthly chart, it doesn't matter. What matters is that it all starts from the opening price of the candlestick chart.
After the opening price look for a high or low to form above/below the opening price. Once price gets back below/above the opening price this creates a wick which represents manipulation (smart money accumulation of shorts/longs) in price. This is where liquidity is engineered.
Once price is back below/above the opening price you can now look for price to expand towards the draw on liquidity to create the body of the candle. You don't need to catch the entire move to be profitable. All you need is a slice of the cake.
Here is my Linktree to become a Lifetime or Gold Member! Join our Discord Community to grow as traders, share trade ideas, and see price action how I see it. Sign up for Lifetime Membership to get my trade signals. linktr.ee
If you want to improve your discipline & trading edge you can purchase my Trading Journal Template to easily track all of your trades! dangstratify.gumroad.com
If this thread helped, please like and retweet for more educational content and for others to see! Thank you🧡
Loading suggestions...