

Like Support/Resistance, Candlestick Patterns are an important aspect of Technical analysis.
A 🧵for those seeking Candlestick knowledge:
(1/22)
A 🧵for those seeking Candlestick knowledge:
(1/22)
There are different kinds of chart patterns Line, bar chart and Candlestick. Candlestick Patterns are used because they display the OHLC - Open, high, low and closing price of security. Candlestick originated from Japan that's why we call it Japanese Candlestick Patterns. (2/22)
When the price reaches at a support/resistance we need some confirmation that price will go up or down from here to initiate a trade. For that confirmation, we use candlestick patterns which helps us initiate a trade. (3/22)
Candlestick can be classified as:
Bullish - If closing price is higher than opening price.
Bearish - If closing price is lower than opening price.
A candle has three components
Body
Upper shadow
Lower shadow
(4/22)
Bullish - If closing price is higher than opening price.
Bearish - If closing price is lower than opening price.
A candle has three components
Body
Upper shadow
Lower shadow
(4/22)
Single candlestick pattern-
A pattern that is generated by single candle is termed as single candlestick pattern. There are different types of single candlestick. We will understand one by one and it's context. Let's first understand the bullish candlestick patterns. (5/22)
A pattern that is generated by single candle is termed as single candlestick pattern. There are different types of single candlestick. We will understand one by one and it's context. Let's first understand the bullish candlestick patterns. (5/22)
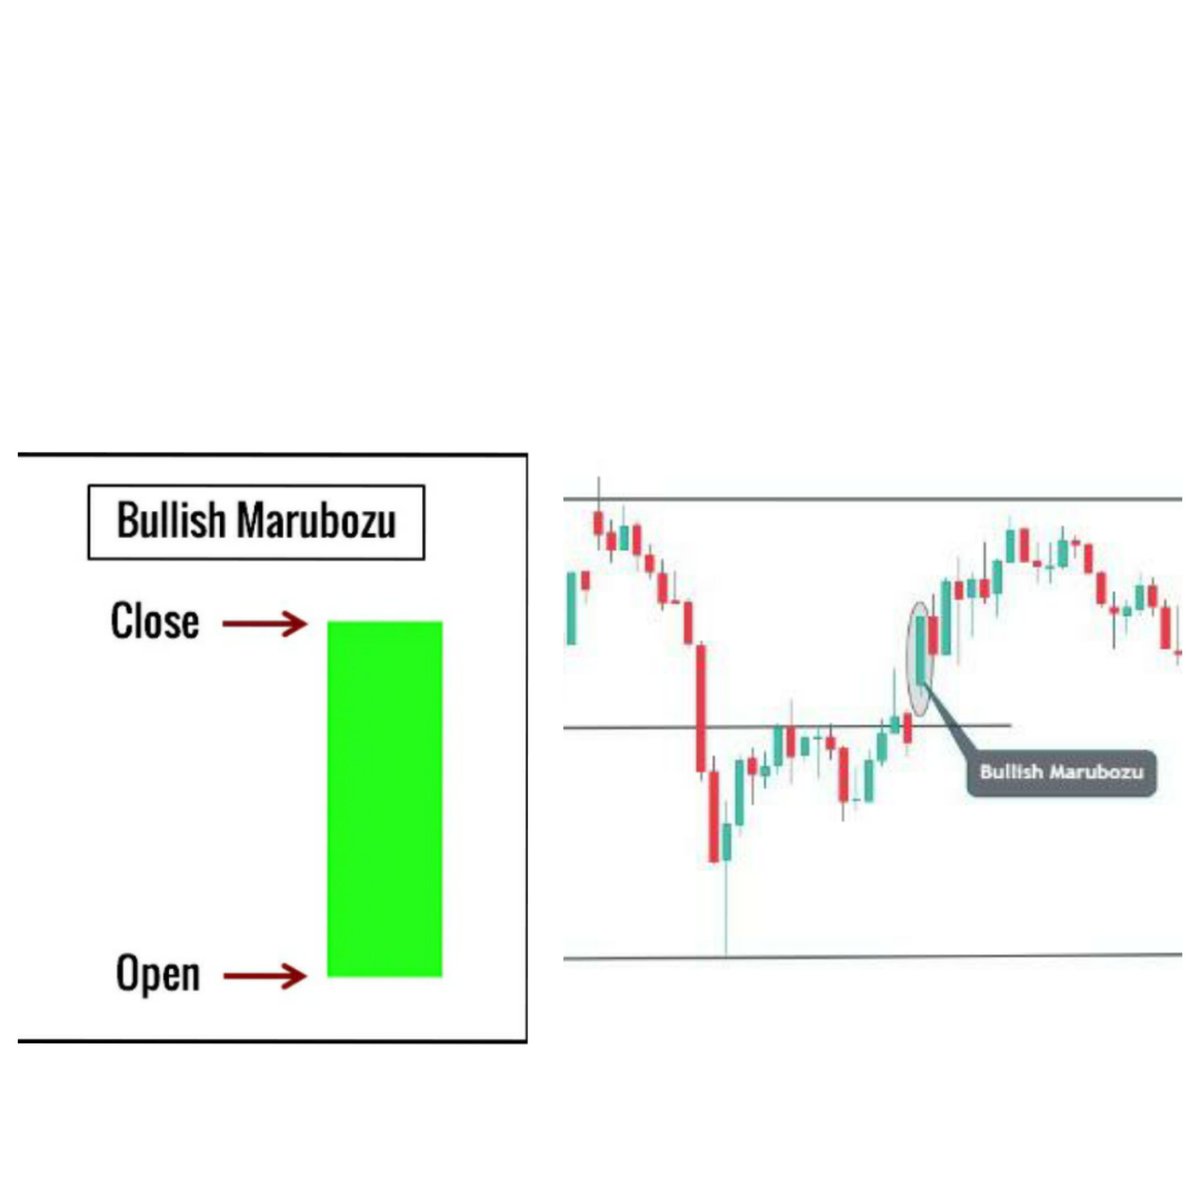
1. Bullish Marubozu
This is big bullish candle without any shadow
open = low, high = close
Location is important. If it forms exactly at support or near support, then it indicates buying.
If it forms "exactly at the resistance", then it could be a trap. (6/22)
This is big bullish candle without any shadow
open = low, high = close
Location is important. If it forms exactly at support or near support, then it indicates buying.
If it forms "exactly at the resistance", then it could be a trap. (6/22)
2. Bullish Hammer/Pinbar
• It has a body with a long wick. If this forms at a support or at the bottom of downtrend, then it indicates a buying signal. It's a significant pattern. The longer the lower shadow is, stronger is the bullish pattern. (7/22)
• It has a body with a long wick. If this forms at a support or at the bottom of downtrend, then it indicates a buying signal. It's a significant pattern. The longer the lower shadow is, stronger is the bullish pattern. (7/22)

Bearish Patterns -
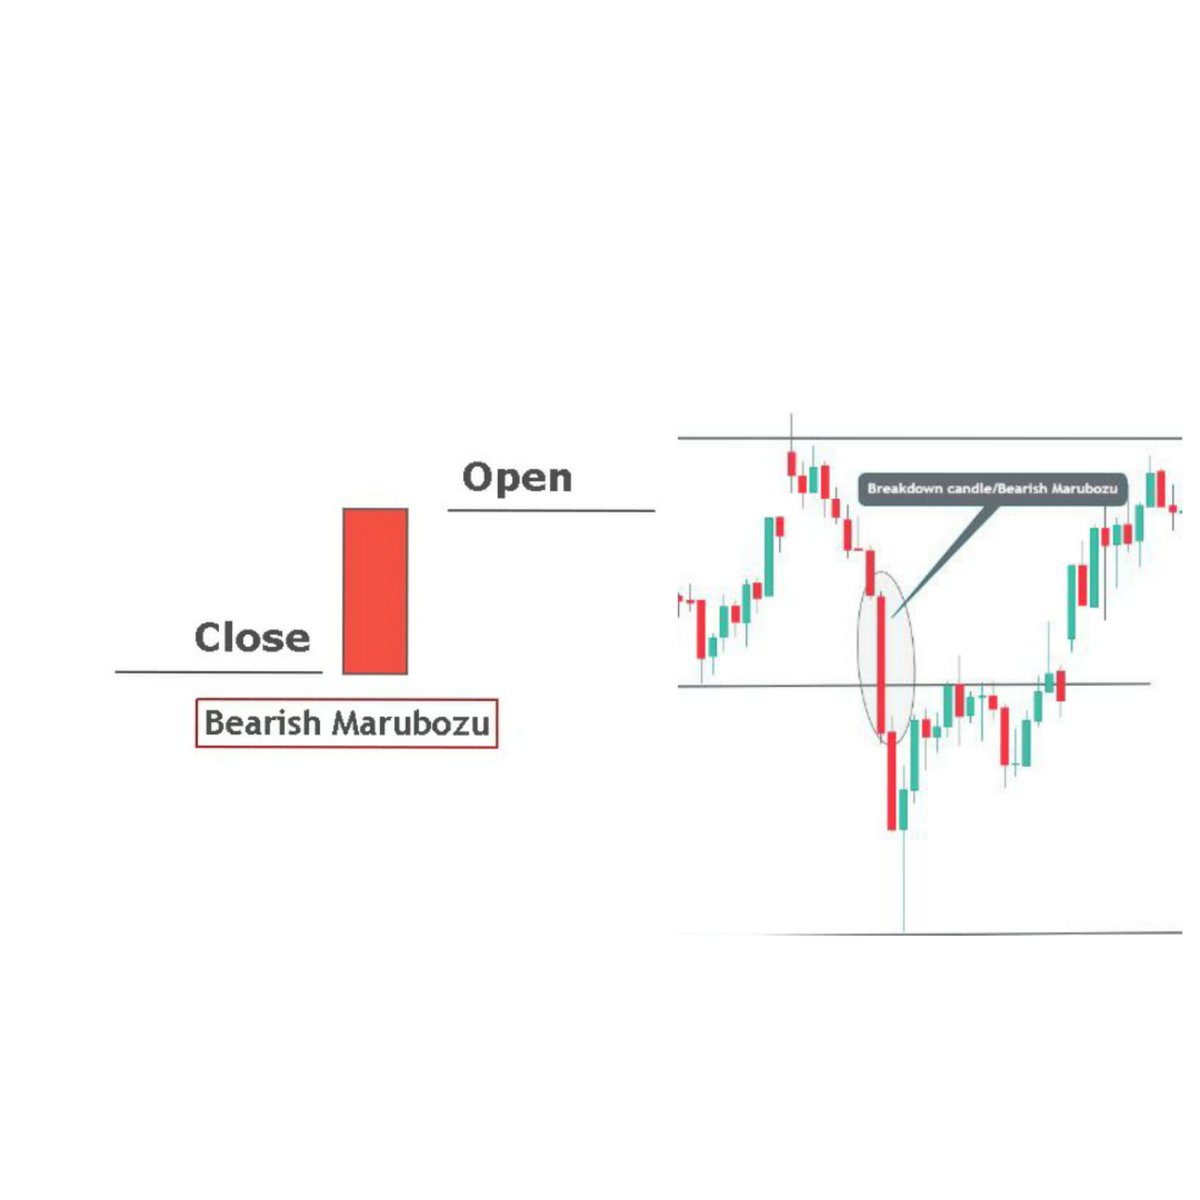
1. Bearish Marubozu
This is big bearish candle without any shadow.
Open = High, low = close
Location is important. If it gets formed at/near the resistance, then it indicates selling. If it forms "exactly at support", then it could be a trap. (8/22)
1. Bearish Marubozu
This is big bearish candle without any shadow.
Open = High, low = close
Location is important. If it gets formed at/near the resistance, then it indicates selling. If it forms "exactly at support", then it could be a trap. (8/22)
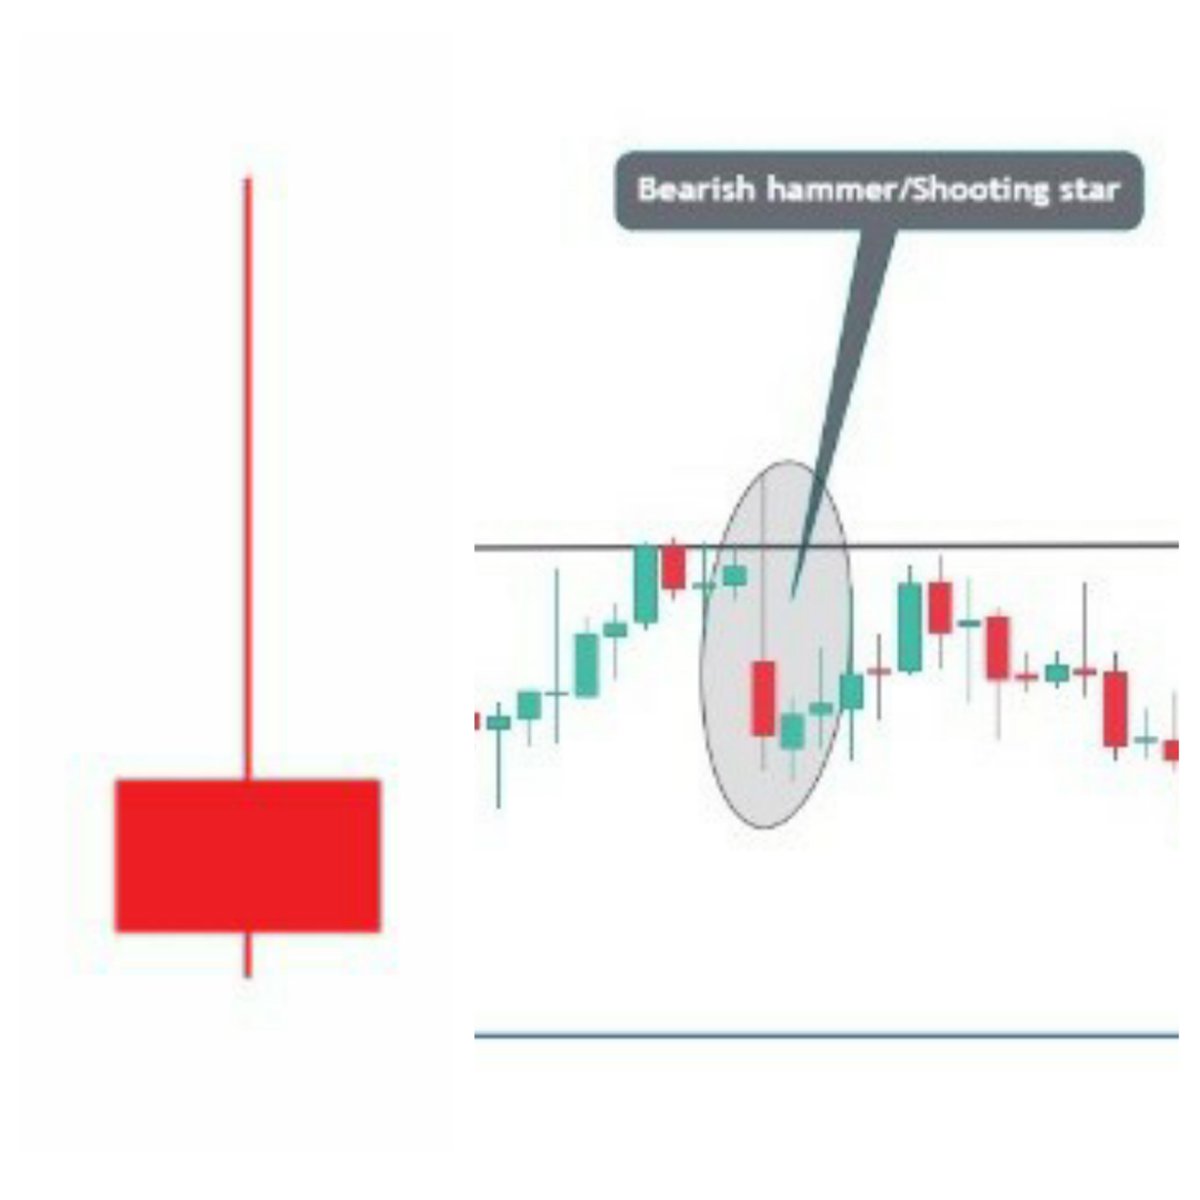
2. Bearish Hammer/Shooting star
• It has a body with a long wick. If this forms at a resistance or at the top of uptrend, then it indicates a selling signal. It's a significant pattern. The longer the upper shadow is, stronger is the bearish pattern. (9/22)
• It has a body with a long wick. If this forms at a resistance or at the top of uptrend, then it indicates a selling signal. It's a significant pattern. The longer the upper shadow is, stronger is the bearish pattern. (9/22)
Multiple Candlestick Patterns
• In this pattern, we need 2 or 3 candles to initiate a trade.
The longer the timeframe, the more useful it is. (10/22)
• In this pattern, we need 2 or 3 candles to initiate a trade.
The longer the timeframe, the more useful it is. (10/22)
Bullish Patterns
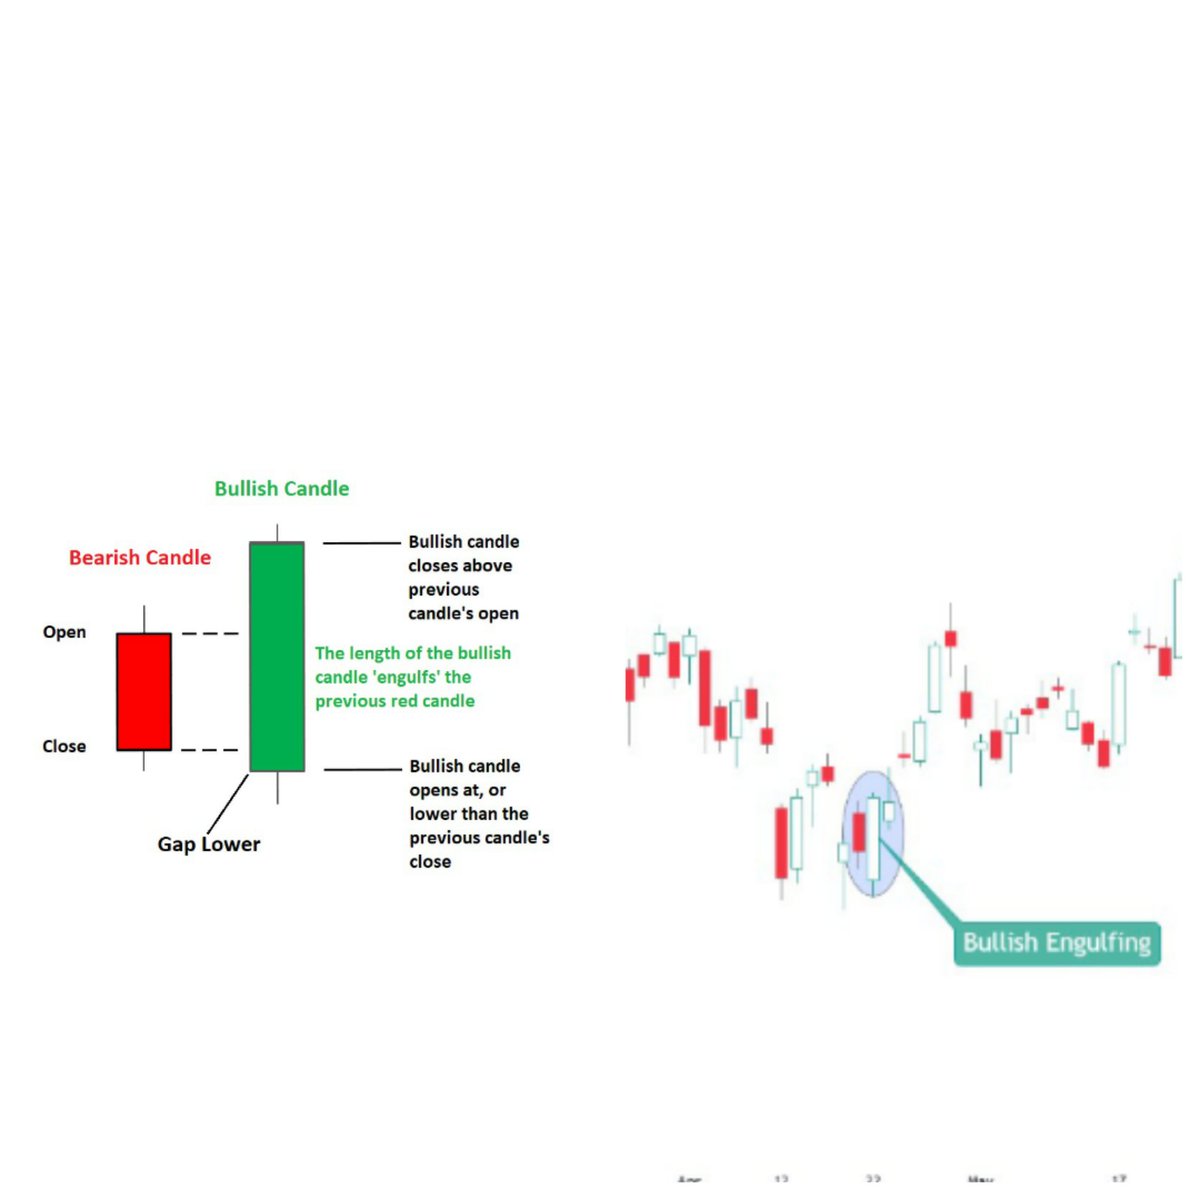
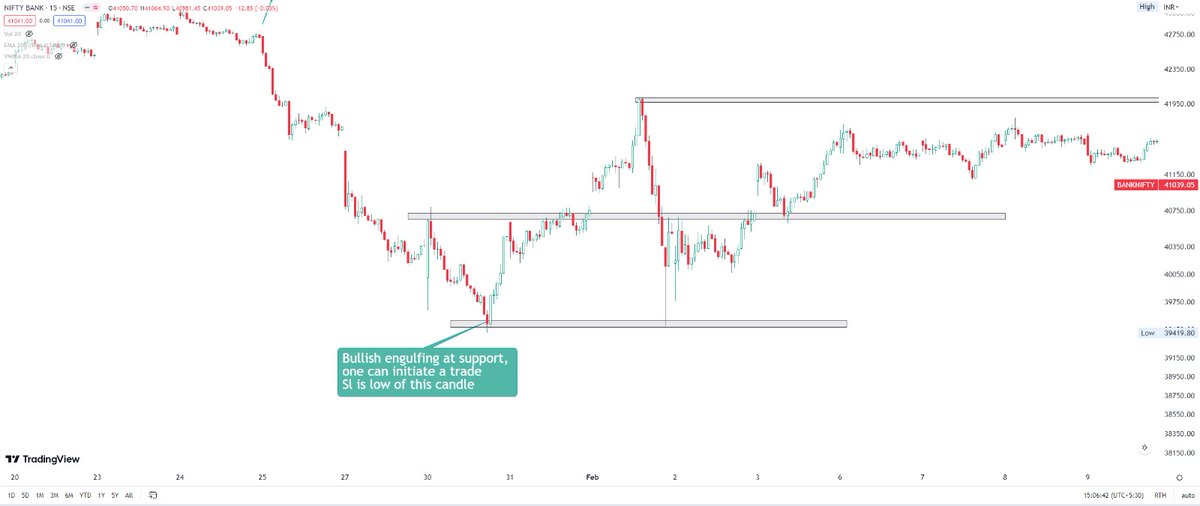
1. Bullish Engulfing
It can be used for initiating a trade only if it forms at support or at the bottom of downtrend. The prior trend should be downtrend. The first candle is bearish and second one is bullish and long enough to engulf the first candle. (11/22)
1. Bullish Engulfing
It can be used for initiating a trade only if it forms at support or at the bottom of downtrend. The prior trend should be downtrend. The first candle is bearish and second one is bullish and long enough to engulf the first candle. (11/22)
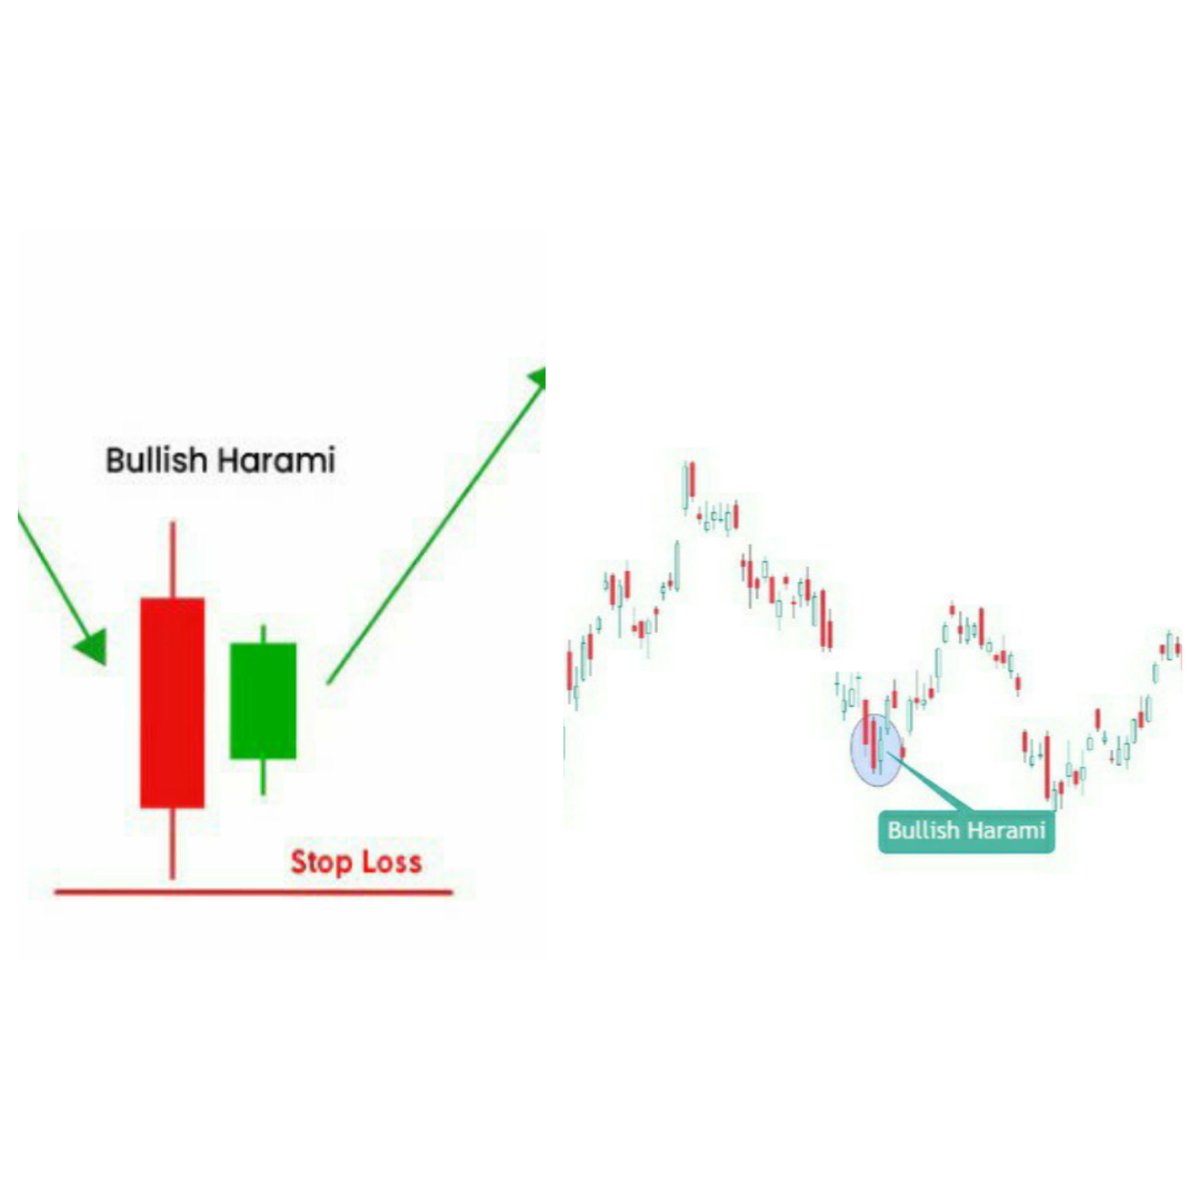
2. Bullish Harami
It's a two candlestick pattern - first candle is the big body and the second one is half of the first candle.
• Prior trend should be downtrend. First candle is bearish and second should be bullish. It has it's importance when it forms at support. (12/22)
It's a two candlestick pattern - first candle is the big body and the second one is half of the first candle.
• Prior trend should be downtrend. First candle is bearish and second should be bullish. It has it's importance when it forms at support. (12/22)
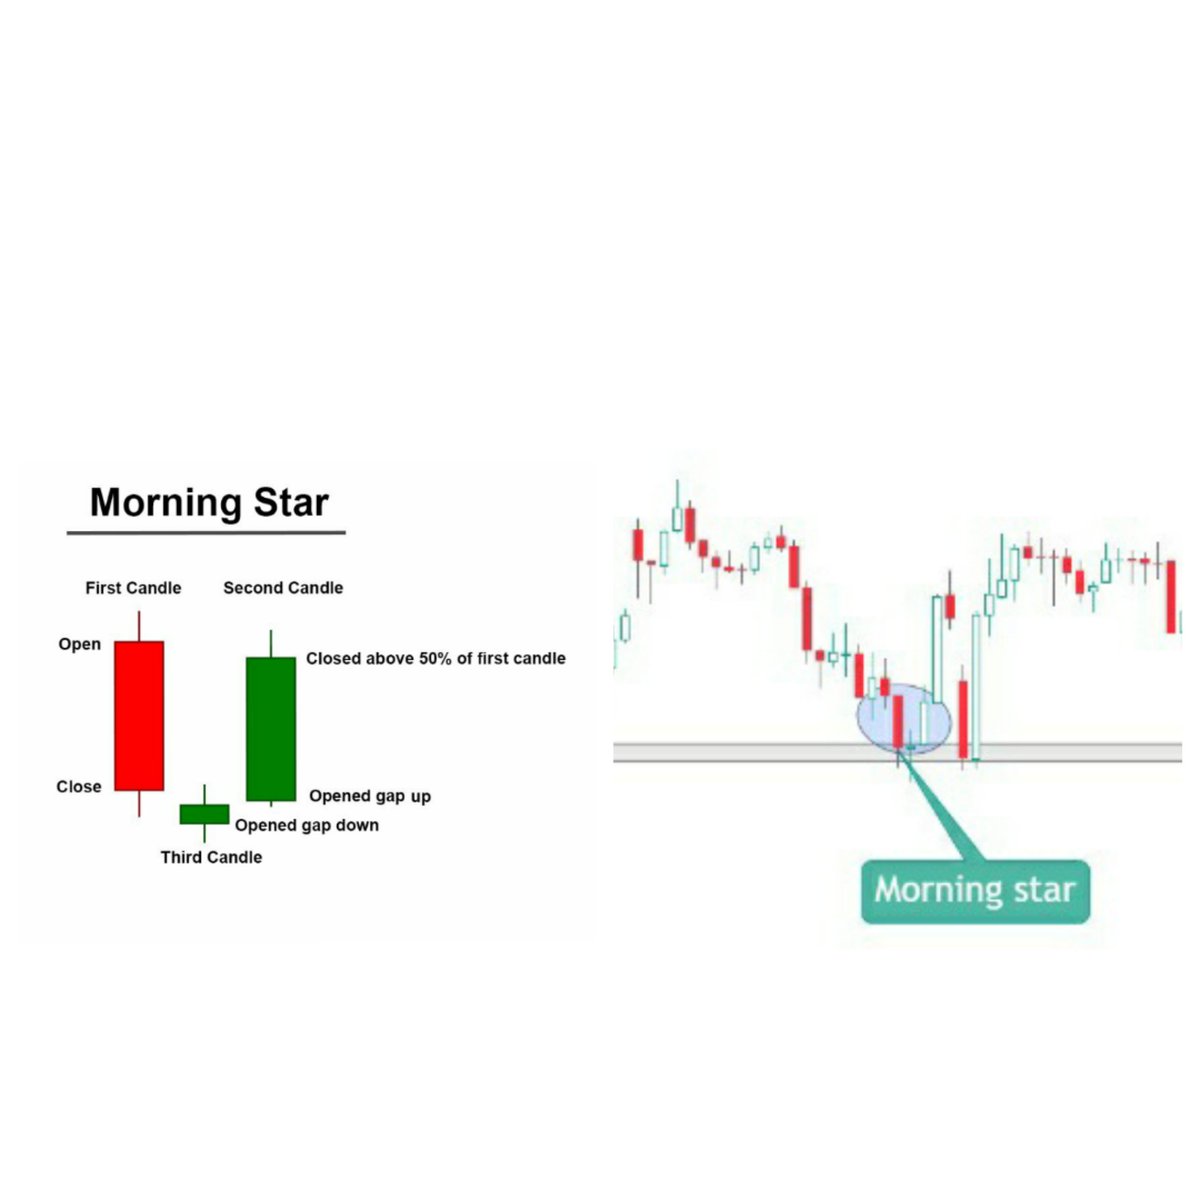
3. Morning Star
It's a bullish and 3 candlestick pattern. It indicates buying when it forms at the bottom of downtrend or at support.
It can work as reversal of downtrend if it forms in higher timeframe. (13/22)
It's a bullish and 3 candlestick pattern. It indicates buying when it forms at the bottom of downtrend or at support.
It can work as reversal of downtrend if it forms in higher timeframe. (13/22)
Bearish Patterns
1. Bearish Engulfing
It's a two candlestick pattern. The first candle is bullish and second one is bearish and long enough to engulf the first candle.
It indicates selling if it forms at resistance or at top of uptrend. The prior trend should be uptrend. (14/22)
1. Bearish Engulfing
It's a two candlestick pattern. The first candle is bullish and second one is bearish and long enough to engulf the first candle.
It indicates selling if it forms at resistance or at top of uptrend. The prior trend should be uptrend. (14/22)
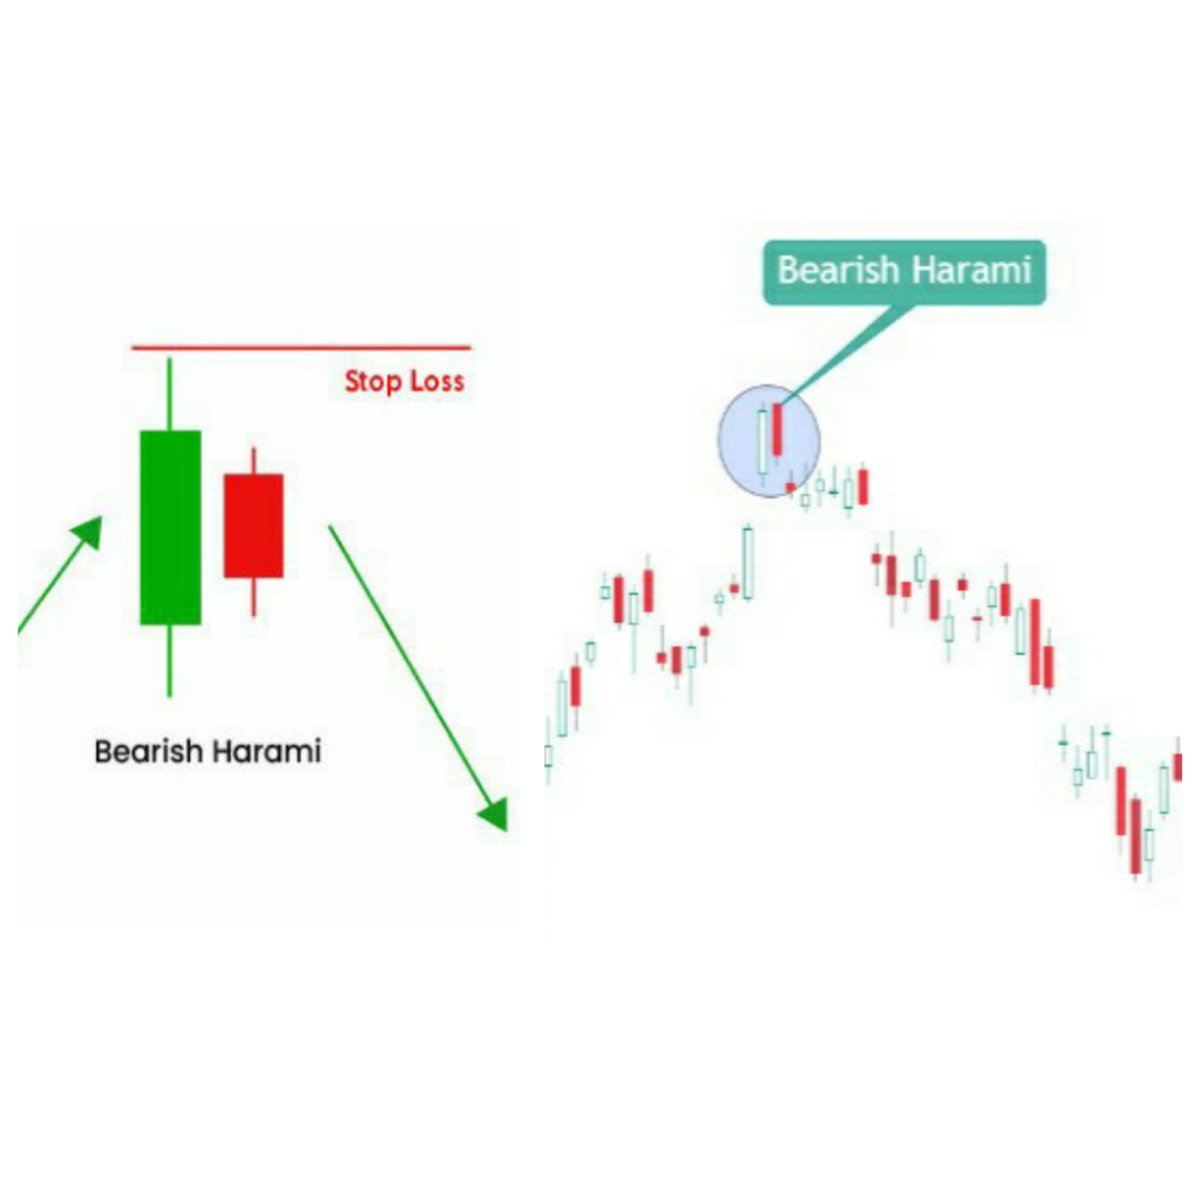
Bearish Harami
It's a two candlestick pattern - first candle is the big body and the second one is half of the first candle.
Prior trend should be uptrend. First candle is bullish and second should be bearish candle. It has it's importance when it forms at resistance. (15/22)
It's a two candlestick pattern - first candle is the big body and the second one is half of the first candle.
Prior trend should be uptrend. First candle is bullish and second should be bearish candle. It has it's importance when it forms at resistance. (15/22)
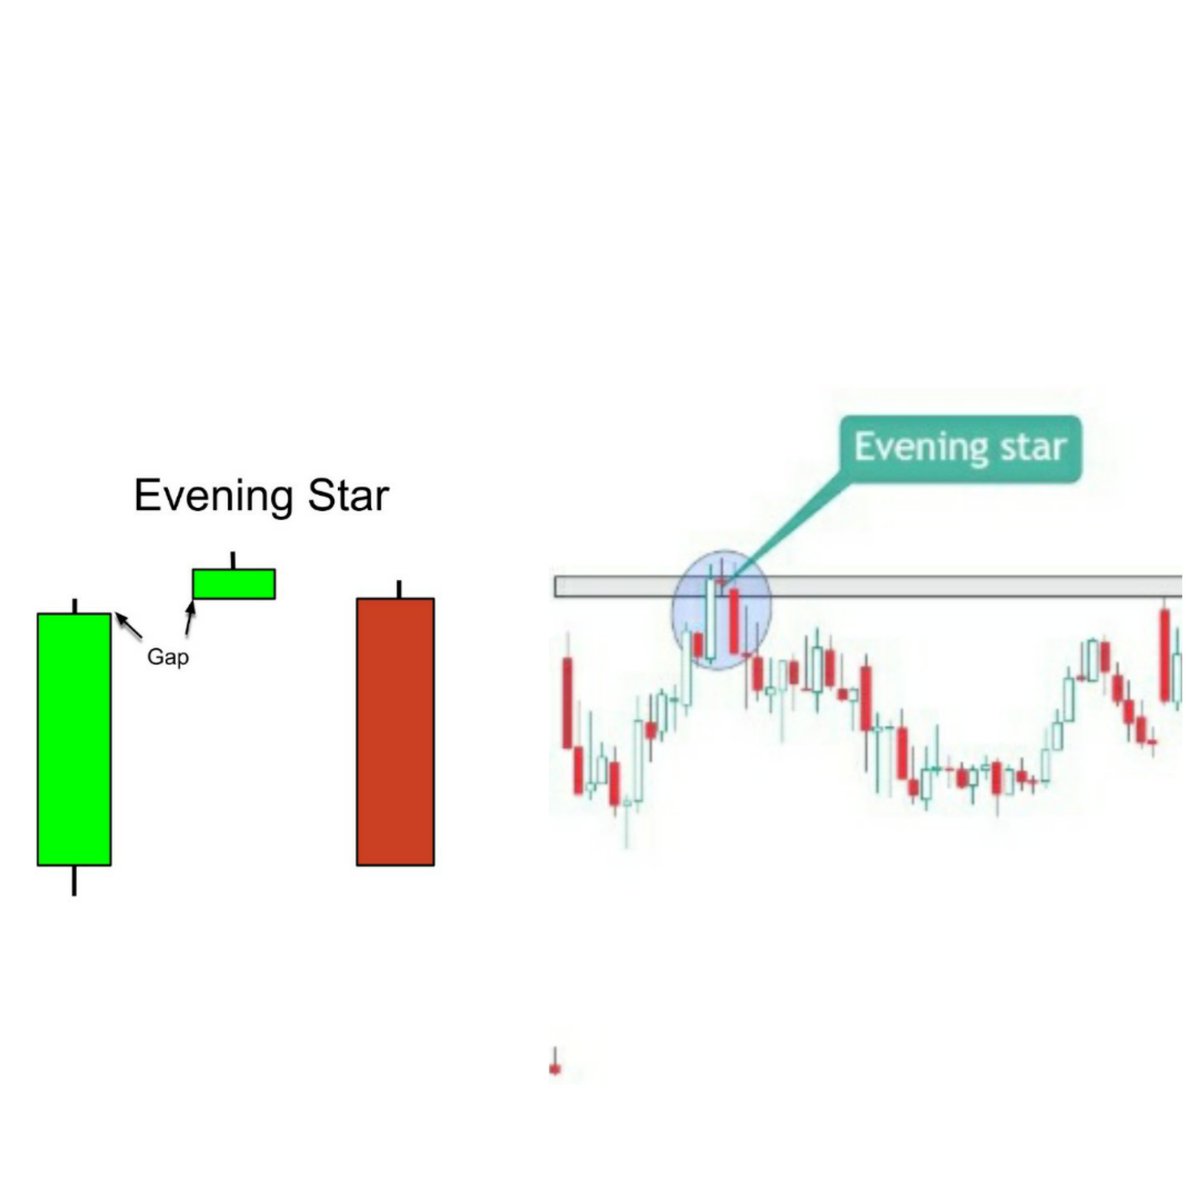
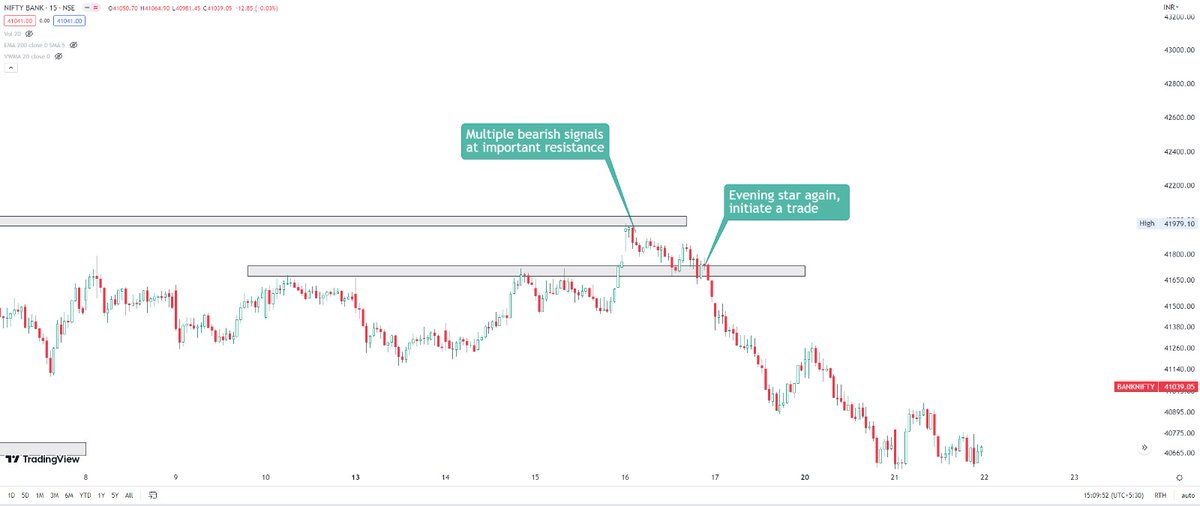
3. Evening Star
It's a bearish and 3 candlestick pattern. It indicates selling when it forms at the top of uptrend or at resistance.
It can work as reversal of uptrend if it forms in higher timeframe. (16/22)
It's a bearish and 3 candlestick pattern. It indicates selling when it forms at the top of uptrend or at resistance.
It can work as reversal of uptrend if it forms in higher timeframe. (16/22)
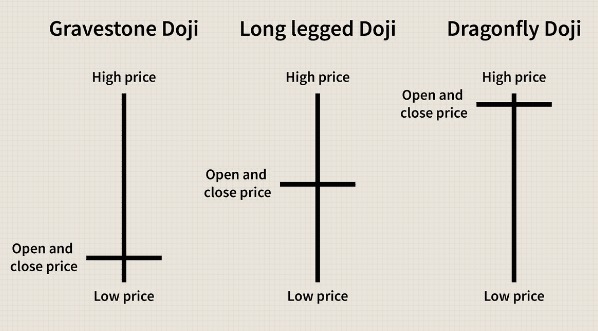
Neutral candlestick patterns
Doji
It's a candle with both side wicks.
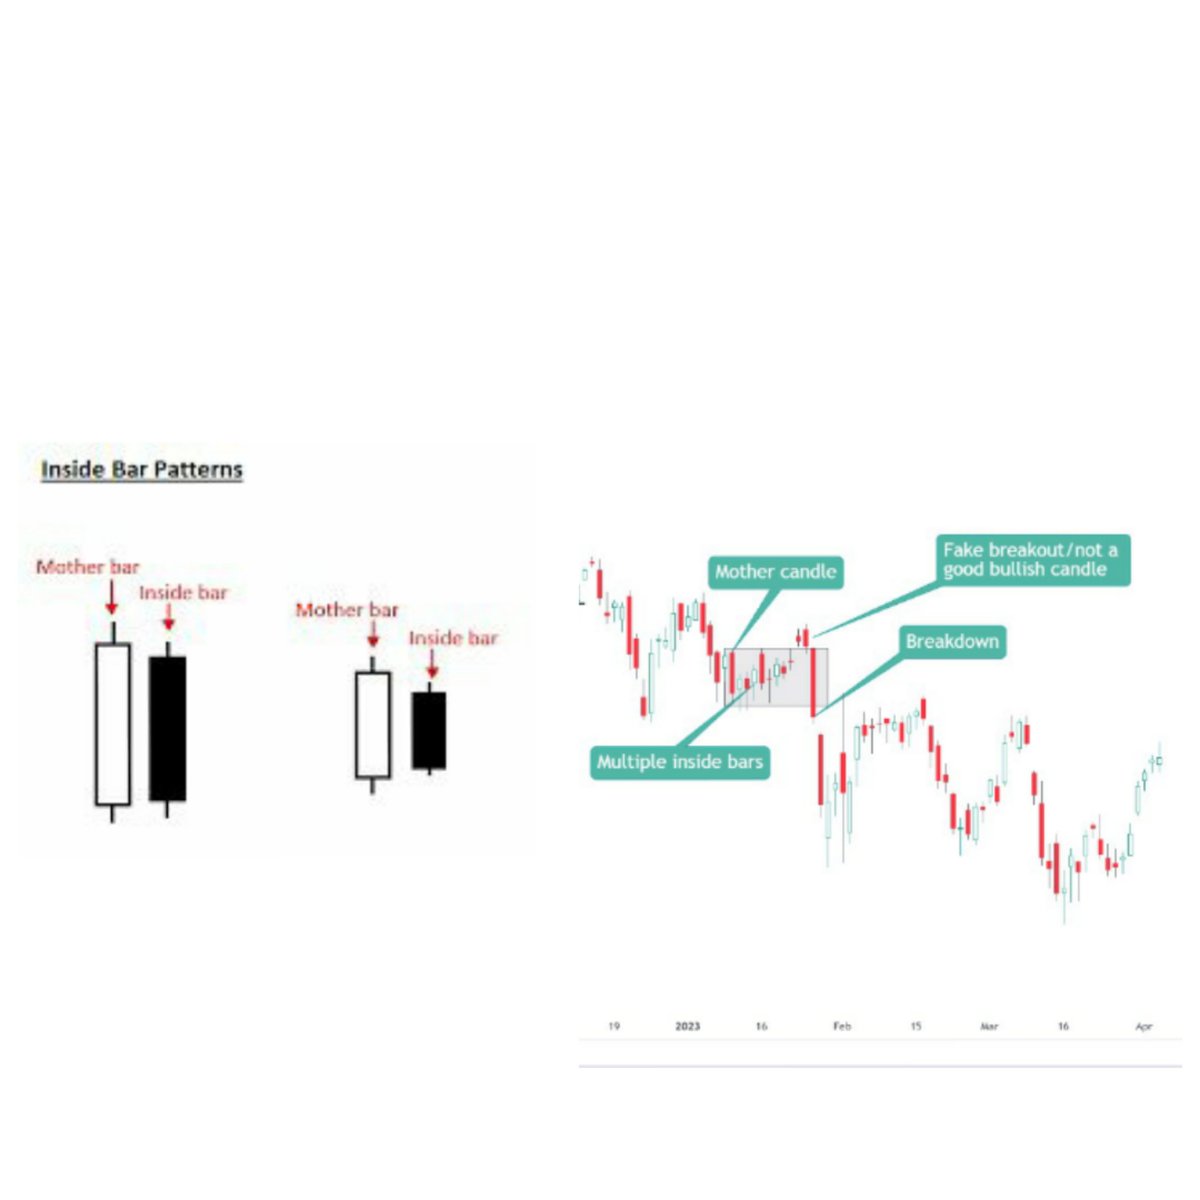
Inside bar -
It's a significant candlestick pattern. When a candle forms within the first candle is called inside bar. Large candle is called monther candle. (17/22)
Doji
It's a candle with both side wicks.
Inside bar -
It's a significant candlestick pattern. When a candle forms within the first candle is called inside bar. Large candle is called monther candle. (17/22)
It often forms after a big move which represents market consolidation. It's important to understand the prior trend before executing a trade on the basis of Inside bar. (18/22)
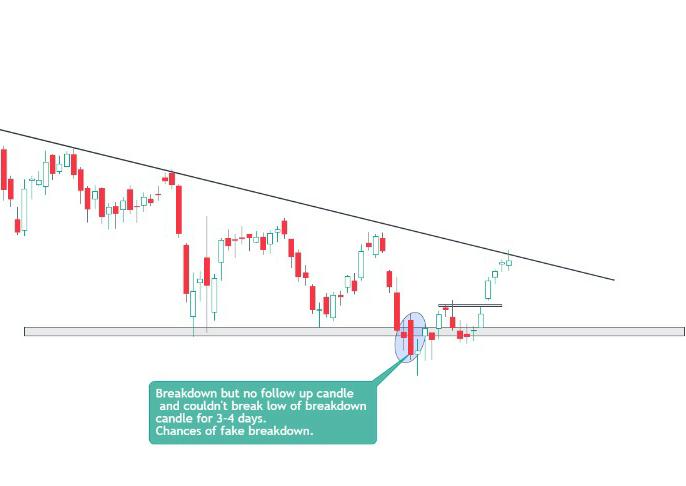
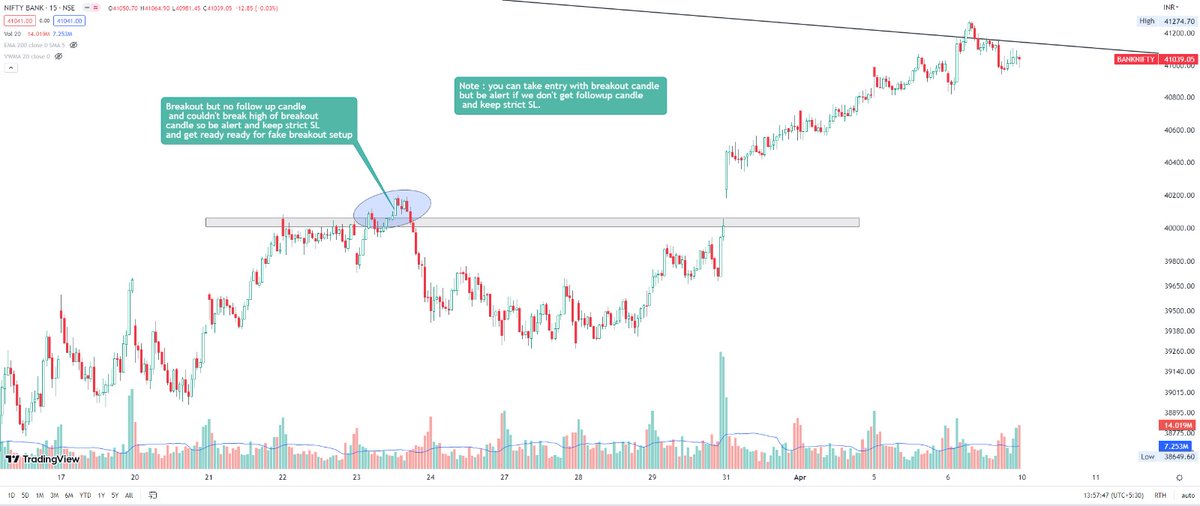
Importance of follow up candles -
Whenever a pattern forms, we need a follow up candle for more confirmation. Suppose if any bullish pattern forms, then we need another single bullish candle as a follow up and same applies for bearish patterns. (19/22)
Whenever a pattern forms, we need a follow up candle for more confirmation. Suppose if any bullish pattern forms, then we need another single bullish candle as a follow up and same applies for bearish patterns. (19/22)
How to use Candlestick Patterns for entry, targets and SL
- Whenever any bullish or bearish candlestick pattern forms at support or resistance along with a follow up candle, you can initiate a trade. Always remember its location is important. (20/22)
- Whenever any bullish or bearish candlestick pattern forms at support or resistance along with a follow up candle, you can initiate a trade. Always remember its location is important. (20/22)
- SL you can put at candle's low. If candle is too big, then you can put SL at half of the candle.
- Whenever a big candle forms, we consider candle's high and low as support and resistance also.
Let's understand through a few examples. (21/22)
- Whenever a big candle forms, we consider candle's high and low as support and resistance also.
Let's understand through a few examples. (21/22)
Also, please go through this price action thread - Support/Resistance. If you find this thread on basic price action helpful, please drop your comments and retweet. It would encourage me to write more such threads. (22/22)
Follow my channel for regular updates -
telegram.me
telegram.me

Loading suggestions...