

Top technical indicators explained:
A thread 🧵👇
A thread 🧵👇
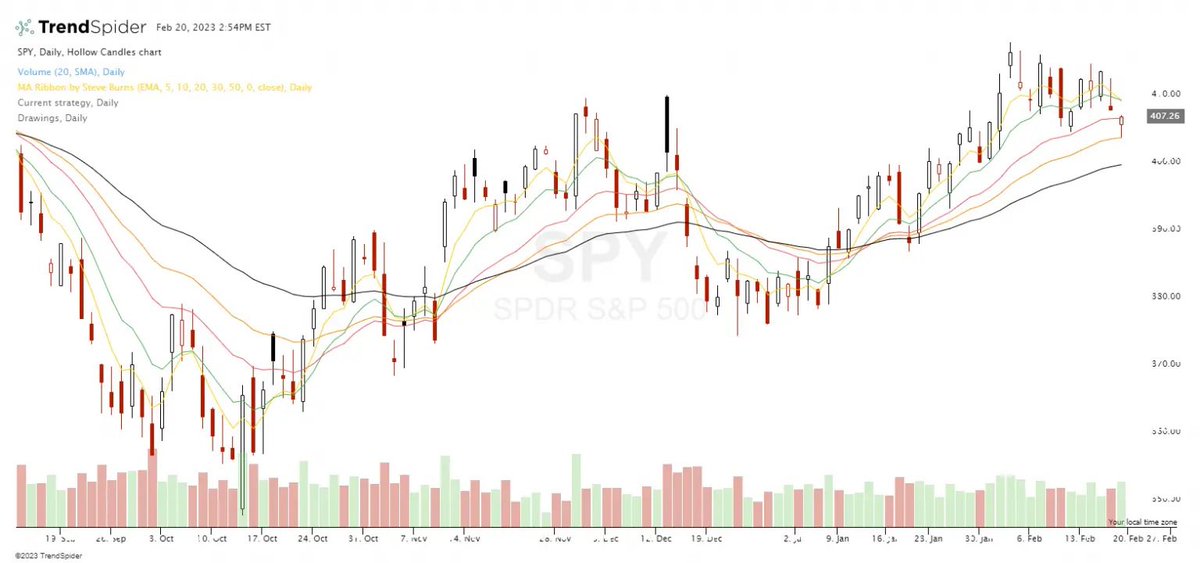
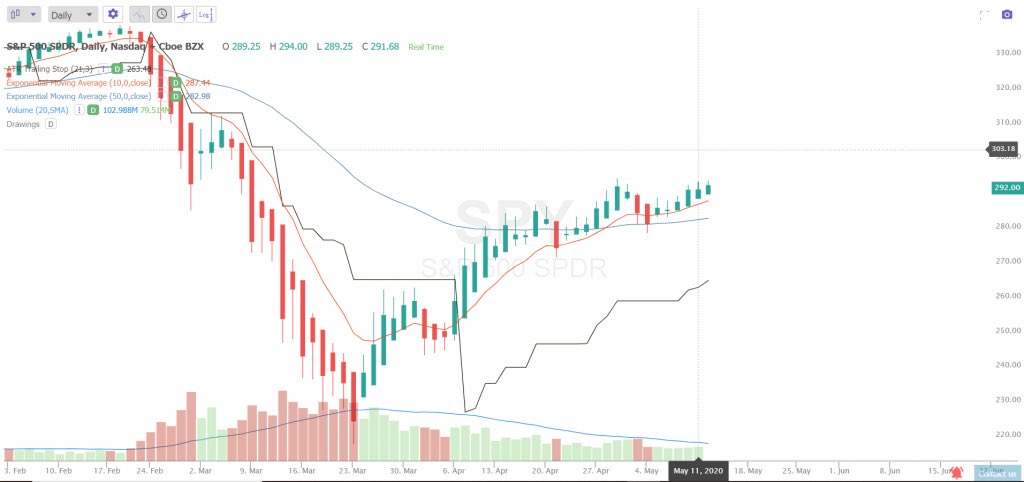
Moving Averages (EMA):
Example: A trader could use a crossover strategy with the 5-day Exponential Moving Average (EMA) and the 20-day EMA. When the 5-day EMA crosses above the 20-day EMA, this could signal a potential long entry (buy) setup. Conversely, when the 5-day EMA…
Example: A trader could use a crossover strategy with the 5-day Exponential Moving Average (EMA) and the 20-day EMA. When the 5-day EMA crosses above the 20-day EMA, this could signal a potential long entry (buy) setup. Conversely, when the 5-day EMA…
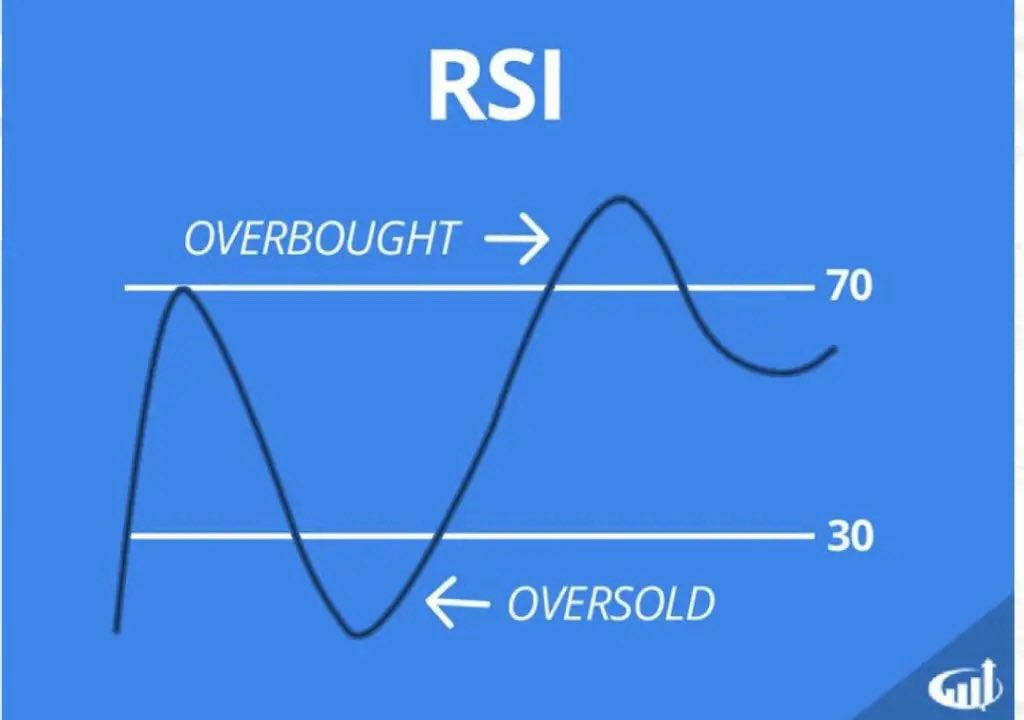
Relative Strength Index (RSI):
Example: A trader may use the RSI to identify potential overbought or oversold conditions. If the RSI value is above 70, the security might be considered overbought, and the trader could look for a short entry. If the RSI value is below 30, the…
Example: A trader may use the RSI to identify potential overbought or oversold conditions. If the RSI value is above 70, the security might be considered overbought, and the trader could look for a short entry. If the RSI value is below 30, the…
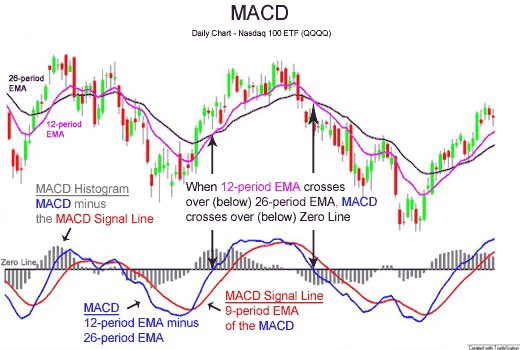
Moving Average Convergence Divergence (MACD):
Example: A trader could use the MACD for a crossover strategy. When the MACD line (usually a 12-day EMA minus a 26-day EMA) crosses above the signal line (usually a 9-day EMA of the MACD), it could signal a potential long entry.…
Example: A trader could use the MACD for a crossover strategy. When the MACD line (usually a 12-day EMA minus a 26-day EMA) crosses above the signal line (usually a 9-day EMA of the MACD), it could signal a potential long entry.…
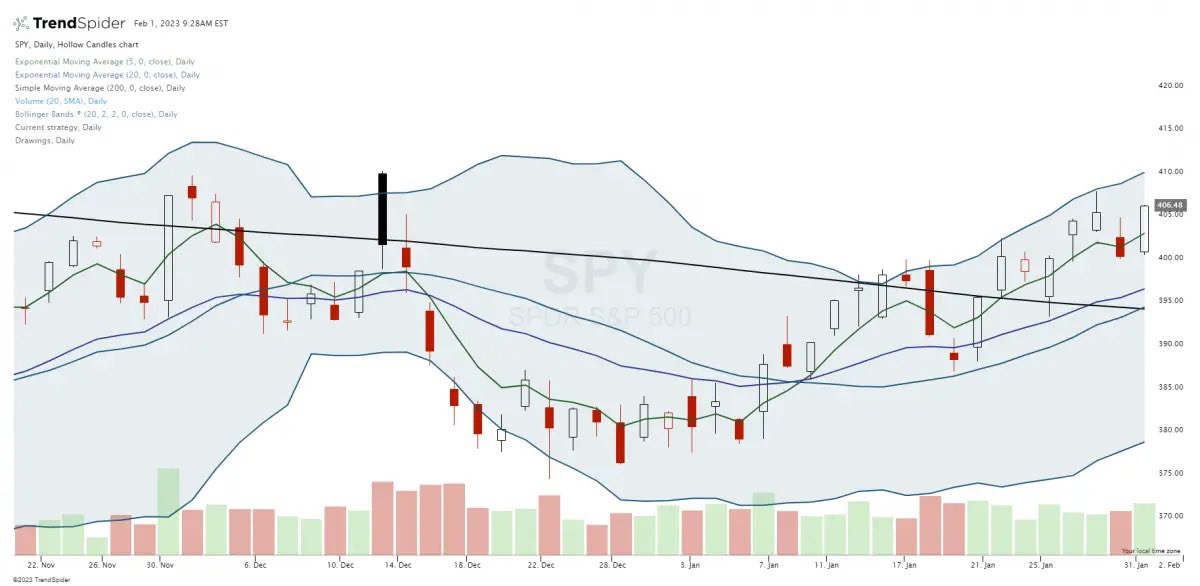
Bollinger Bands:
Example: A trader might use Bollinger Bands to identify potential breakouts. If the price moves and closes above the upper Bollinger Band, it could signal a potential long entry, anticipating a continued uptrend. Conversely, if the price moves and closes below…
Example: A trader might use Bollinger Bands to identify potential breakouts. If the price moves and closes above the upper Bollinger Band, it could signal a potential long entry, anticipating a continued uptrend. Conversely, if the price moves and closes below…
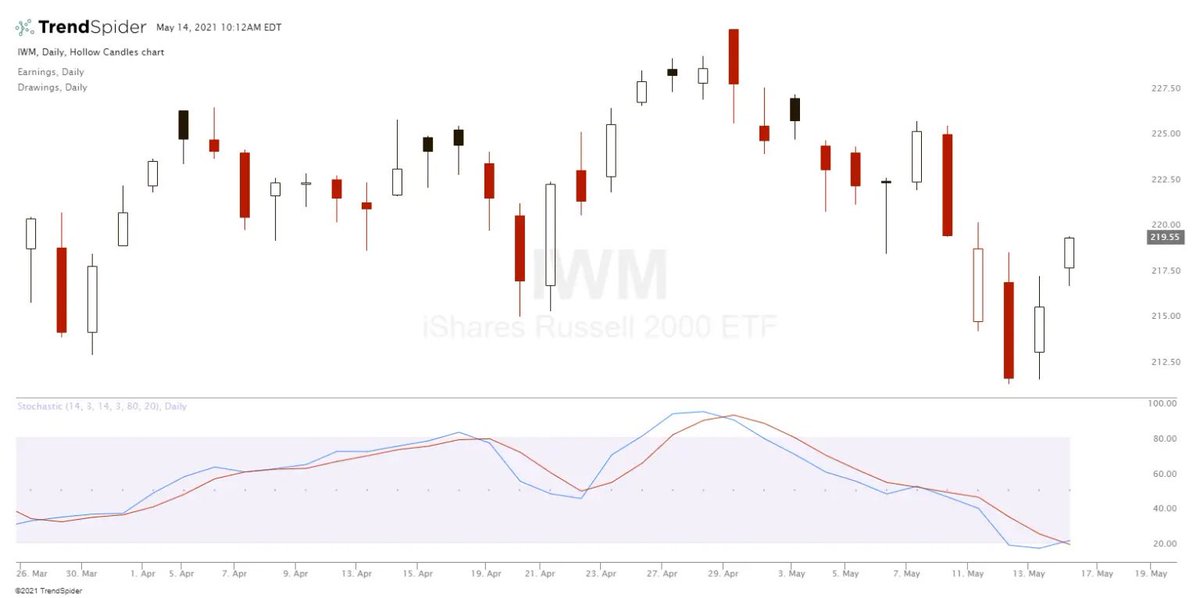
Stochastic Oscillator:
Example: A trader may use the Stochastic Oscillator to identify potential overbought or oversold conditions. When the %K line (fast line) crosses above the %D line (slow line) in oversold territory (below 20), it could signal a potential long entry.…
Example: A trader may use the Stochastic Oscillator to identify potential overbought or oversold conditions. When the %K line (fast line) crosses above the %D line (slow line) in oversold territory (below 20), it could signal a potential long entry.…
Average True Range (ATR):
Example: A trader might use the ATR to determine stop-loss levels. For instance, a trader could set a stop-loss two times the ATR value below the entry price for a long trade or two times the ATR value above the entry price for a short trade. This could…
Example: A trader might use the ATR to determine stop-loss levels. For instance, a trader could set a stop-loss two times the ATR value below the entry price for a long trade or two times the ATR value above the entry price for a short trade. This could…
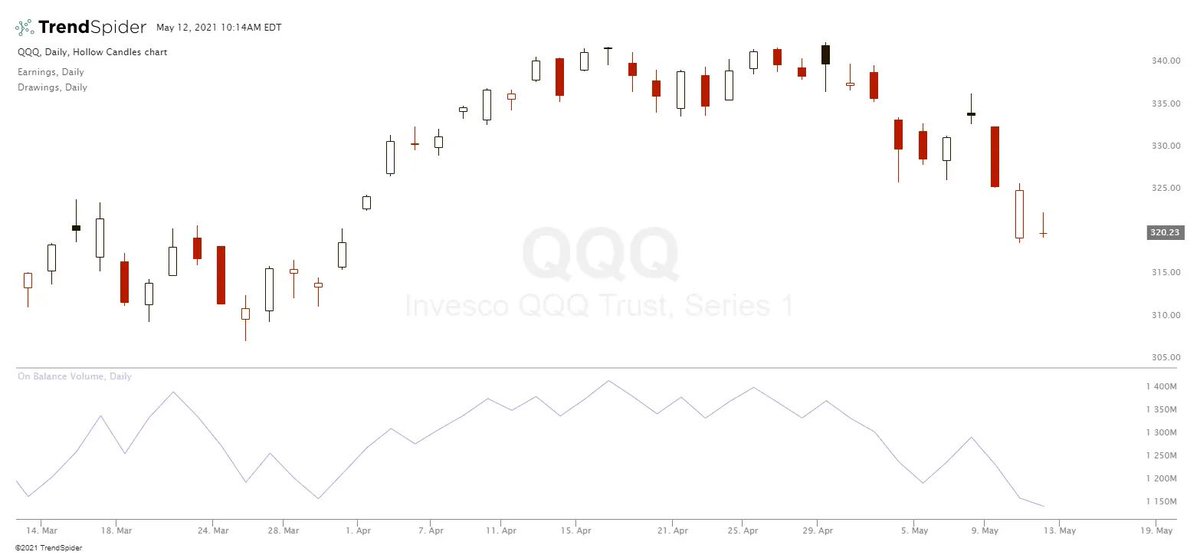
On-Balance Volume (OBV):
Example: A trader could use the OBV to identify potential price and volume divergences. If the price is rising while the OBV is falling, it could suggest weakening buying pressure and a potential bearish price reversal. Conversely, if the price is…
Example: A trader could use the OBV to identify potential price and volume divergences. If the price is rising while the OBV is falling, it could suggest weakening buying pressure and a potential bearish price reversal. Conversely, if the price is…
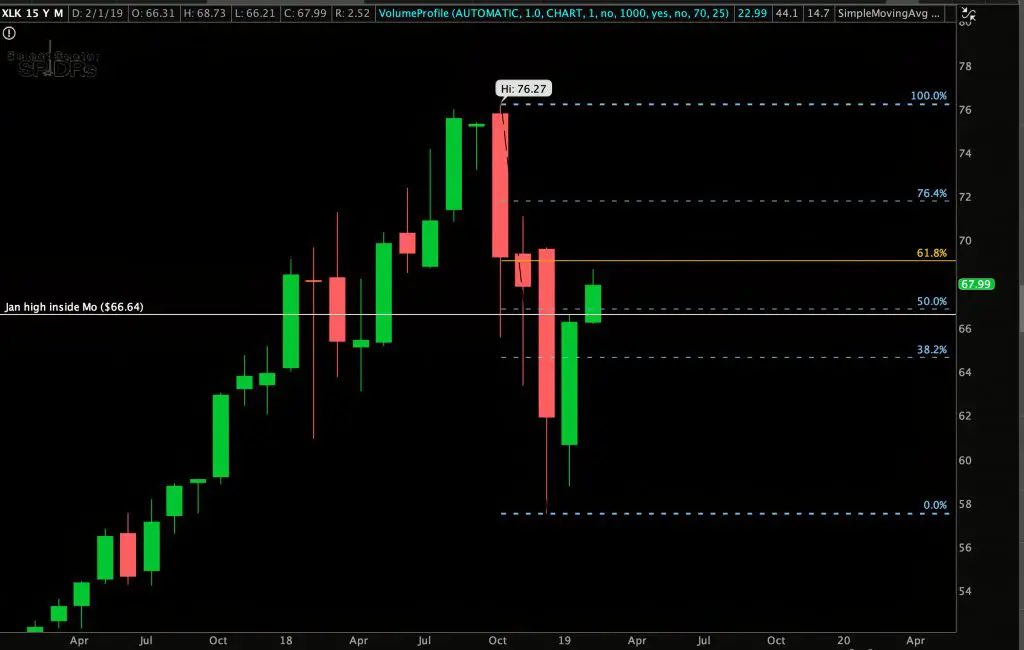
Fibonacci Retracements:
Example: A trader might use Fibonacci Retracements to identify potential support and resistance levels after a significant price movement. For example, if the price retraces to the 61.8% Fibonacci level after an uptrend, it could signal a potential long…
Example: A trader might use Fibonacci Retracements to identify potential support and resistance levels after a significant price movement. For example, if the price retraces to the 61.8% Fibonacci level after an uptrend, it could signal a potential long…
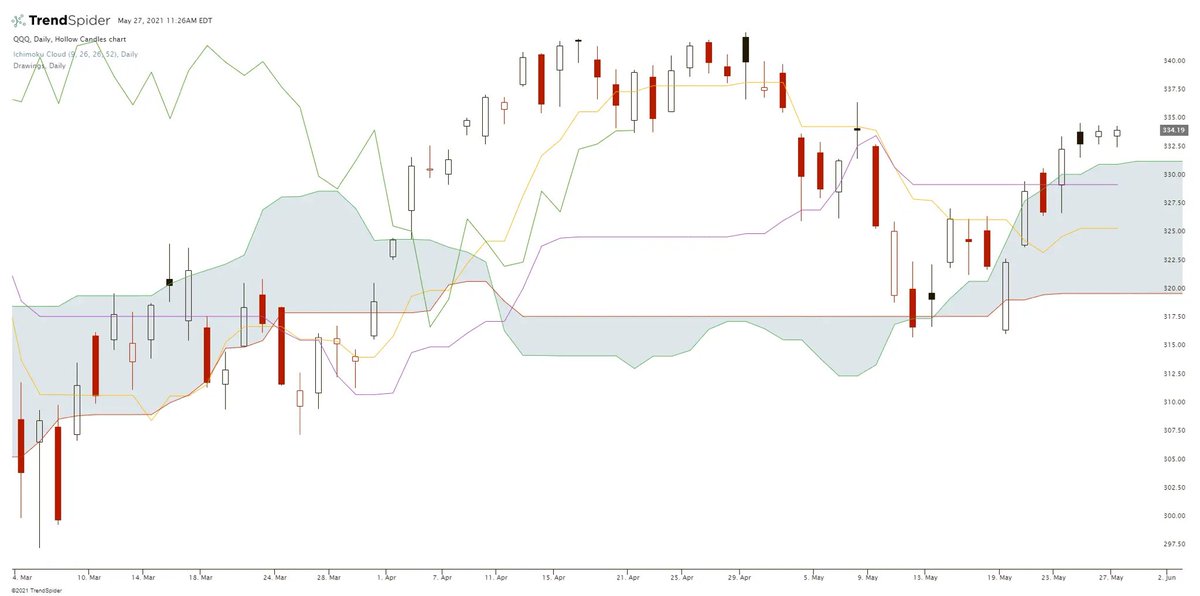
Ichimoku Cloud:
Example: A trader could use the Ichimoku Cloud to identify potential trend reversals. If the price moves above the cloud and the cloud changes color from red to green, it could signal a potential long entry, indicating a bullish trend reversal. Conversely, if the…
Example: A trader could use the Ichimoku Cloud to identify potential trend reversals. If the price moves above the cloud and the cloud changes color from red to green, it could signal a potential long entry, indicating a bullish trend reversal. Conversely, if the…
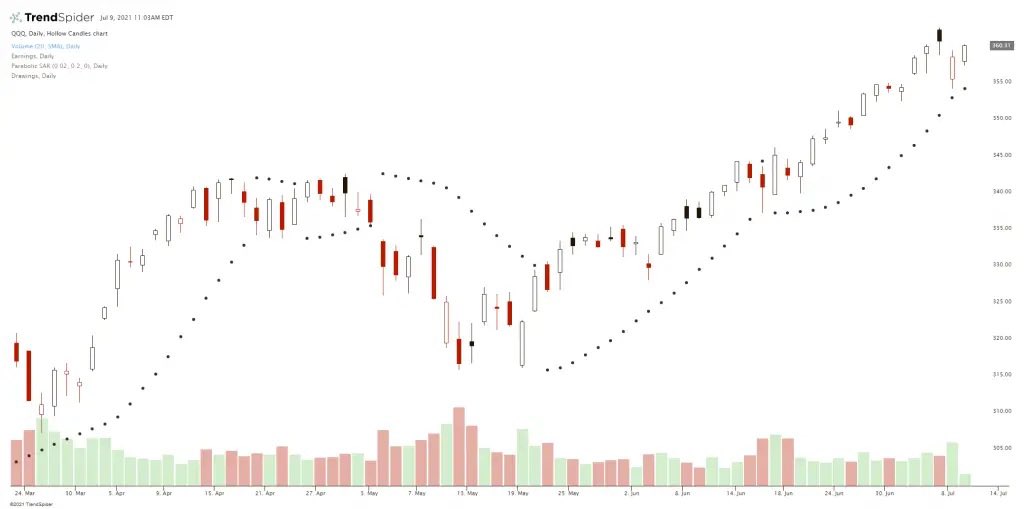
Parabolic SAR:
Example: A trader might use the Parabolic SAR to identify potential entry and exit points. When the Parabolic SAR dots move below the price, it could signal a potential long entry, indicating an uptrend. Conversely, when the Parabolic SAR dots move above the…
Example: A trader might use the Parabolic SAR to identify potential entry and exit points. When the Parabolic SAR dots move below the price, it could signal a potential long entry, indicating an uptrend. Conversely, when the Parabolic SAR dots move above the…
Explore more technical indicators in my book: amzn.to

Loading suggestions...