

VWAP is used indicator by most traders for trade entry.
But the concept guided by Nitesh Sir @learntotrade365 is really helpful.
*I tried to develop an Indicator in #Tradingview for #BankNifty *
Here is thread on it.
But the concept guided by Nitesh Sir @learntotrade365 is really helpful.
*I tried to develop an Indicator in #Tradingview for #BankNifty *
Here is thread on it.
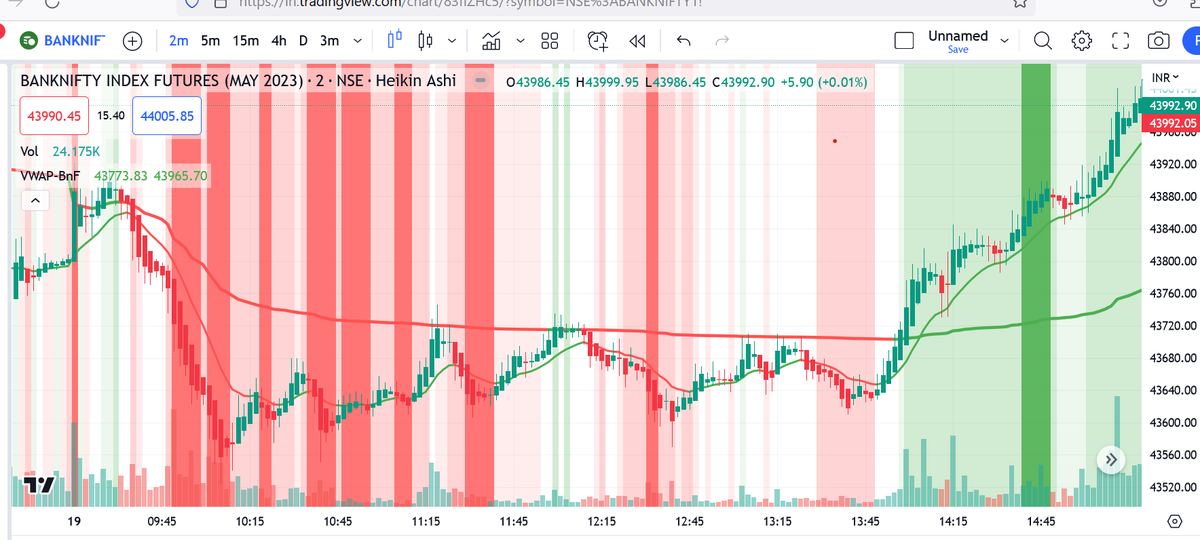
Timeframe used is 2 min chart. You can use 3 min chart also.
VWAP is shown with broad line and moving average shown by this line.
When price moves above or below these lines, they change colors.
This is only for #BankNifty as it is based stocks constitutent
VWAP is shown with broad line and moving average shown by this line.
When price moves above or below these lines, they change colors.
This is only for #BankNifty as it is based stocks constitutent
Stocks for BankNifty :-
#hdfcbank
#ICICIBANK
#KOTAKBANK
#AxisBank
#SBI
#IndusindBank
Conditions configured as below:-
for #bearish
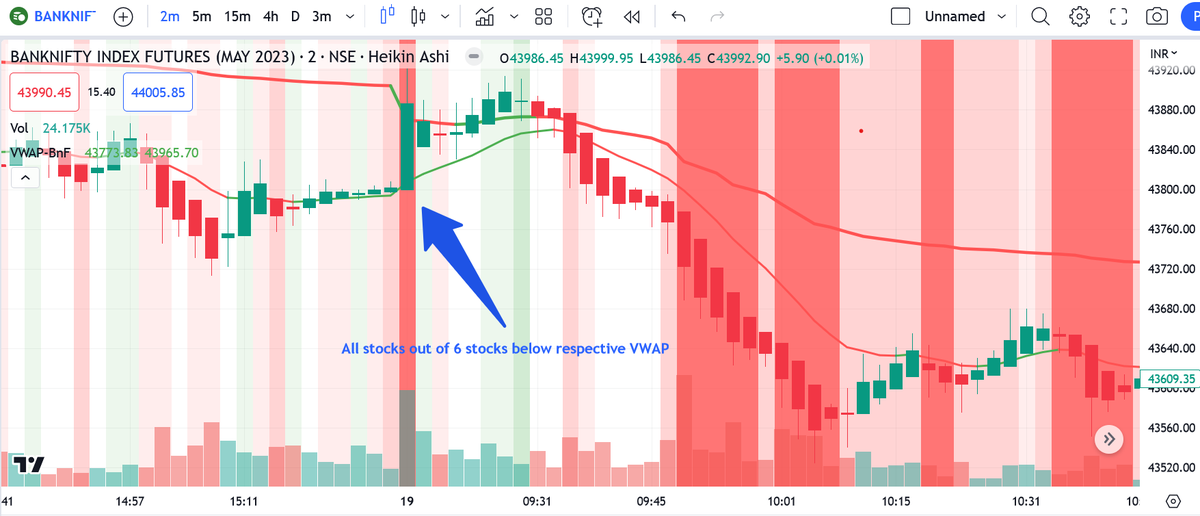
1. When all stocks trading below respective VWAP, it fill with dark red
2. When 5 out of 6 stocks are below VWAP, lighter red
#hdfcbank
#ICICIBANK
#KOTAKBANK
#AxisBank
#SBI
#IndusindBank
Conditions configured as below:-
for #bearish
1. When all stocks trading below respective VWAP, it fill with dark red
2. When 5 out of 6 stocks are below VWAP, lighter red
3. When 4 out of 6 stocks below VWAP very lighter red.
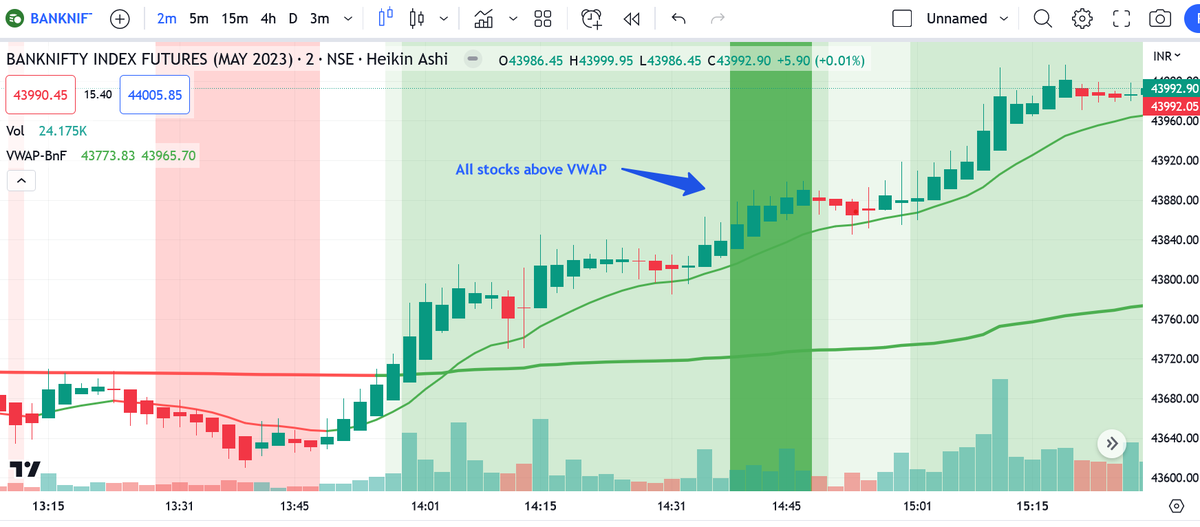
for #BULLISH
5. When all stocks trading above respective VWAP, it fill with dark green
6. When 5 out of 6 stocks are above VWAP, lighter green
7. When 4 out of 6 stocks above VWAP very lighter green.
for #BULLISH
5. When all stocks trading above respective VWAP, it fill with dark green
6. When 5 out of 6 stocks are above VWAP, lighter green
7. When 4 out of 6 stocks above VWAP very lighter green.
When 3 out of 6 stocks below VWAP, there is no color.
Thus it gives you sentiments of current scenario.
For trading you can use other Technical analysis (like MA, RSI, MACD, Pivots) along with sentiments current going on.
Thus it gives you sentiments of current scenario.
For trading you can use other Technical analysis (like MA, RSI, MACD, Pivots) along with sentiments current going on.
I have used ema for filter the trade. It gives to enter when highest probability on your side (dark red /dark green). You can do further analysis, All suggestion are welcome, I would be happy to make changes.
Whenever sentiments changed to extreme level (dark green or dark red) there is time to precautions with existing positions and wait for trigger for other trade.
Great Thanks to Nitesh Sir who explain the concepts in detail in below thread.
Great Thanks to Nitesh Sir who explain the concepts in detail in below thread.
This indicator is private yet, If you want to use this indicator, please DM.
Loading suggestions...