

Hammer candlestick is one of the most important candlesticks for day traders.
A thread 🧵 on hammer 🔨 candlestick.
Telegram: t.me
Retweet ♻ if you find it useful.
@kuttrapali26 @KommawarSwapnil @Stocktwit_IN @caniravkaria
#StockMarket #forex #nifty
A thread 🧵 on hammer 🔨 candlestick.
Telegram: t.me
Retweet ♻ if you find it useful.
@kuttrapali26 @KommawarSwapnil @Stocktwit_IN @caniravkaria
#StockMarket #forex #nifty


📍What is a hammer candlestick?
A hammer candlestick is a trend reversal pattern spotted at the bottom of a downtrend.
The pattern looks like a hammer, with a long lower shadow and a small body hence named as hammer candlestick.
A hammer candlestick is a trend reversal pattern spotted at the bottom of a downtrend.
The pattern looks like a hammer, with a long lower shadow and a small body hence named as hammer candlestick.
Hammer candles can be of any colour – They can be either Green or Red colour.
The lower shadow should be at least two times the height of the real body.
The lower shadow should be at least two times the height of the real body.
This pattern is characterized by a long lower shadow. It shows that sellers exerted considerable pressure during the session, but buyers stepped in at the end and pushed prices upwards again.
This is a very bullish sign and suggests that the downtrend may be coming to an end.
This is a very bullish sign and suggests that the downtrend may be coming to an end.
📍How to trade Hammer candles?
Entry- Next candle closing above hammer candle.
Stop loss is just below the hammer candle's low.
Target depends on the situation but usually the next swing high or resistance.
Entry- Next candle closing above hammer candle.
Stop loss is just below the hammer candle's low.
Target depends on the situation but usually the next swing high or resistance.
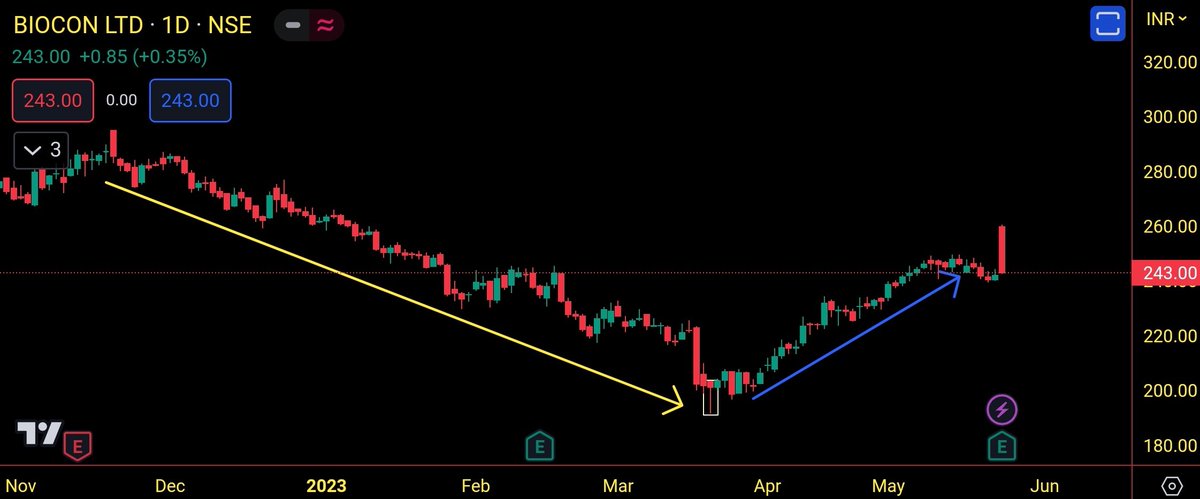
In the image below, we can see a downtrend as marked by the yellow arrow, then a hammer candle formed (marked by a rectangle box) and we can immediately see a change in direction from a downtrend to an uptrend as marked by the blue arrow.
📍Application of Hammer candle
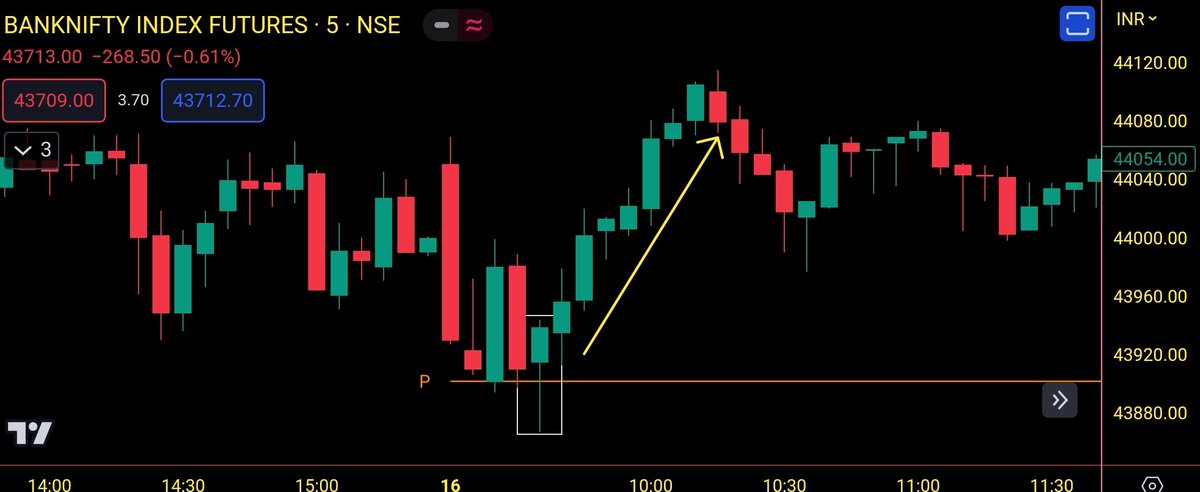
👉 Hammer candle at the pivot point
When a hammer candle is formed at Pivot Point, it indicates the price will reverse from there.
In the image below, we can see an uptrend immediately after a hammer candle formation at the pivot point.
👉 Hammer candle at the pivot point
When a hammer candle is formed at Pivot Point, it indicates the price will reverse from there.
In the image below, we can see an uptrend immediately after a hammer candle formation at the pivot point.
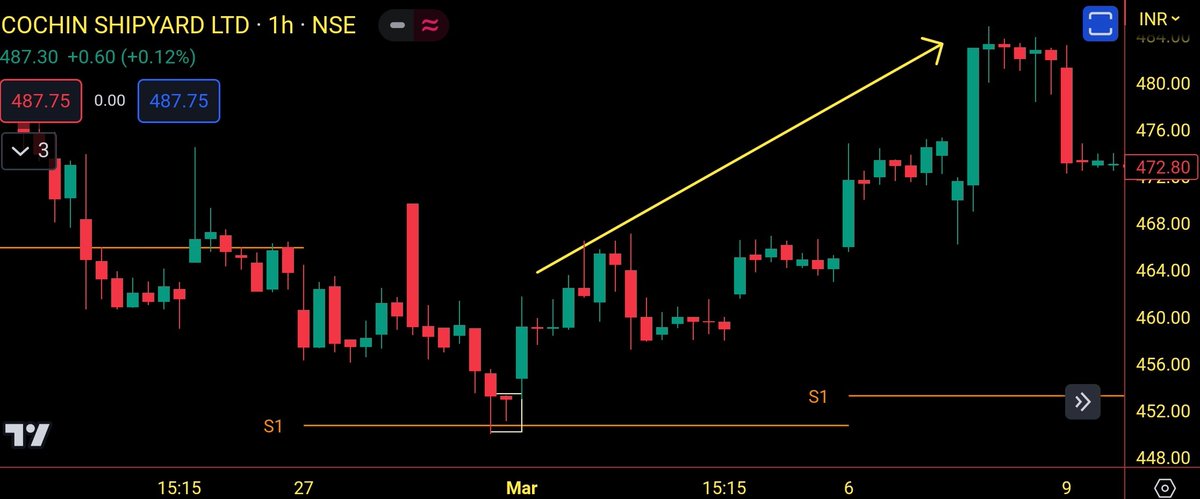
👉 Hammer candle at Support 1 (AKA S1)
When a hammer candle is formed at S1, it indicates the price will reverse from there.
In the image below, we can see an uptrend (marked by a yellow arrow) immediately after a hammer candle formation at S1.
When a hammer candle is formed at S1, it indicates the price will reverse from there.
In the image below, we can see an uptrend (marked by a yellow arrow) immediately after a hammer candle formation at S1.
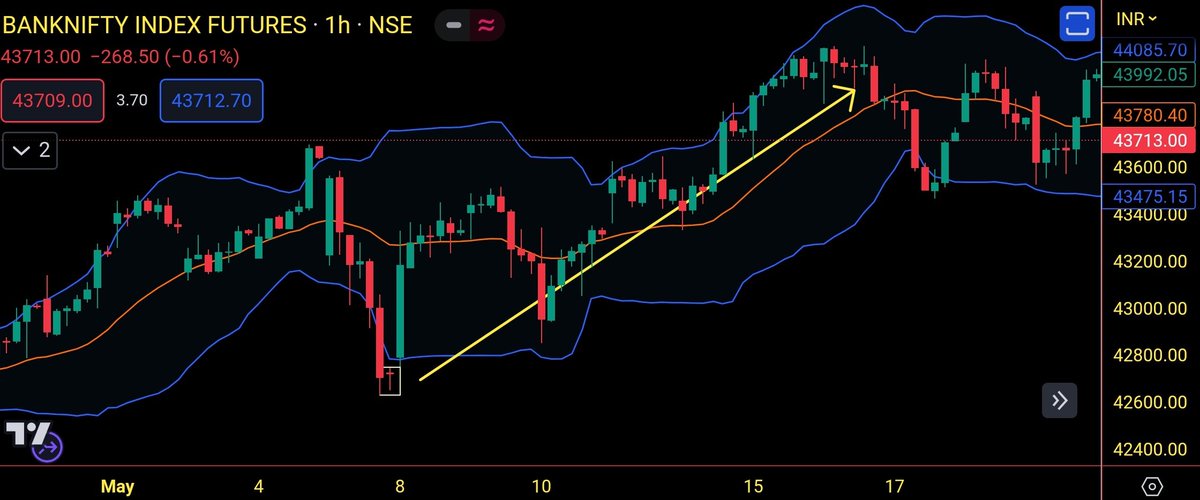
👉 Hammer candle at Lower Bollinger band
When a hammer candle is formed at the lower Bollinger band, it indicates the price will reverse from there.
In the image below, we can see an uptrend after a hammer candle (marked by a rectangle box) formation at the lower Bollinger band
When a hammer candle is formed at the lower Bollinger band, it indicates the price will reverse from there.
In the image below, we can see an uptrend after a hammer candle (marked by a rectangle box) formation at the lower Bollinger band
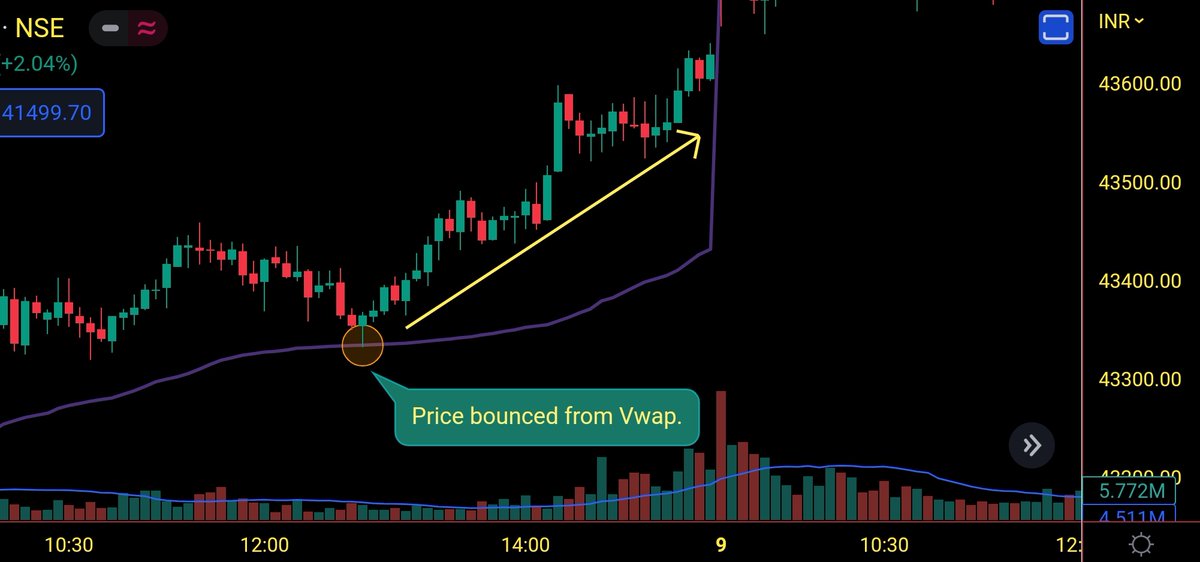
👉Hammer candle near Vwap
When a hammer candle is formed near VWAP, it indicates the price will change its direction from there.
In the image below, we can see an uptrend immediately after a hammer candle (marked by a circle) formation near VWAP.
When a hammer candle is formed near VWAP, it indicates the price will change its direction from there.
In the image below, we can see an uptrend immediately after a hammer candle (marked by a circle) formation near VWAP.
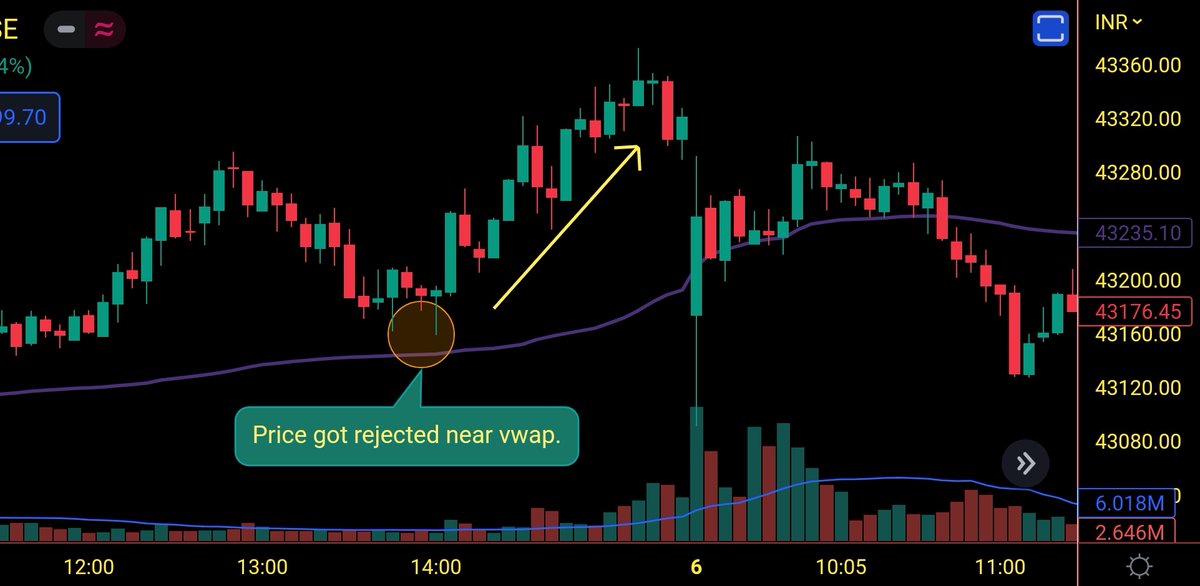
👉Hammer candle near Previous day Vwap
When a hammer candle is formed at the Previous day VWAP, it indicates an upside reversal.
In the image below, we can see a hammer candle (rectangle box) at the Previous day VWAP and then an upside rally as shown by the yellow arrow
When a hammer candle is formed at the Previous day VWAP, it indicates an upside reversal.
In the image below, we can see a hammer candle (rectangle box) at the Previous day VWAP and then an upside rally as shown by the yellow arrow
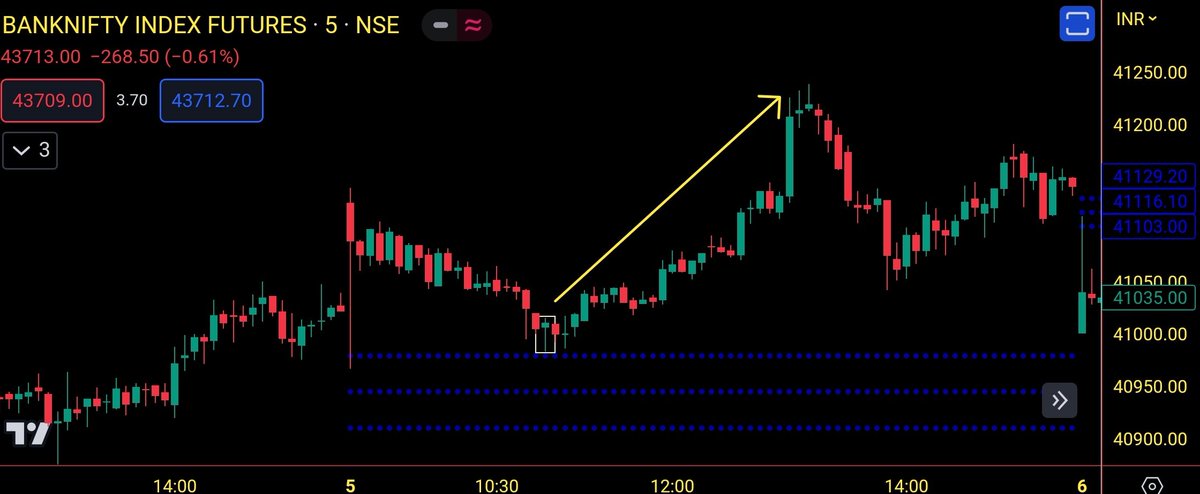
👉Hammer candle at CPR
When a hammer candle is formed at CPR(Central Pivot range), it indicates a change in direction.
In the image below, we can see a hammer candle (marked by a rectangle box) at CPR and then an upside movement as shown by the yellow arrow.
When a hammer candle is formed at CPR(Central Pivot range), it indicates a change in direction.
In the image below, we can see a hammer candle (marked by a rectangle box) at CPR and then an upside movement as shown by the yellow arrow.
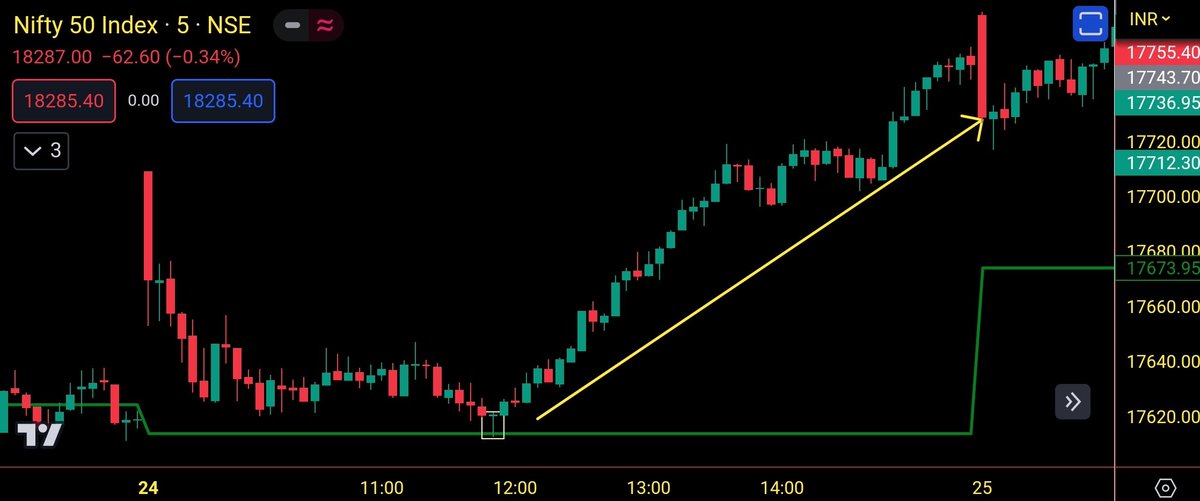
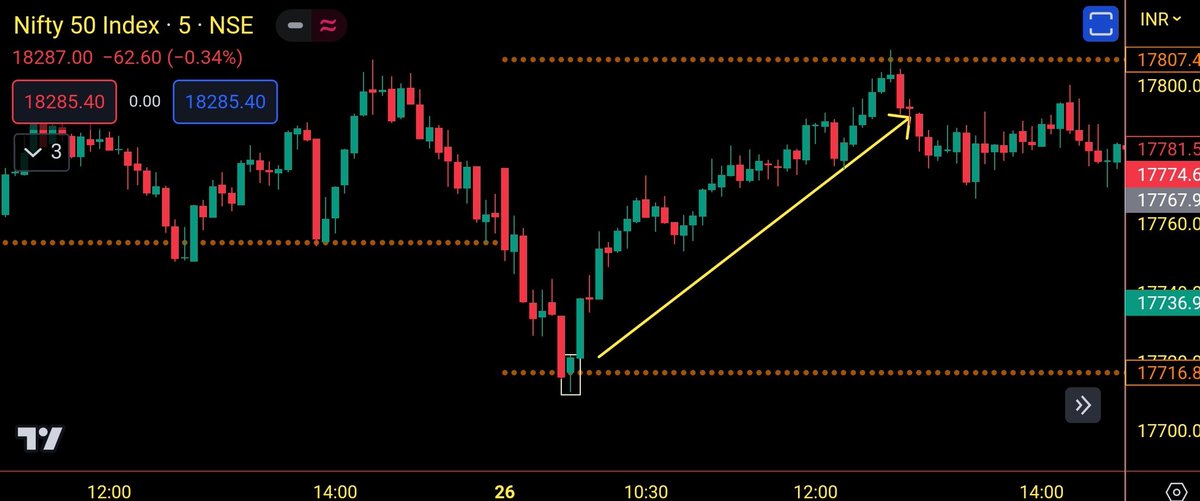
👉Hammer candle at the Previous day's low
When a hammer candle is formed at the previous day low, it suggests a change in direction.
In the image below,we can see a hammer candle (rectangle box) at previous day low, followed by an upside rally as marked by the yellow arrow.
When a hammer candle is formed at the previous day low, it suggests a change in direction.
In the image below,we can see a hammer candle (rectangle box) at previous day low, followed by an upside rally as marked by the yellow arrow.
📍Hammer candlestick scanner
Congratulations on making till here.
Here's a hammer candlestick outside the lower Bollinger band scanner.
chartink.com
Congratulations on making till here.
Here's a hammer candlestick outside the lower Bollinger band scanner.
chartink.com
📍Conclusion
Hammer candlestick success ratio is 65-70%, so one has to take losses quickly and keep trailing the winning trades, to win big.
The chances of winning are higher at the higher time frames.
Hammer candlestick success ratio is 65-70%, so one has to take losses quickly and keep trailing the winning trades, to win big.
The chances of winning are higher at the higher time frames.
That's a wrap!
If you enjoyed this thread:
1. Follow @me__kaushik for more threads relating to trading.
2. RT the first tweet of this thread for maximum reach.
Also, join our telegram channel for live market updates.t.me
If you enjoyed this thread:
1. Follow @me__kaushik for more threads relating to trading.
2. RT the first tweet of this thread for maximum reach.
Also, join our telegram channel for live market updates.t.me
Loading suggestions...