

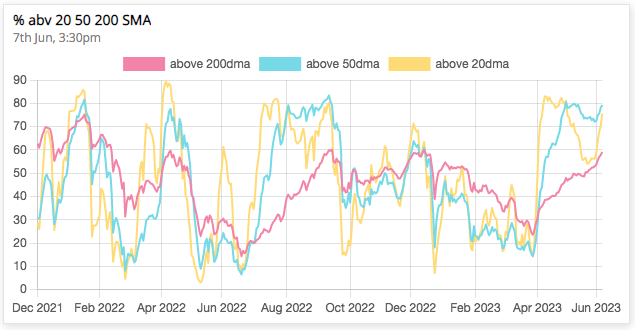
1. % stocks above key MAs shortterm medium term & longterm
All look bullish, Pointing UP.
All look bullish, Pointing UP.
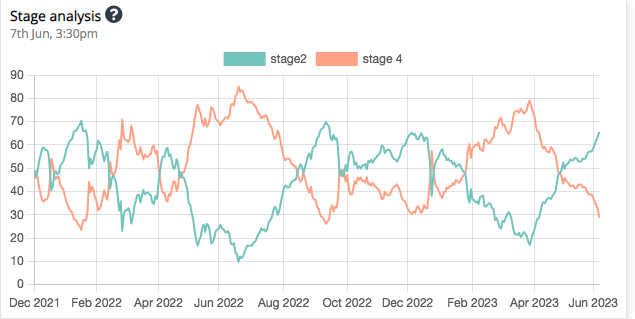
2. % Stocks in Stage 2 (or stage 4).
65% stocks in Stage 2 right now and increasing.
Bullish.
65% stocks in Stage 2 right now and increasing.
Bullish.
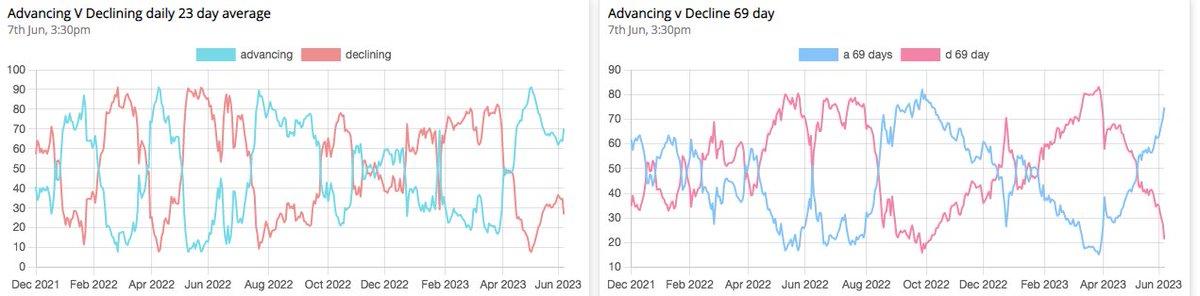
3. Advance Decline Line:
Medium and Longterm improving both
Medium and Longterm improving both
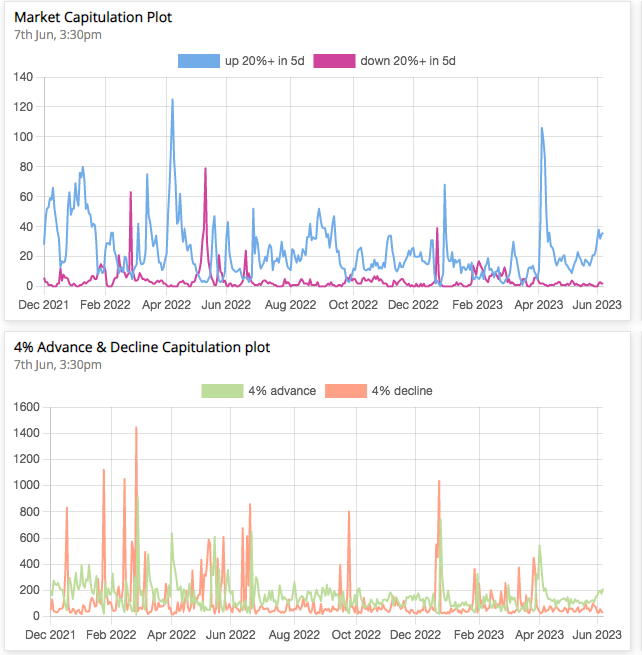
4. capitulation Plots:
Showing an increase in momentum
Showing an increase in momentum
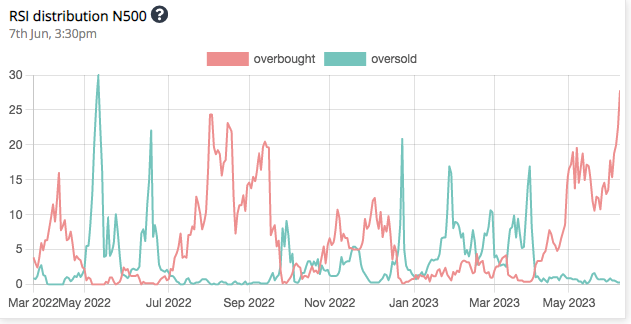
5. % of stocks in RSI overbought Territory.
~ 27%. Not a number to be overly worried.
~ 27%. Not a number to be overly worried.
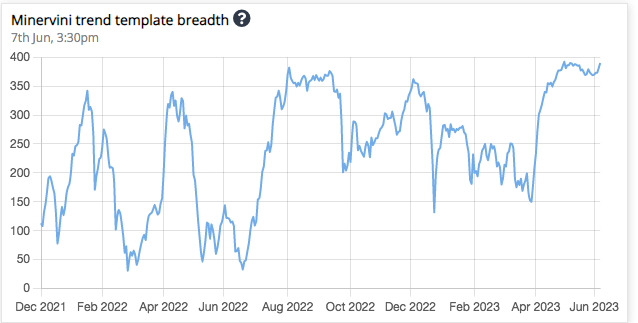
6. No. of stocks in the Minervini Trend Template
almost 20% of the NSE number and breaking out of a FLAG.
almost 20% of the NSE number and breaking out of a FLAG.
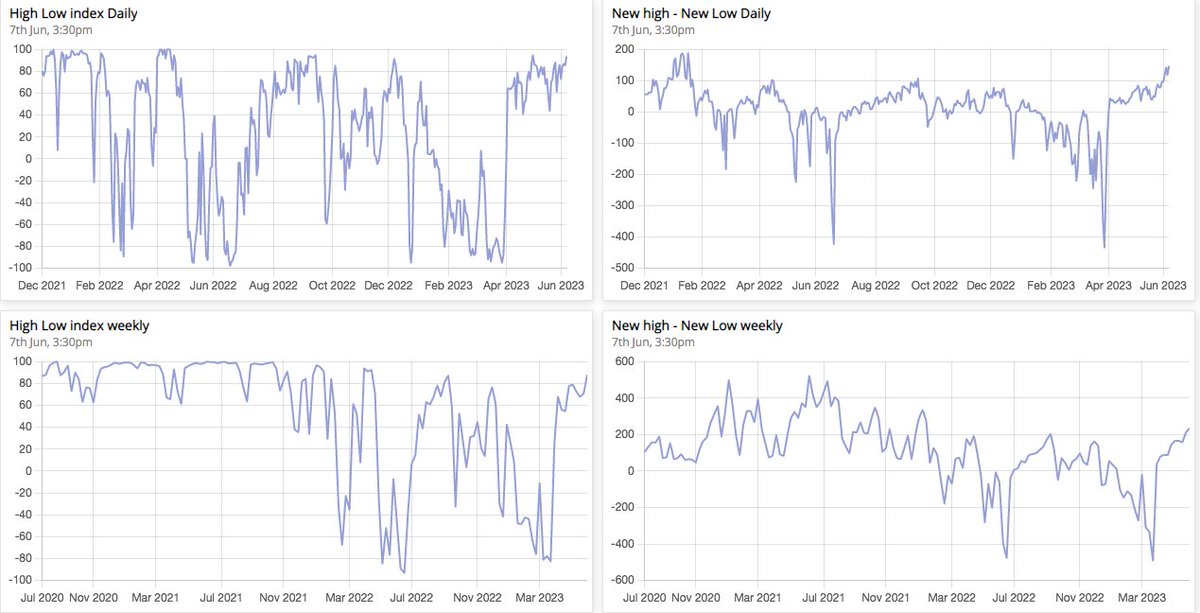
7. High low index (and Net high low):
All pointing upwards
All pointing upwards
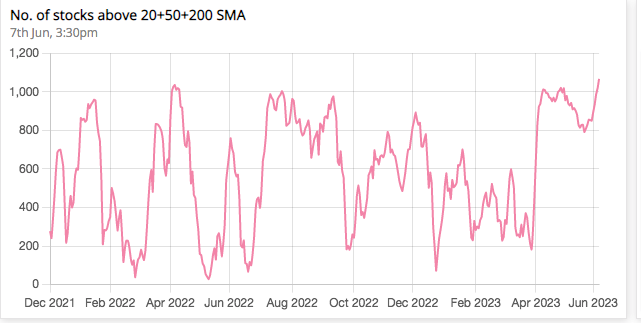
8. No of stocks above all Key MAs.
Pointing towards New highs.
Pointing towards New highs.
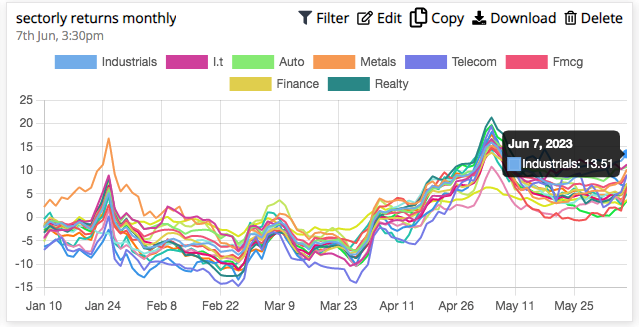
9. Outperforming Sectors:
Industrials, IT (mid & small)
Industrials, IT (mid & small)
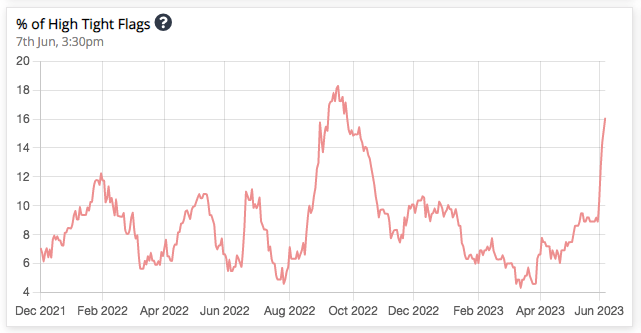
10. No. of High Tight Flag set-ups (eg Patel Eng)
To the moon
To the moon
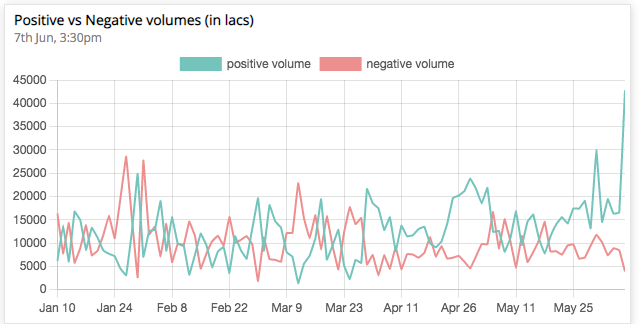
11. Positive vs Negative Volumes:
Positive increasing, negative declining
Shows Buying force is getting higher
Positive increasing, negative declining
Shows Buying force is getting higher
12
But you did not have to see this data as the indices are ripping higher every day.
Just trails the stops.
Don't predict the bearishness and act on it before you actually see it.
End of thread 🧵
But you did not have to see this data as the indices are ripping higher every day.
Just trails the stops.
Don't predict the bearishness and act on it before you actually see it.
End of thread 🧵
Found this thread useful?
Share it with your followers too, by liking and retweeting the 1st tweet
& follow me @SakatasHomma for more such clean, easy to understand Trading related bytes.
Share it with your followers too, by liking and retweeting the 1st tweet
& follow me @SakatasHomma for more such clean, easy to understand Trading related bytes.
Loading suggestions...