

If you are a beginner trader, you don't need to memorize all these candlestick patterns. Here's what you need to know:
🧵1/n
🧵1/n

A candlestick is a graphic representation of a summary of what price did within a defined period. E.g. a daily candlestick will show you the opening, closing, high, and low price for that day.
2/n
2/n
Seek to understand the following from a candlestick:
1. Who was in control- this can either be buyers (green) or sellers (red). It can also be neutral (doji).
3/n
1. Who was in control- this can either be buyers (green) or sellers (red). It can also be neutral (doji).
3/n
2. Seek to understand the range/spread of the candlestick. This refers to the difference btwn the high and low price of the candle relative to other candlesticks within a similar period. It can be low, medium, or high spread.
4/n
4/n
3. Sometimes, there's a huge war btwn buyers and sellers within a candlestick that results in huge tails/shadows. Long tails indicate failed attempts by buyers/sellers to dominate price. They may also indicate rejected price levels.
5/n
5/n
A sequence of candlesticks tells you a story of price action. For instance, it can be; Mon- EURUSD buyers pushed higher, Tue- buyers started losing momentum and a higher price level was rejected, Wen- buyers attempted to break the level again & failed, Thur- sellers dominated
6/n
6/n
Learn to spot previous levels where candlesticks were unable to break. We call them by many names and commonly support and resistance. They are levels where market sentiment changed previously.
7/n
7/n
Knowing this, you won't have to memorize any of the patterns above. You will understand the price action story and easily relate it with a support or resistance level.
8/n
8/n
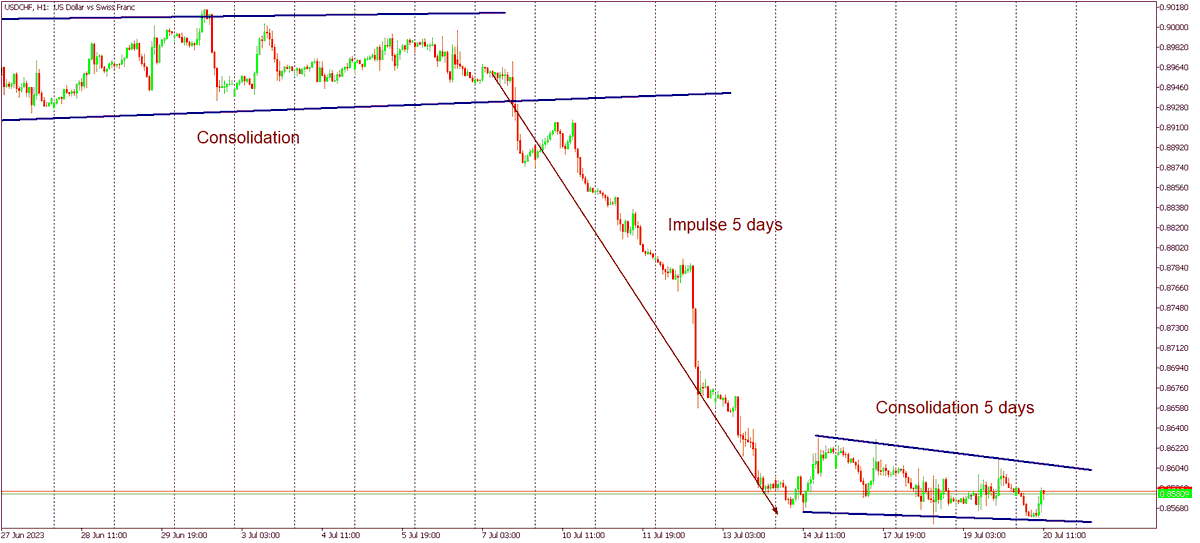
Lastly, understand that price are always in either of two phases; impulse or consolidation. Impulse is when there's a strong directional movement and consolidation is a period when price is moving sideways often with low volatility.
9/n
9/n
Your best chance of making money is when there's a strong directional movement. A selection of say 100 candlesticks analyzed well will tell you a story of when price was consolidating and when it was on impulse mode.
10/n
10/n
If you enjoyed the thread, follow, share, and consider opening an account with Kenya's #1 broker FXPesa.
A/c opening: bit.fxpesa.com
A/c opening: bit.fxpesa.com
And join my trading community here; t.me

Example: This USDCHF. The pair has been consolidating for the last 5 days. If you had a buy or sell position, you wouldn't make much since price is generally moving sideways. You want to be in when price is on impulse phase.
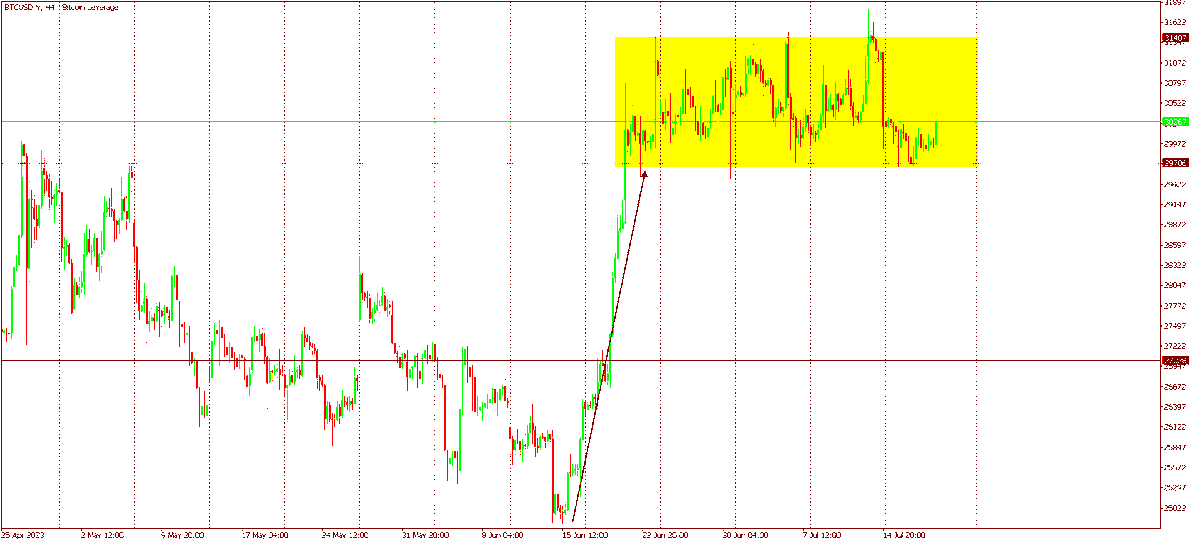
Another 1: Here is BTCUSD in a 4-week range. While some traders may enjoy trading within the range, the better opportunity is when it eventually breaks out of that range with strong directional movement similar to the price action just before it entered that range.
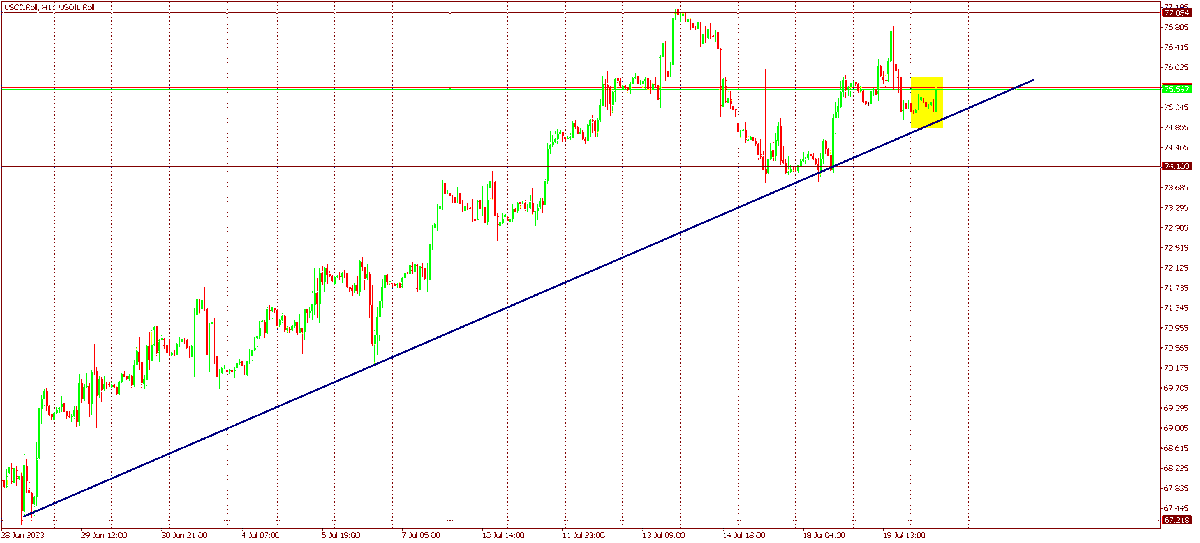
Parting shot: What does the last 11 H1 candlesticks in USOil #WTI tell you about its price action? Are we entering consolidation or impulse? What's the significane of the blue inclined line on the chart?
Loading suggestions...