

Looking for research gaps and open questions?
❌ Old way: Read and summarize literature
✅ New way: Leverage ChatGPT and AI-generated mind maps
This workflow takes only 10 minutes:
👇
❌ Old way: Read and summarize literature
✅ New way: Leverage ChatGPT and AI-generated mind maps
This workflow takes only 10 minutes:
👇

Here is what we are going to do:
1. Present our notes to ChatGPT
2. Ask it for a visual summary
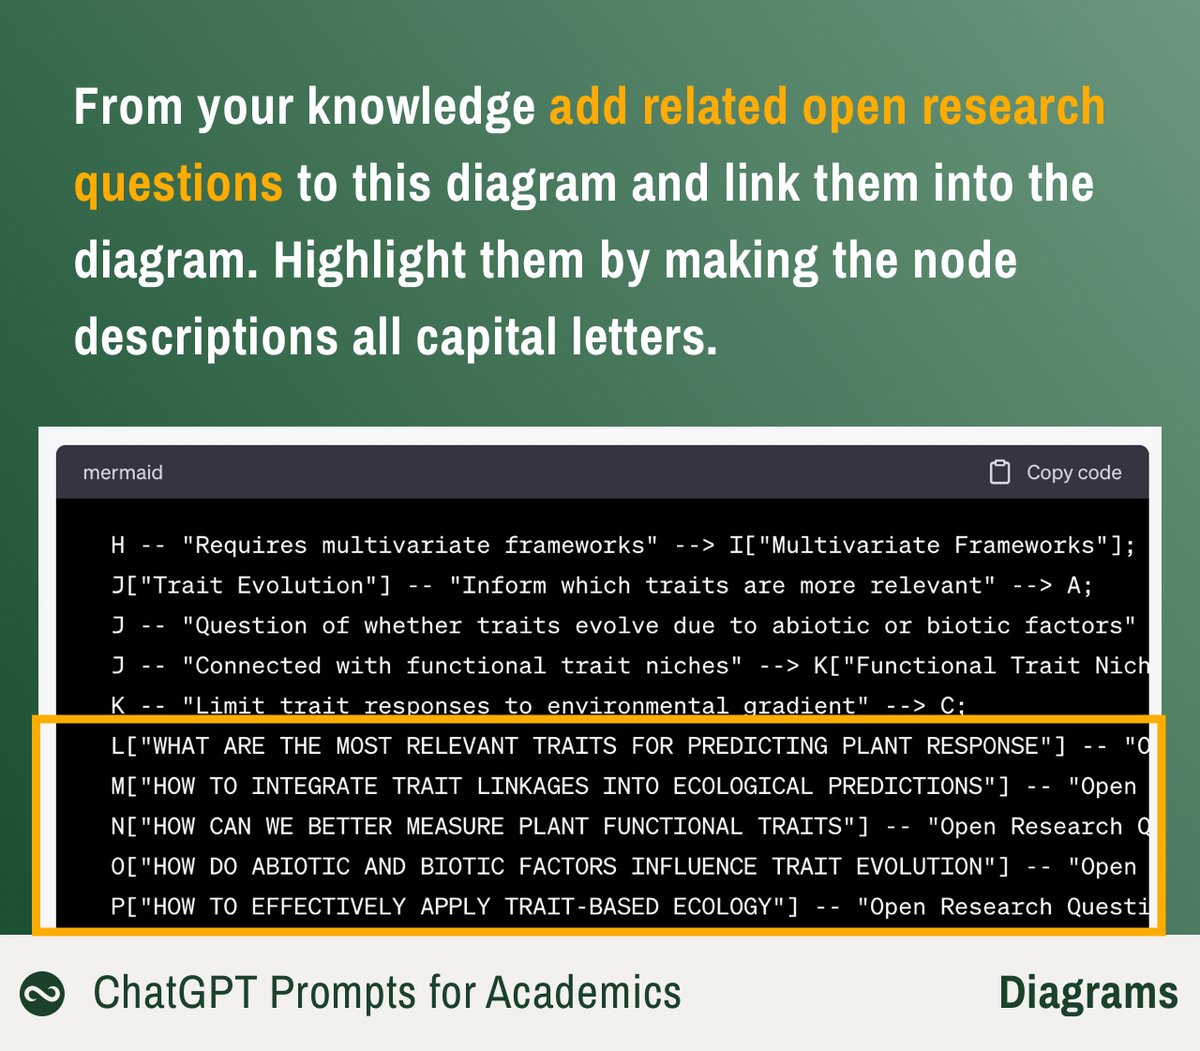
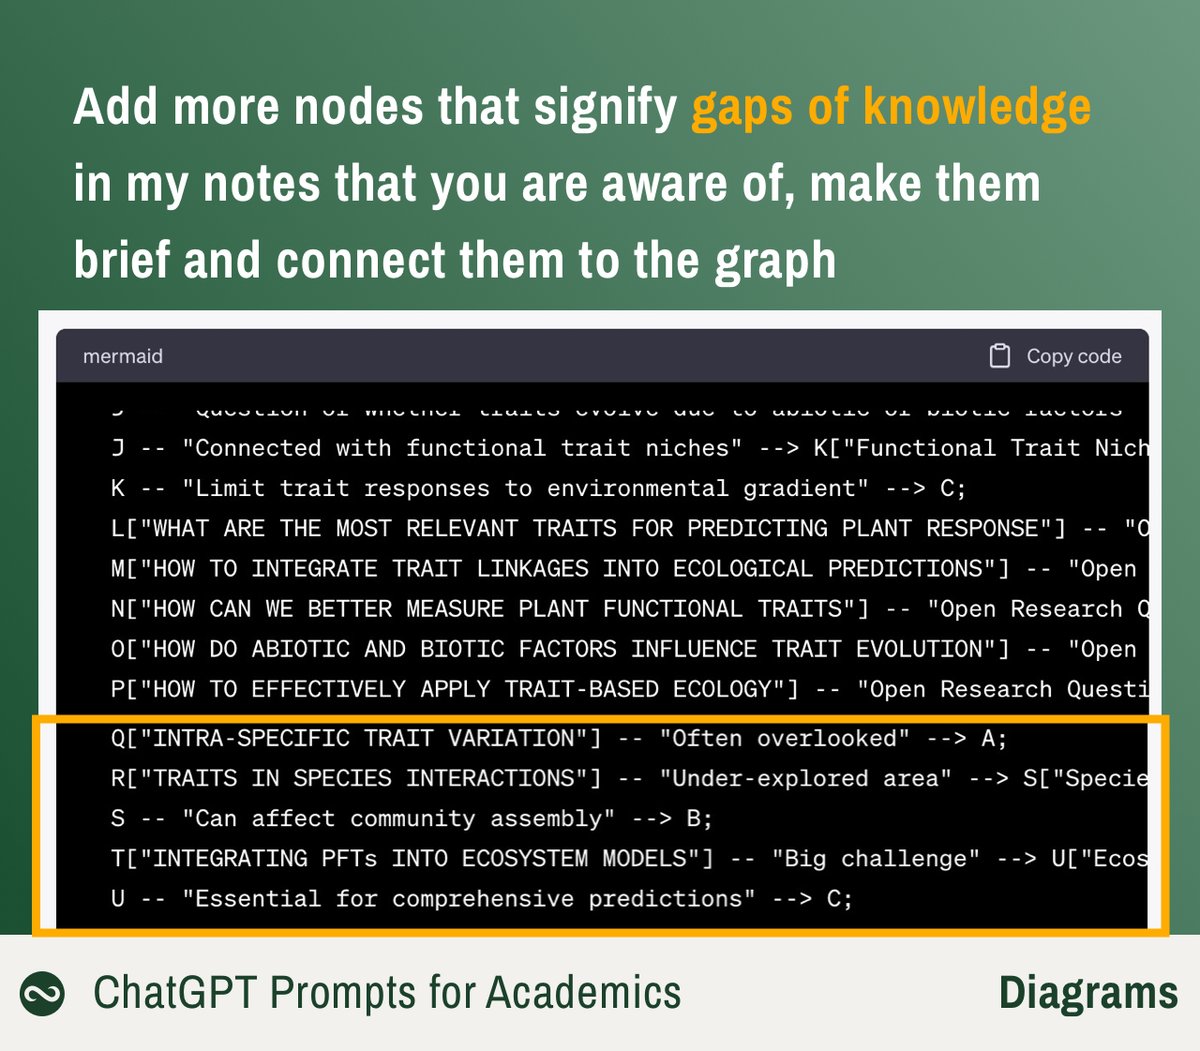
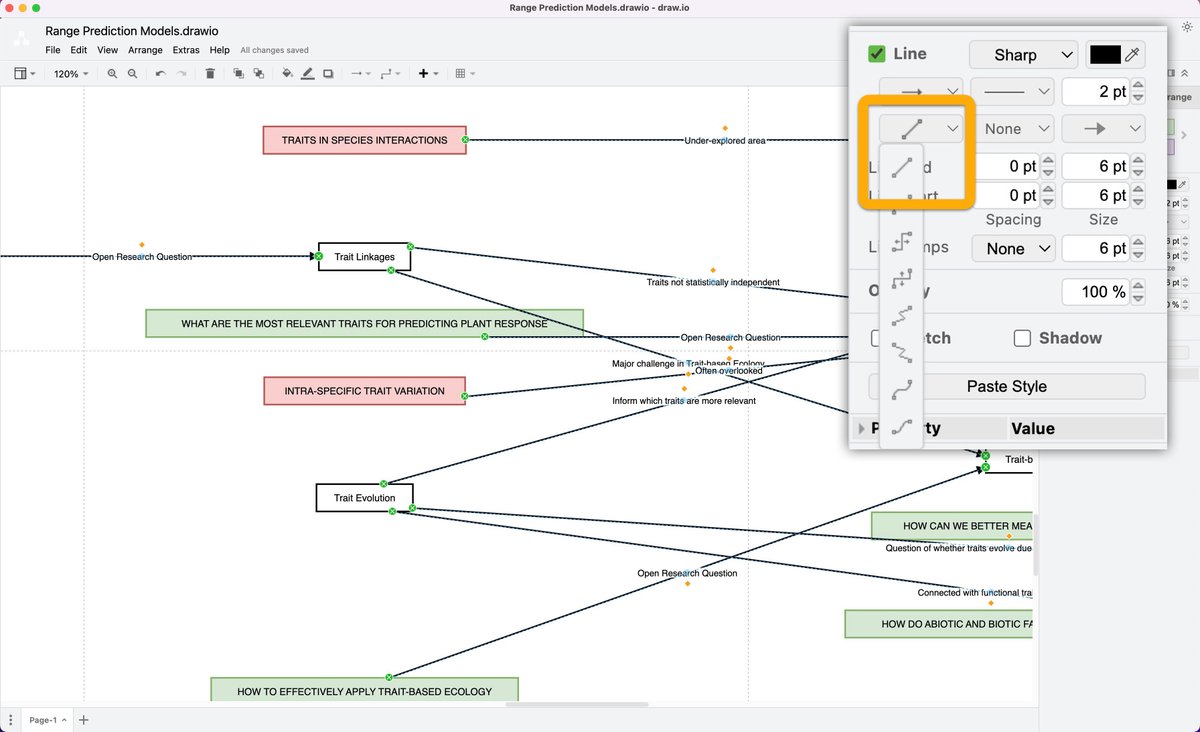
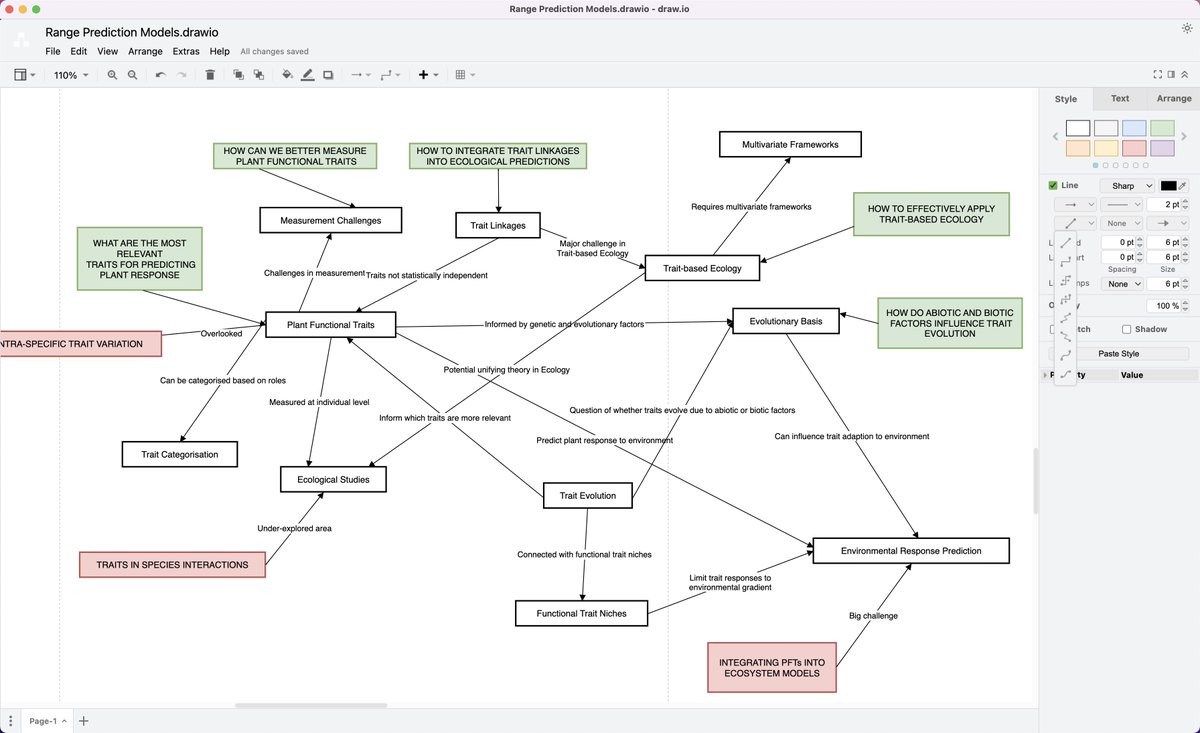
3. Ask it to identify RESEARCH QUESTIONS (green) and GAPS (red) using its vast knowledge base
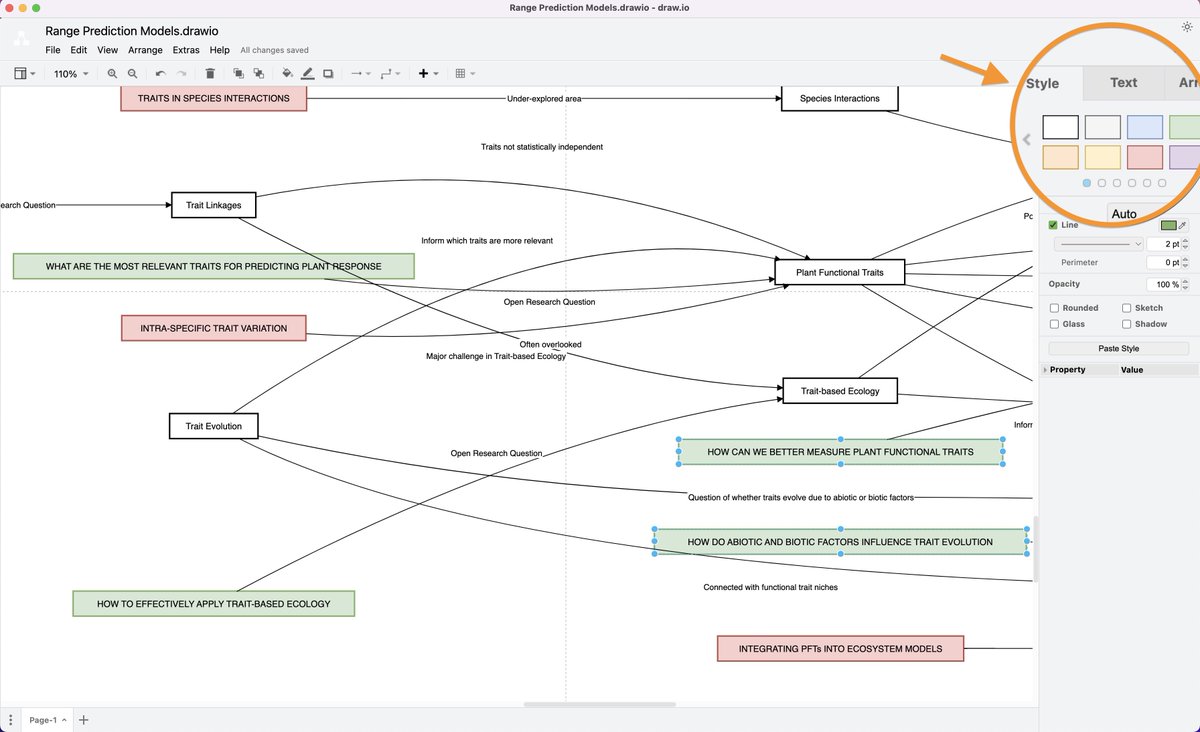
4. The styled diagram looks like this image and sums up a subset of my research.
1. Present our notes to ChatGPT
2. Ask it for a visual summary
3. Ask it to identify RESEARCH QUESTIONS (green) and GAPS (red) using its vast knowledge base
4. The styled diagram looks like this image and sums up a subset of my research.

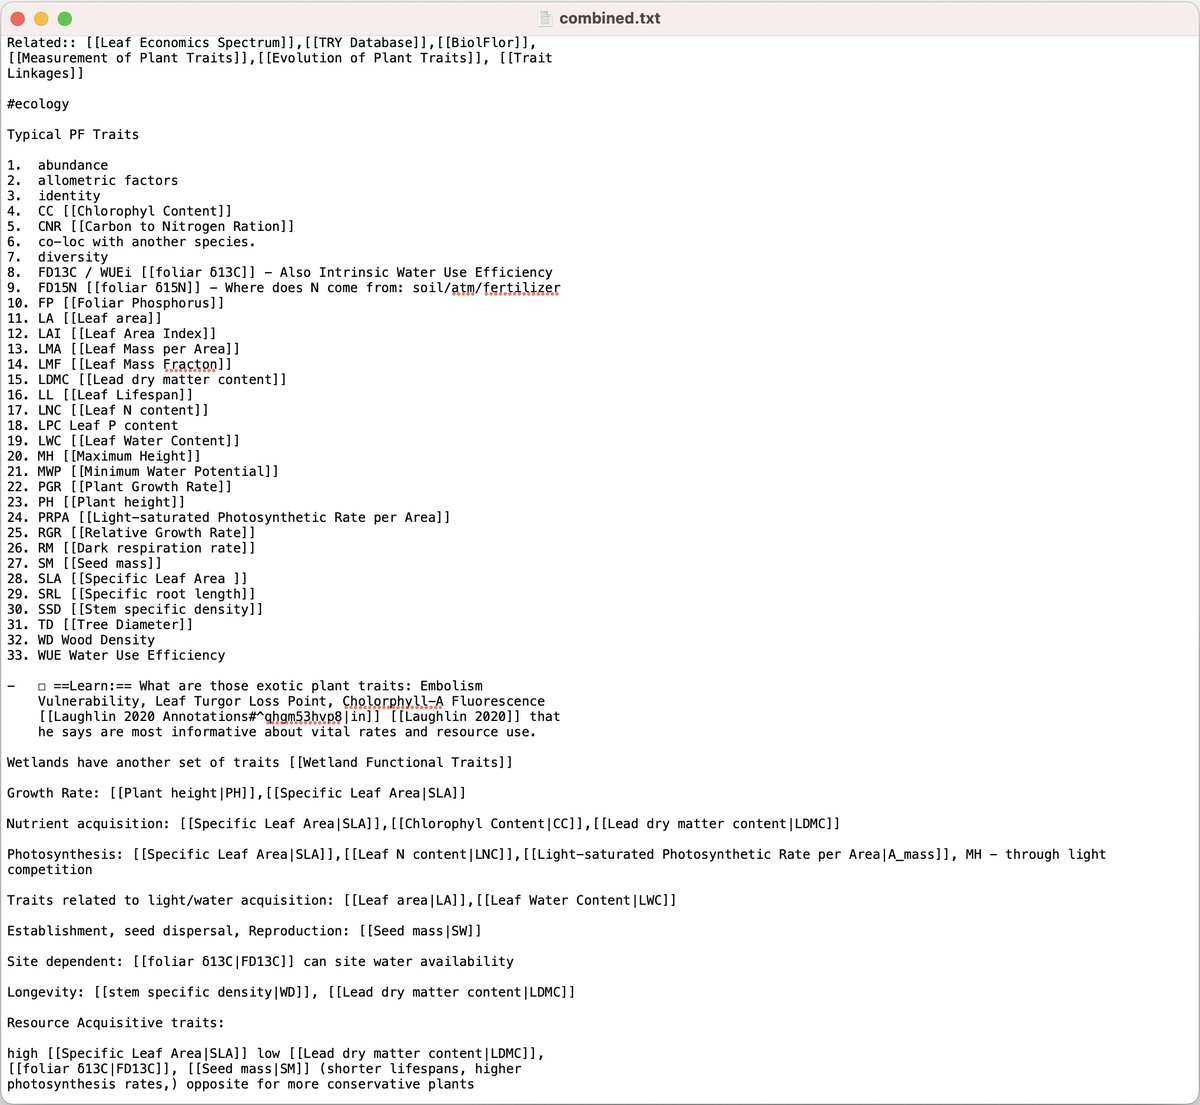
1. Let's add our notes to a text file.
For convenience I use the content of 7 notes I modified today and dumped them into a text file.
Remember: ChatGPT 3.5 has a limit of ~3000 words, GPT 4 ~25.000 words.
You can also take your manuscript or any other scientific text.
For convenience I use the content of 7 notes I modified today and dumped them into a text file.
Remember: ChatGPT 3.5 has a limit of ~3000 words, GPT 4 ~25.000 words.
You can also take your manuscript or any other scientific text.
2. First let's ask ChatGPT for a summary.
I just use the prompt "Summarise:" and copy and paste the notes.
You can see in the video that it is A LOT of text.
Pause in the last second of the video, to see how great and short the summary is.
I just use the prompt "Summarise:" and copy and paste the notes.
You can see in the video that it is A LOT of text.
Pause in the last second of the video, to see how great and short the summary is.

If you are looking to speed up your research with AI, join my workshop this weekend.
We will combine the most efficient tools for research you can use in 2023.
Details in the thread below:
We will combine the most efficient tools for research you can use in 2023.
Details in the thread below:
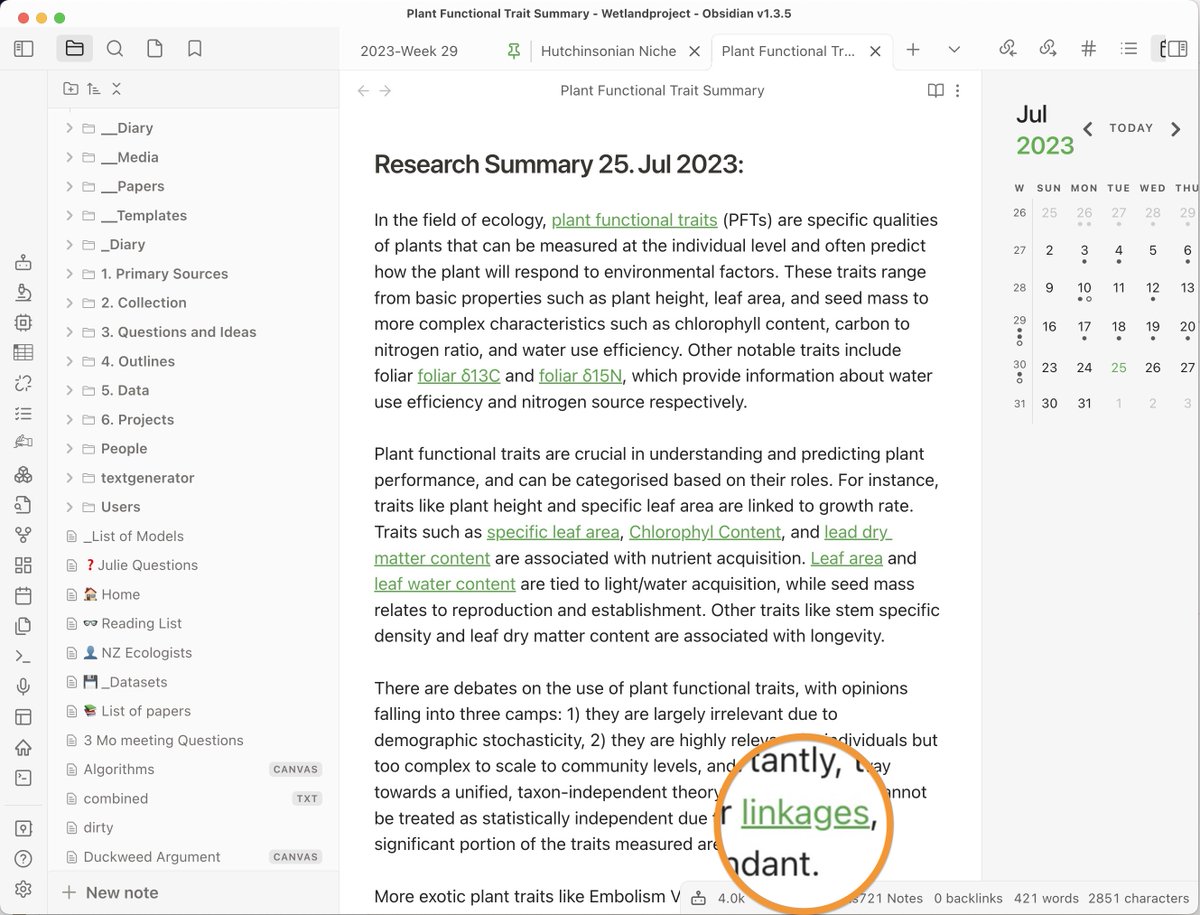
2b. Review
Use this summary to REVIEW your own research.
Because this summary is based on YOUR content, you can manually add links to the concept in your notes.
(I use @obsdmd for my notes)
Use this summary to REVIEW your own research.
Because this summary is based on YOUR content, you can manually add links to the concept in your notes.
(I use @obsdmd for my notes)
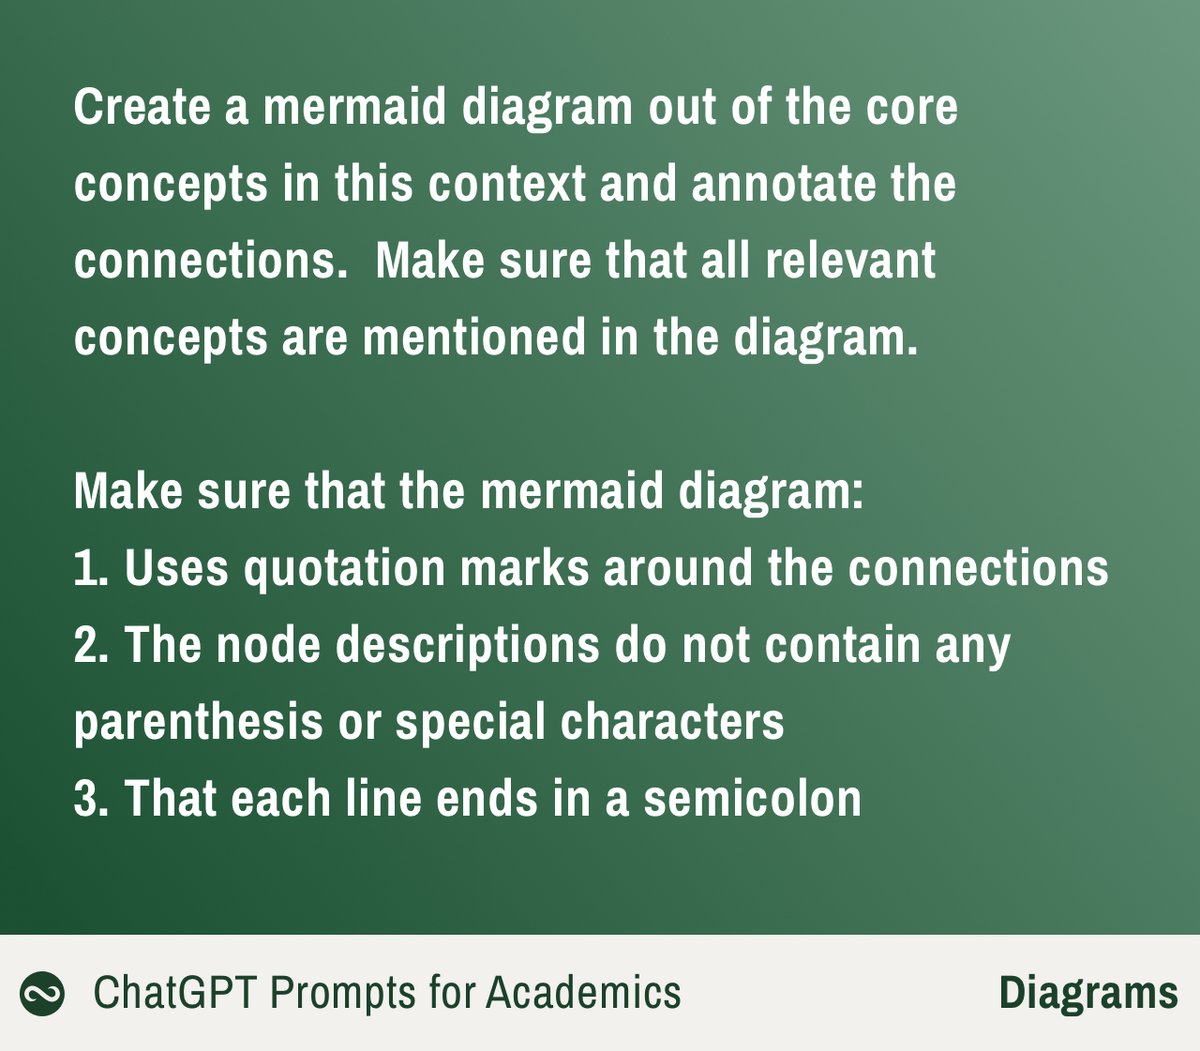
@obsdmd 2c. Visual Summary
We will ask for a MERMAID DIAGRAM. It is a text-based diagram format, that ChatGPT is very good at.
(You can copy and paste the entire prompt in the ALT description of the image)
We will ask for a MERMAID DIAGRAM. It is a text-based diagram format, that ChatGPT is very good at.
(You can copy and paste the entire prompt in the ALT description of the image)
@obsdmd 2d. Result
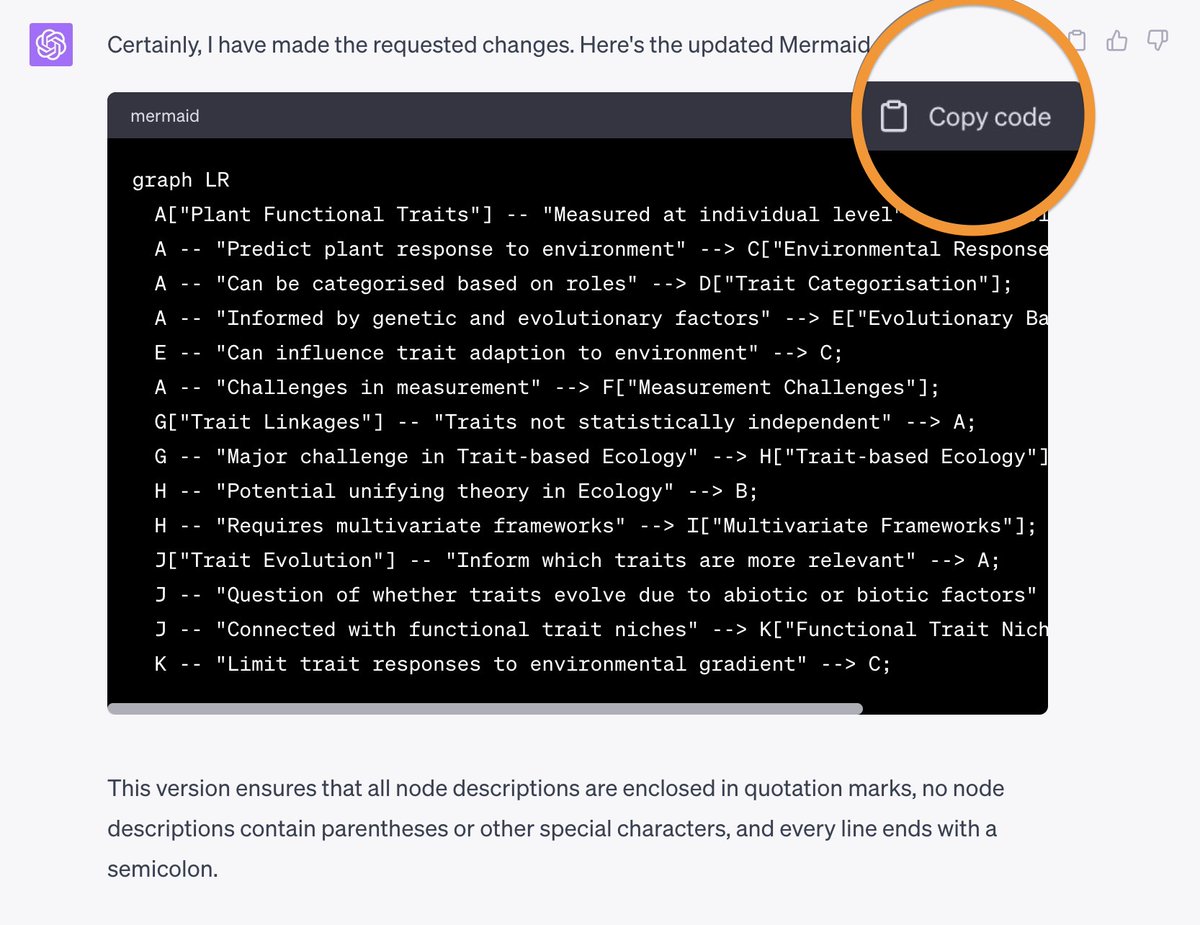
ChatGPT will give you this cryptic looking code.
Copy it with the button at the top right.
ChatGPT will give you this cryptic looking code.
Copy it with the button at the top right.


Loading suggestions...