

In 1928 and 2006, the yield curve inverted but stocks rallied and unemployment was low
The 2023 environment seems no different
A thread comparing historical inversions 🧵
The 2023 environment seems no different
A thread comparing historical inversions 🧵
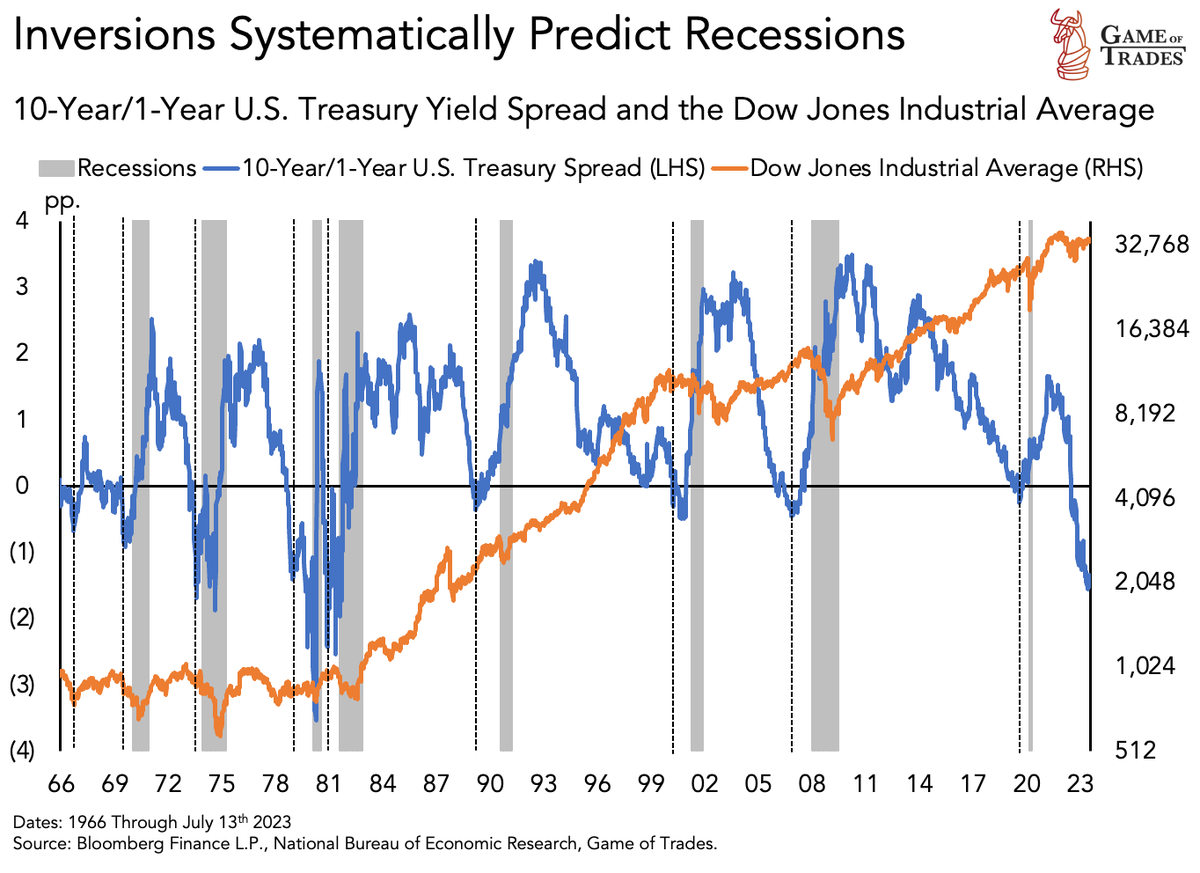
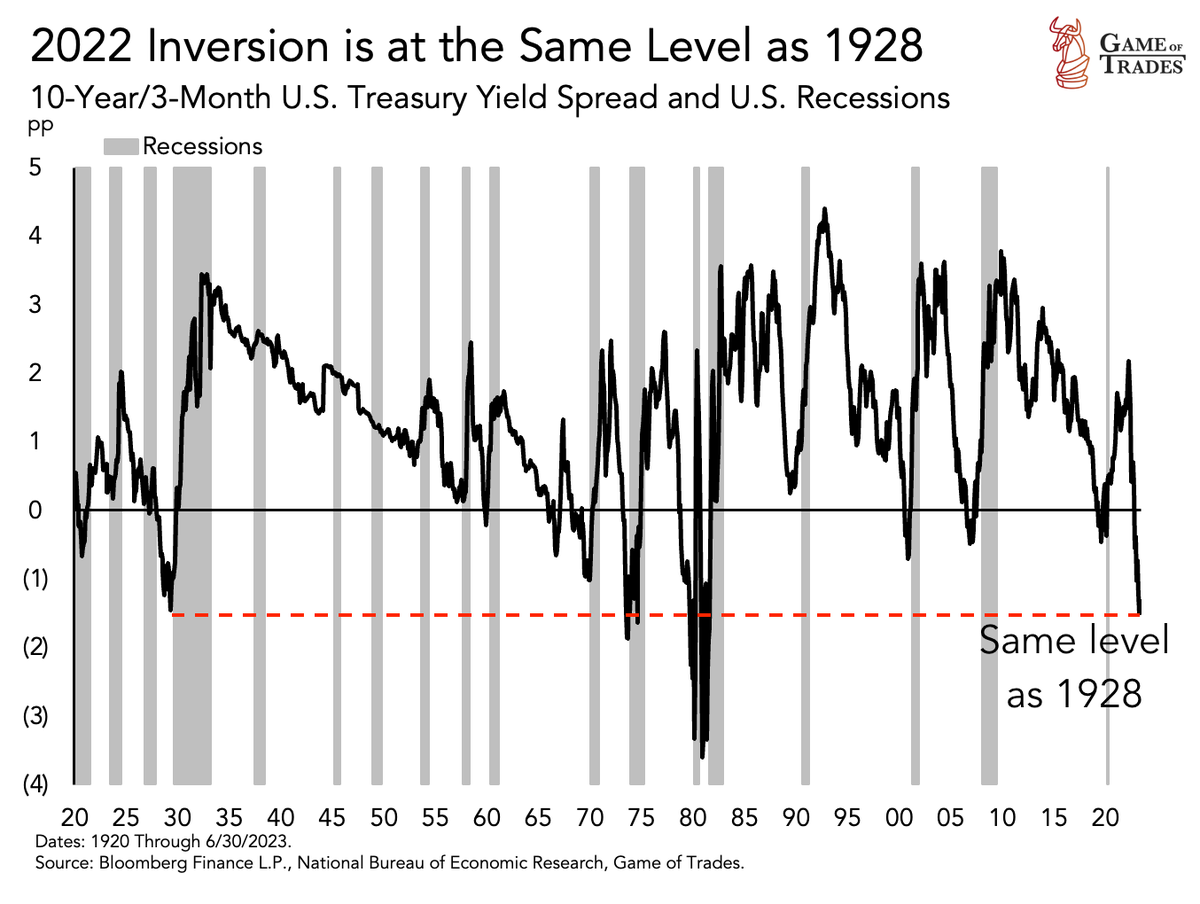
2/ An inverted yield curve, a scenario where long-term interest rates fall below short-term rates, often foreshadows a recession
Let's delve into a comparative analysis of 5 key inversion periods with the 2022/2023 inversion:
- 1928
- 1970s
- 1989
- 2000
- 2006
Let's delve into a comparative analysis of 5 key inversion periods with the 2022/2023 inversion:
- 1928
- 1970s
- 1989
- 2000
- 2006
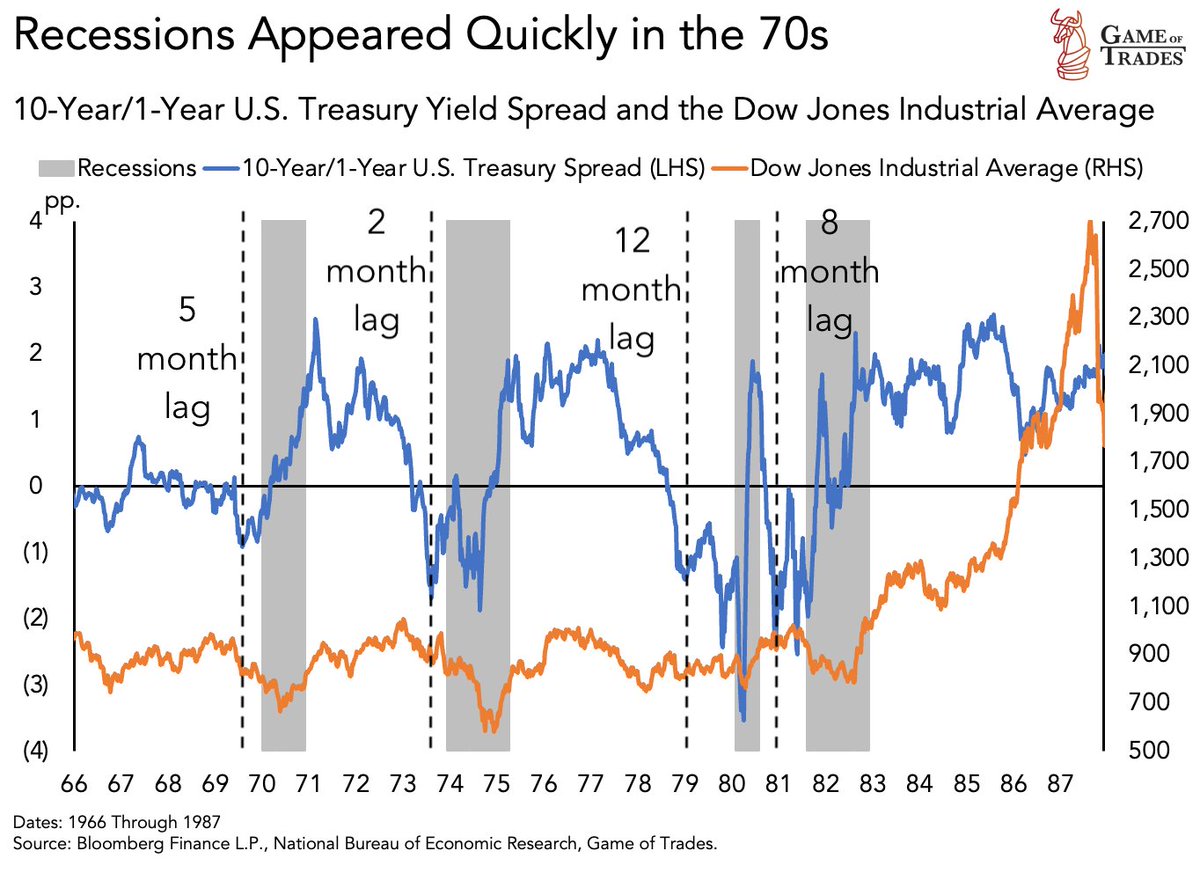
3/ During the 1960s and 1970s, recessions followed yield curve inversions relatively quickly, as evidenced in:
- 1969
- 1974
- 1979
- 1981
In each case, equities experienced a downturn
- 1969
- 1974
- 1979
- 1981
In each case, equities experienced a downturn
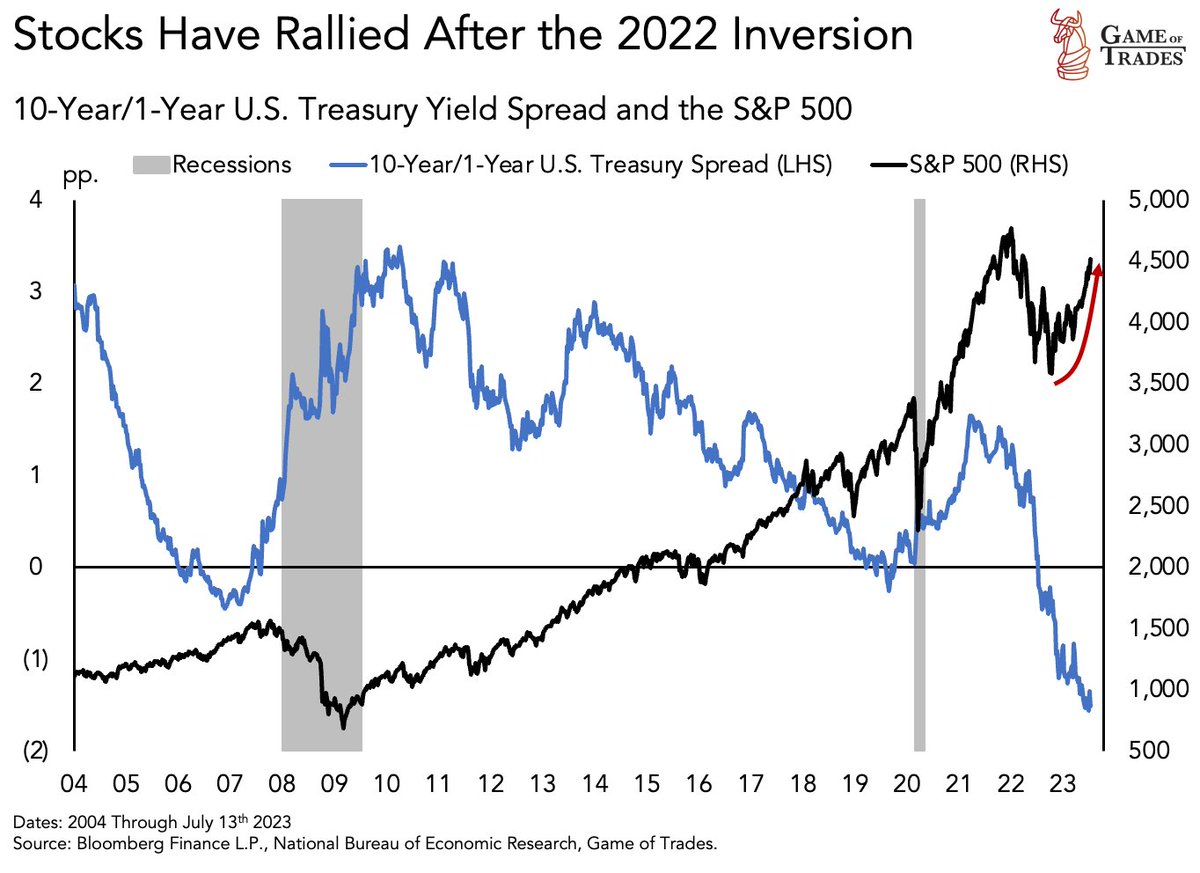
4/ However, today’s scenario doesn't mirror the 1970s
Despite the yield curve inversion in Aug 2022, markets continue to trend upwards 11 months later, with the economy still not entering a recession
Despite the yield curve inversion in Aug 2022, markets continue to trend upwards 11 months later, with the economy still not entering a recession
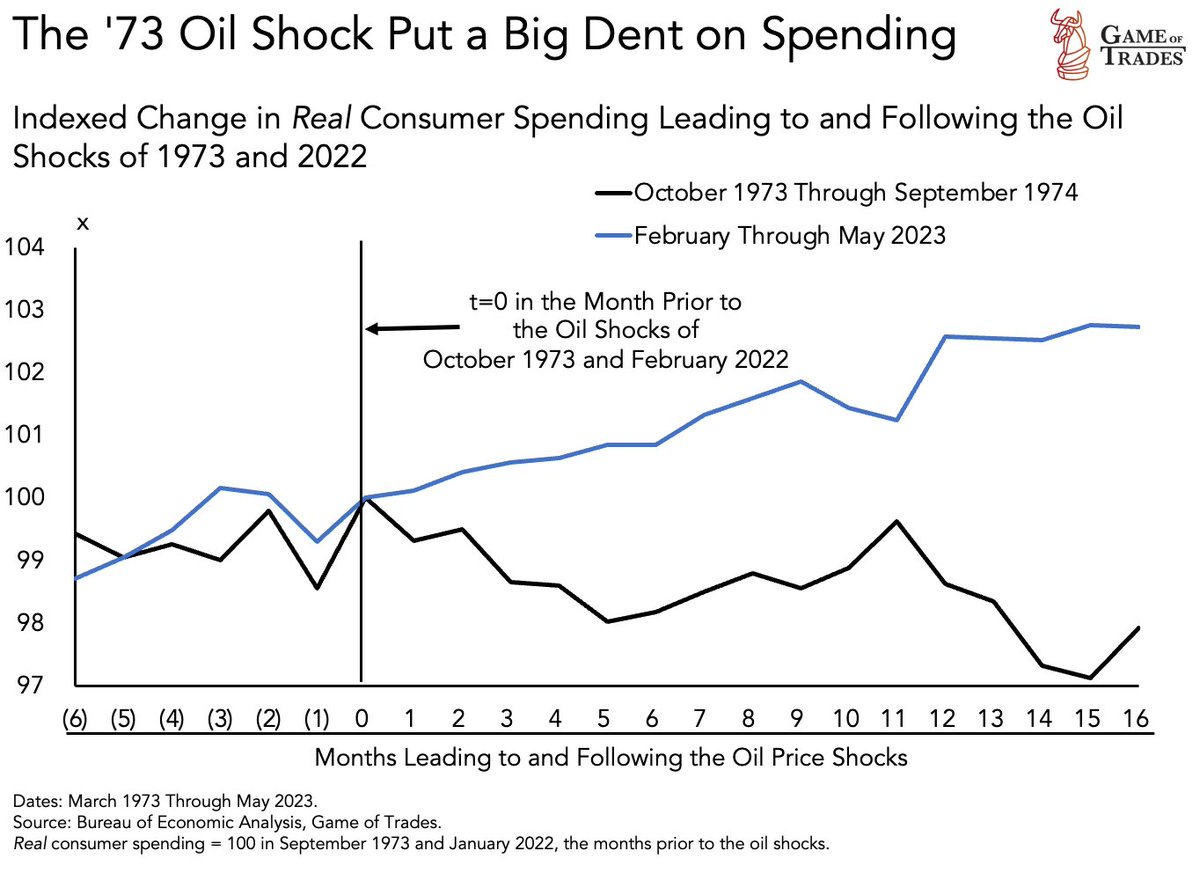
5/ A potential explanation for this divergence could be the oil shocks of the '70s
In 1973, oil prices surged from $3.5 to $10 within months
In 1973, oil prices surged from $3.5 to $10 within months
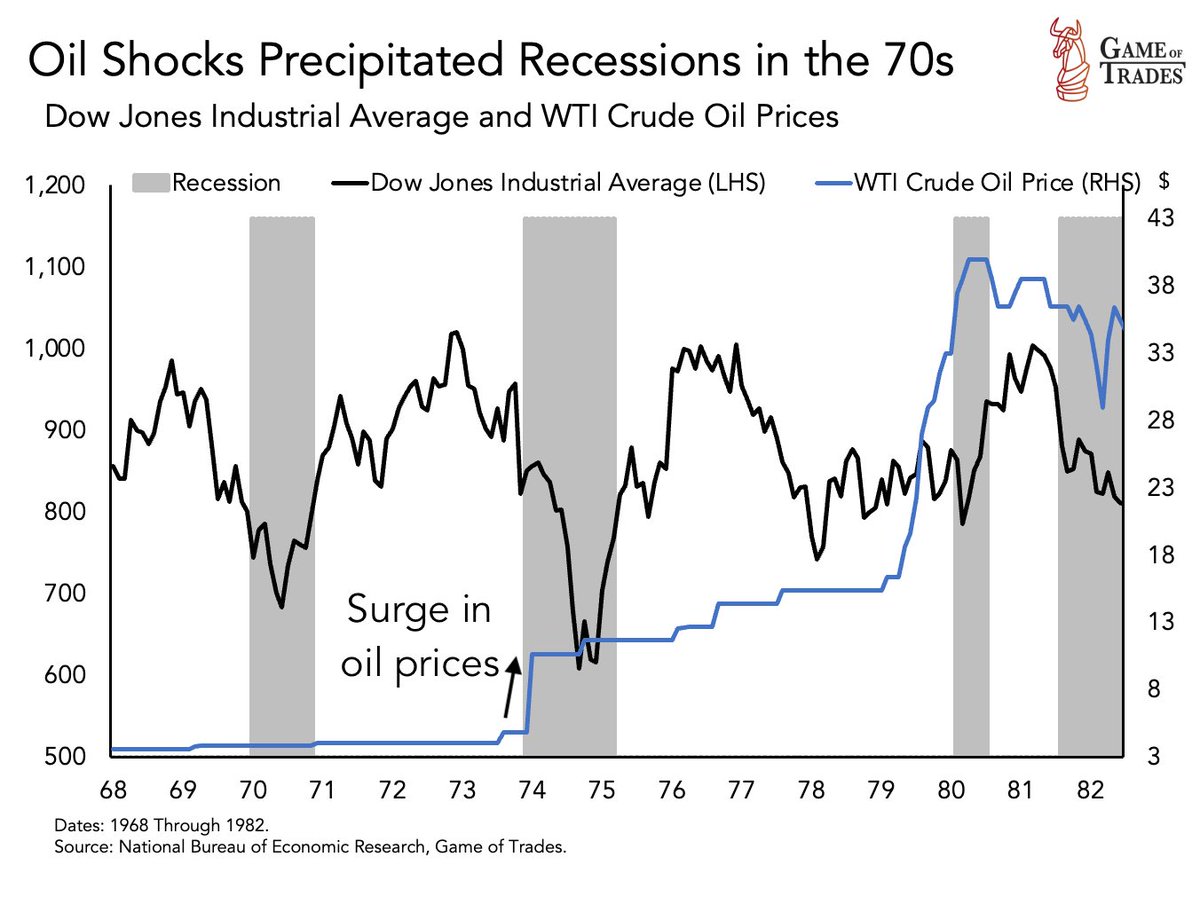
6/ The sudden rise in oil prices dampened consumer spending and triggered a recession
A similar pattern was observed in 1979
In contrast, consumer spending remained robust after the 2022 oil shock caused by the Ukraine war
A similar pattern was observed in 1979
In contrast, consumer spending remained robust after the 2022 oil shock caused by the Ukraine war
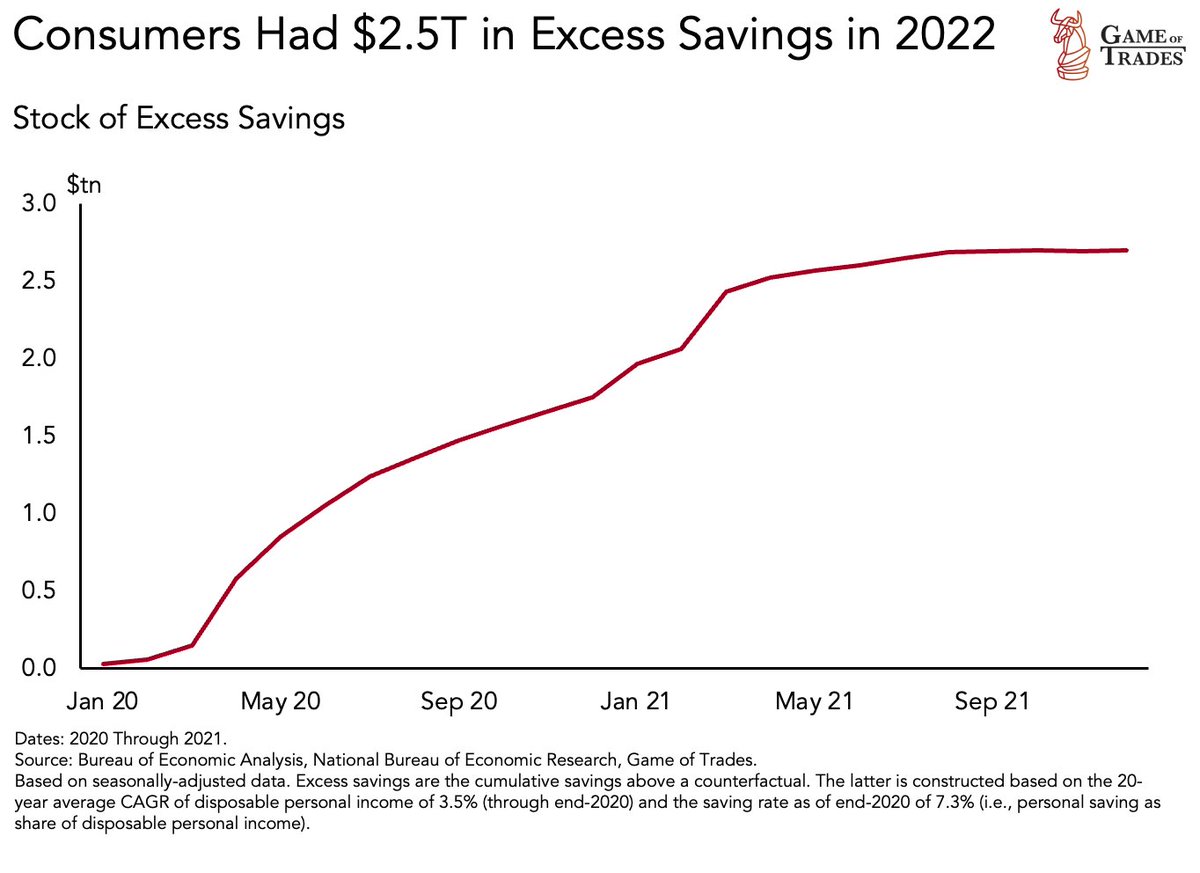
7/ The resilience of 2022 consumers can be attributed to the $2.5 trillion in excess savings accumulated during the Pandemic
Which could explain why a recession hasn't yet occurred
Which could explain why a recession hasn't yet occurred
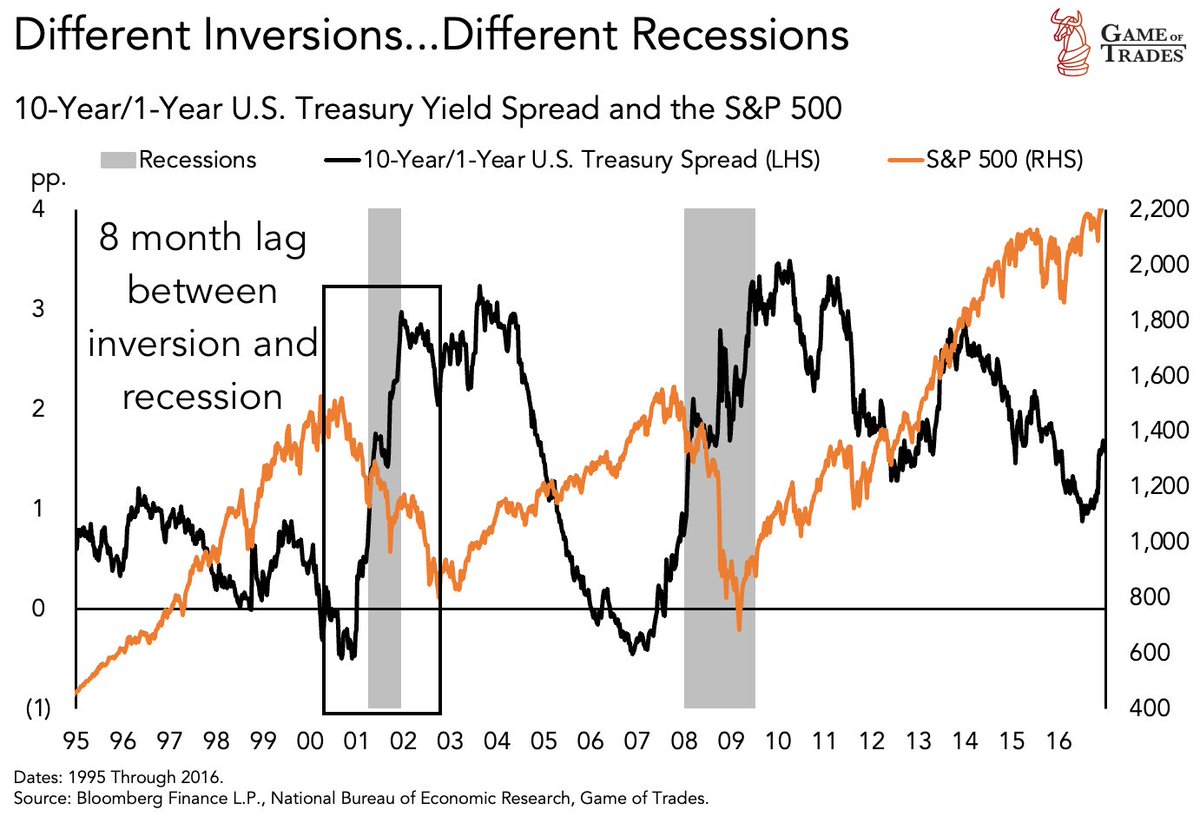
8/ In 2000, the recession began 8 months post-inversion
The stock market started declining immediately after the inversion, a dynamic starkly different from today's
The stock market started declining immediately after the inversion, a dynamic starkly different from today's
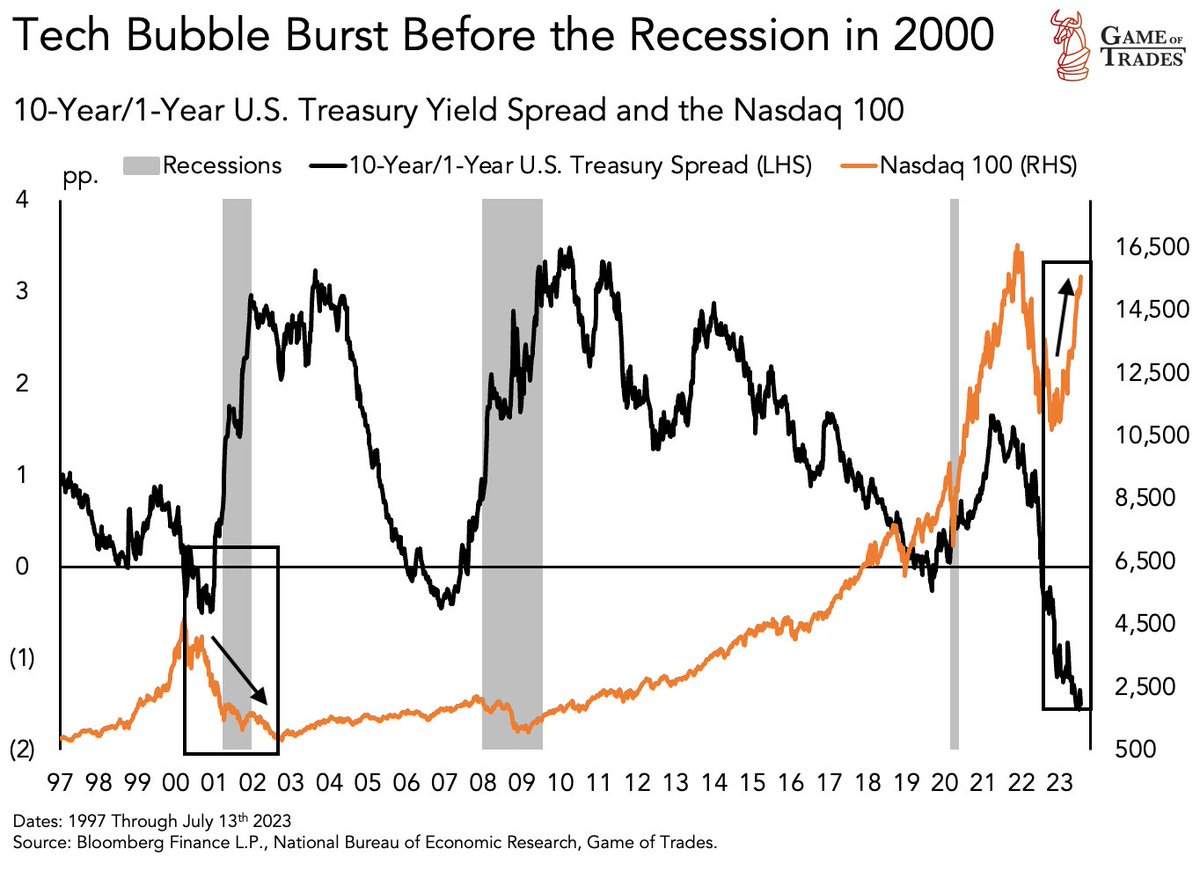
9/ The 2000 market downturn was further exacerbated by the Tech bust
In contrast, today's Tech stocks are thriving, fueled by the AI boom
In contrast, today's Tech stocks are thriving, fueled by the AI boom
10/ In 1989, the economy took a year to enter a recession post-inversion
During this period, equities rallied until the recession's onset
During this period, equities rallied until the recession's onset
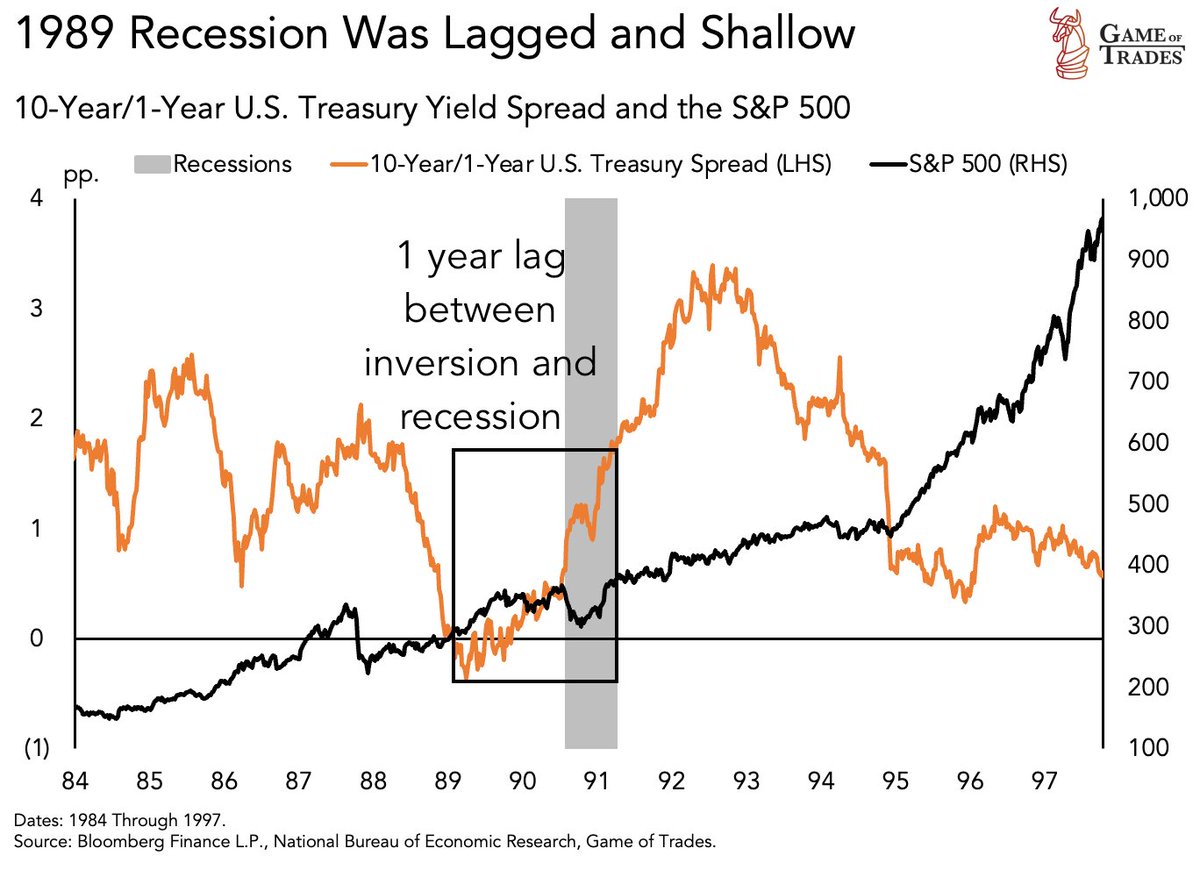
11/ Today's market mirrors the 1989 scenario, with markets rallying post-inversion
However, the depth of the 1989 inversion was brief and shallow (-0.5%), unlike today's
However, the depth of the 1989 inversion was brief and shallow (-0.5%), unlike today's
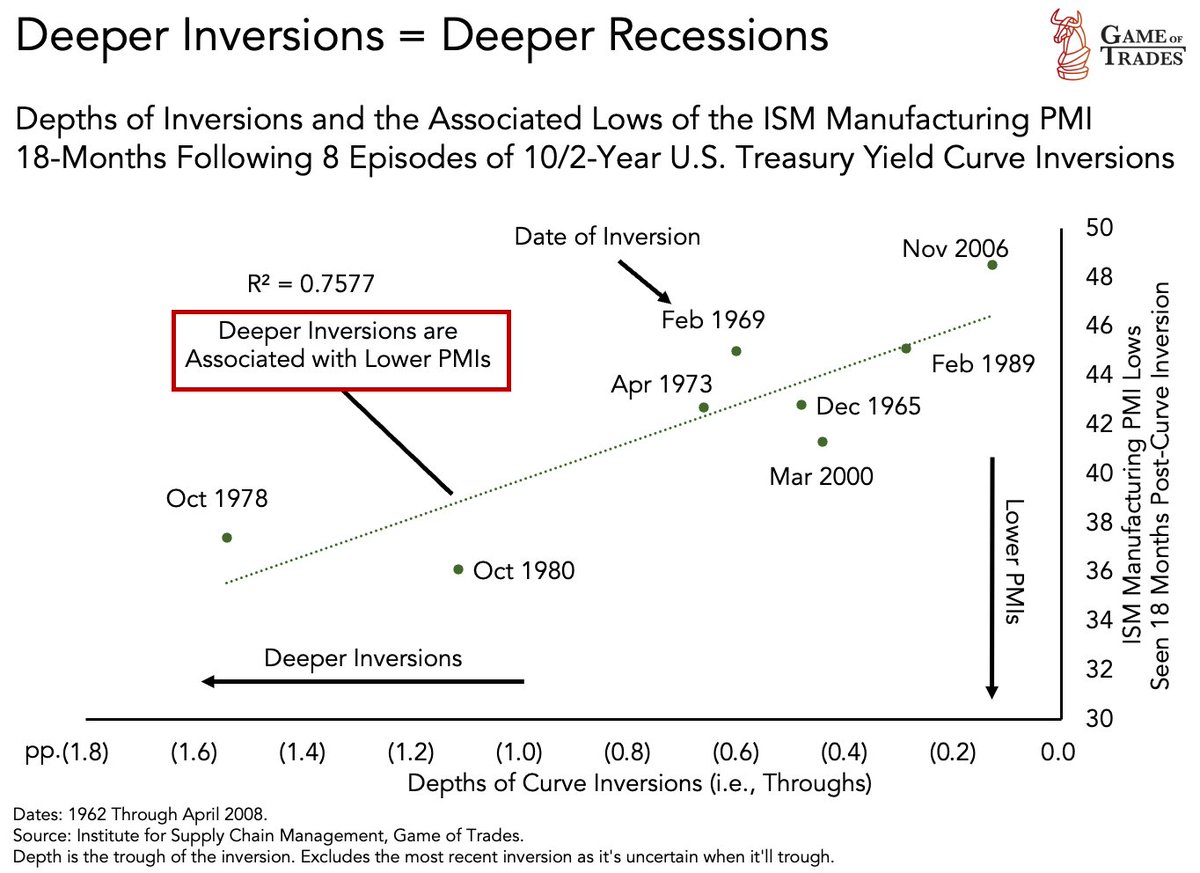
12/ The depth of an inversion can predict the severity of the ensuing recession
Deeper inversions typically result in lower manufacturing PMI (a measure of economic activity) in the subsequent 18 months
Deeper inversions typically result in lower manufacturing PMI (a measure of economic activity) in the subsequent 18 months
13/ In 2006, equities rallied for about 1.5 years post-inversion
The economy remained strong, and unemployment rates were low, similar to today's conditions
The rally was followed by a significant market downturn as the Financial Crisis unfolded
The economy remained strong, and unemployment rates were low, similar to today's conditions
The rally was followed by a significant market downturn as the Financial Crisis unfolded
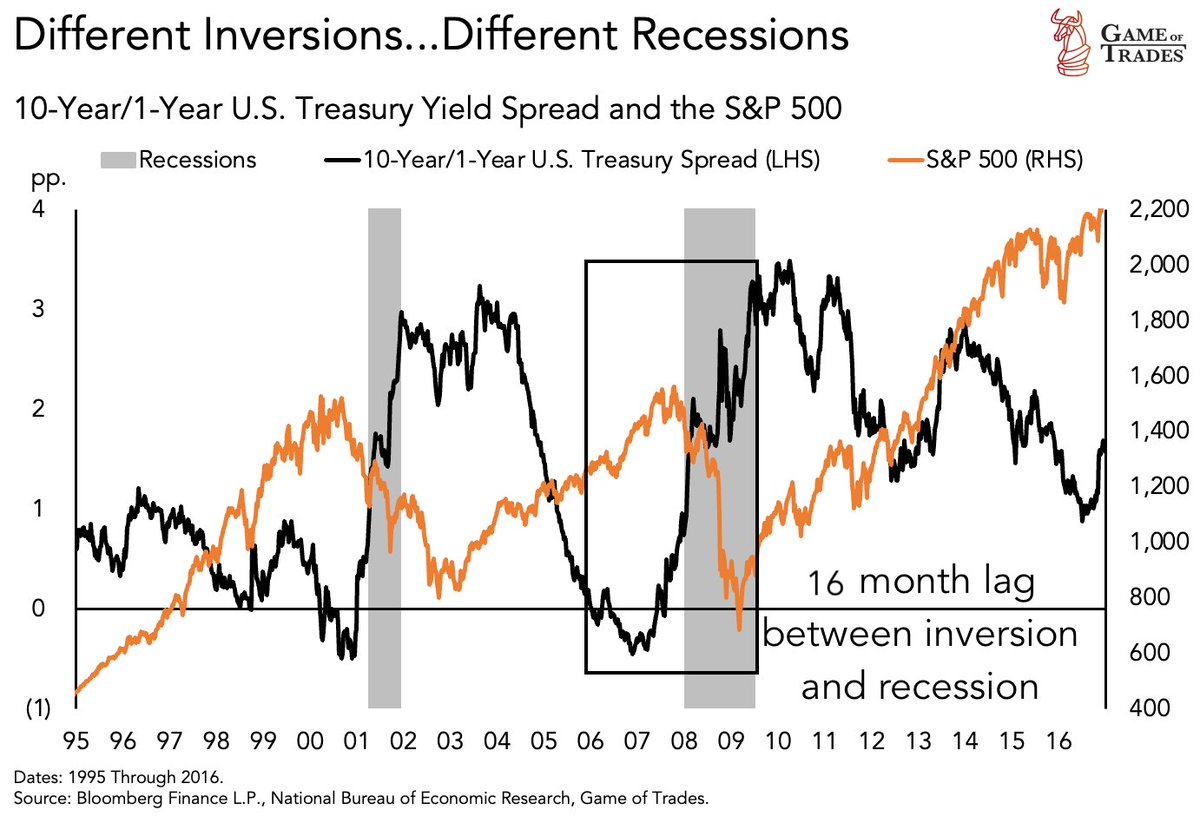
14/ The 2006 recession taught us that a strong economy before a downturn doesn't necessarily mean a less severe recession
If we follow the same path, stocks could continue to rise for another 7 months before a recession hits
If we follow the same path, stocks could continue to rise for another 7 months before a recession hits
15/ The 1928 inversion followed a similar pattern, with markets rallying for 1.5 years post-inversion until the recession began
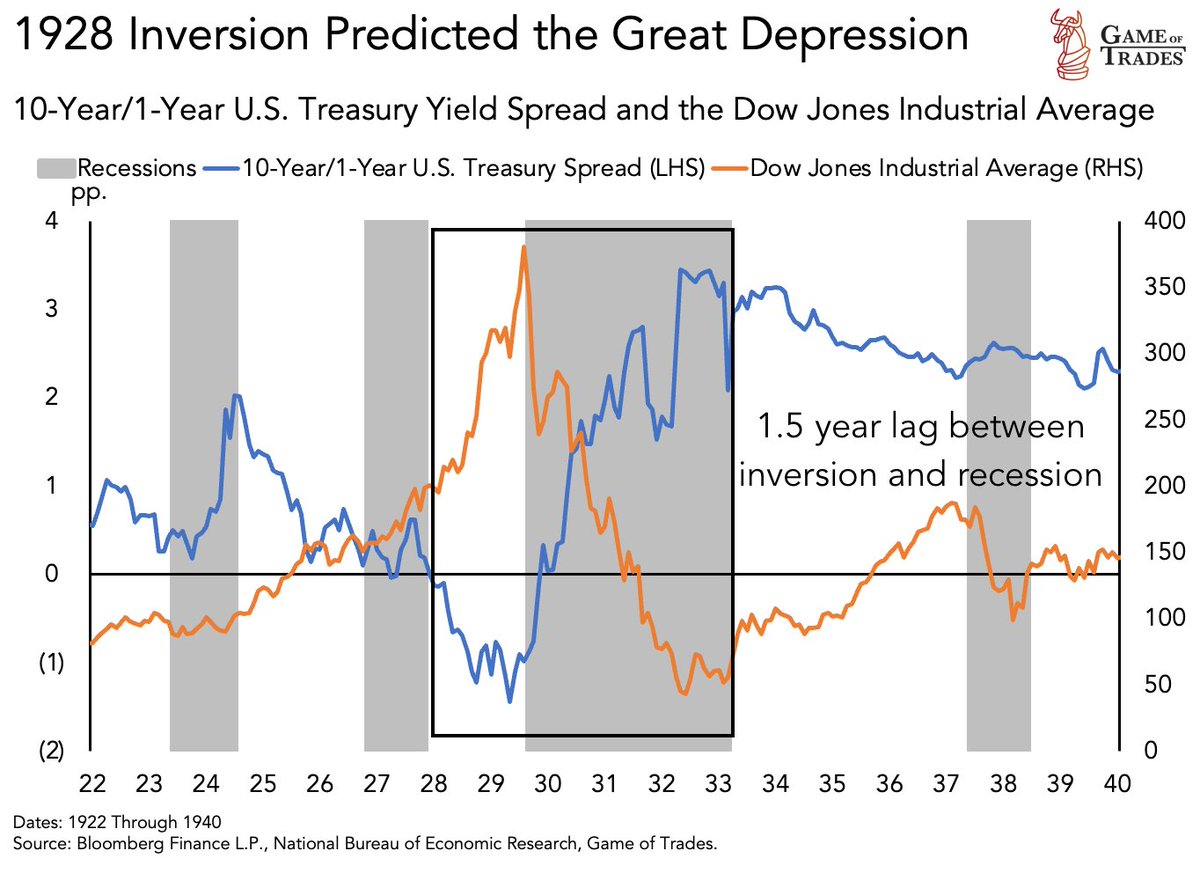
16/ Despite low unemployment rates (0 - 3%) during an inversion in the 1.5 years leading up to the 1929 Great Depression, the recession saw unemployment skyrocket to 25% and equities decline by 80%
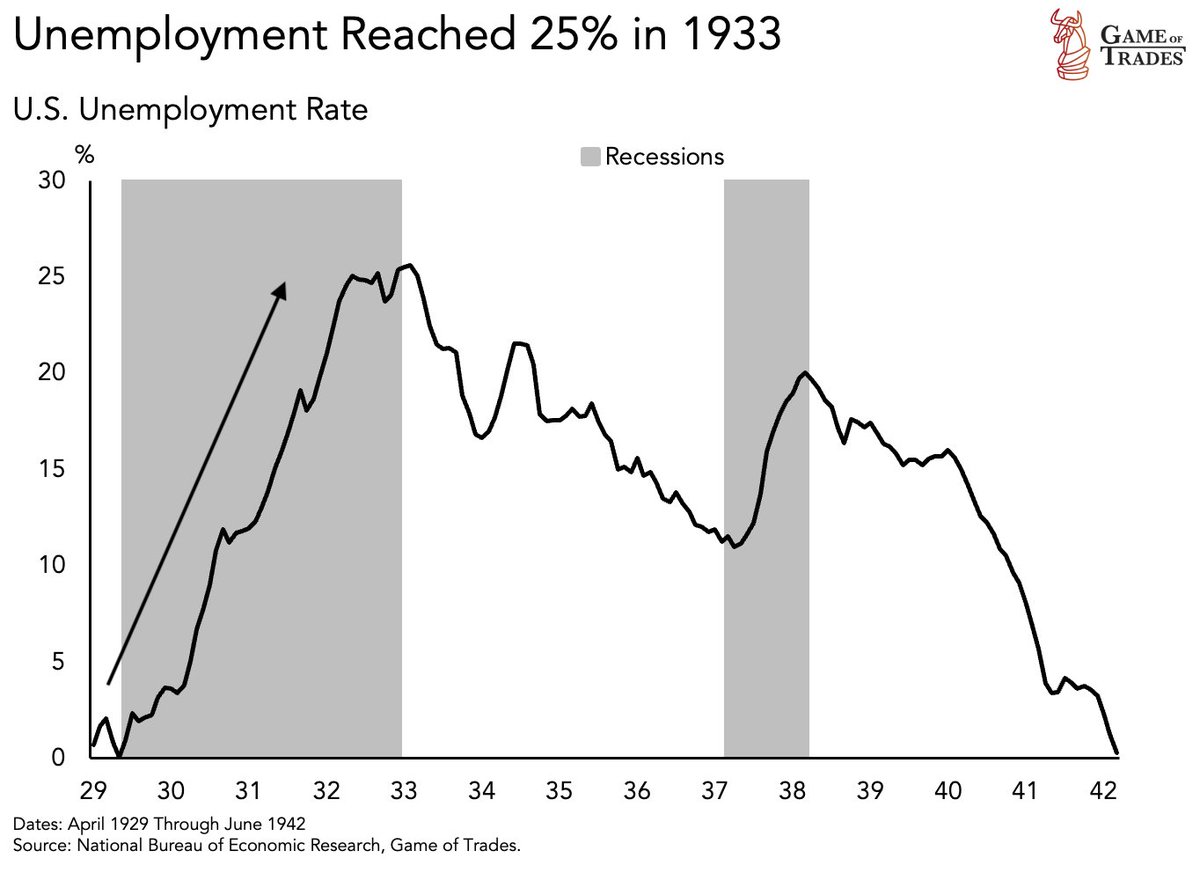
17/ The impressive strength of the economy and financial markets during the 1928 inversion did not predict a less severe recession, quite the contrary
Interestingly, the depth of today's yield curve inversion matches that of 1928
Interestingly, the depth of today's yield curve inversion matches that of 1928
18/ The most analogous scenarios to the 2023 yield curve inversion are those of 1929 and 2006, considering:
- Equity price action
- Labor market resilience
- Extent of the yield curve inversion
- Equity price action
- Labor market resilience
- Extent of the yield curve inversion
19/ Key Takeaways:
- The longest gap between an inversion and a recession is approximately 16-17 months (1928)
- Market strength during inversion doesn't predict recession’s severity
- Deeper inversions result in lower PMIs
- Today’s inversion resembles 1928 and 2006
- The longest gap between an inversion and a recession is approximately 16-17 months (1928)
- Market strength during inversion doesn't predict recession’s severity
- Deeper inversions result in lower PMIs
- Today’s inversion resembles 1928 and 2006
20/ Thanks for reading!
If you found this thread valuable, please ❤️ and 🔁 the first tweet below
And follow @gameoftrades_ for more market insights, finance and investment strategies
If you found this thread valuable, please ❤️ and 🔁 the first tweet below
And follow @gameoftrades_ for more market insights, finance and investment strategies
Loading suggestions...