

Most scientists struggle with illustrations and graphics.
But with the right tool, it gets much easier and improves your publications!
Here is an AI assisted workflow to design beautiful figures, abstracts or posters:
(With tips from an ex web designer)
👇
But with the right tool, it gets much easier and improves your publications!
Here is an AI assisted workflow to design beautiful figures, abstracts or posters:
(With tips from an ex web designer)
👇

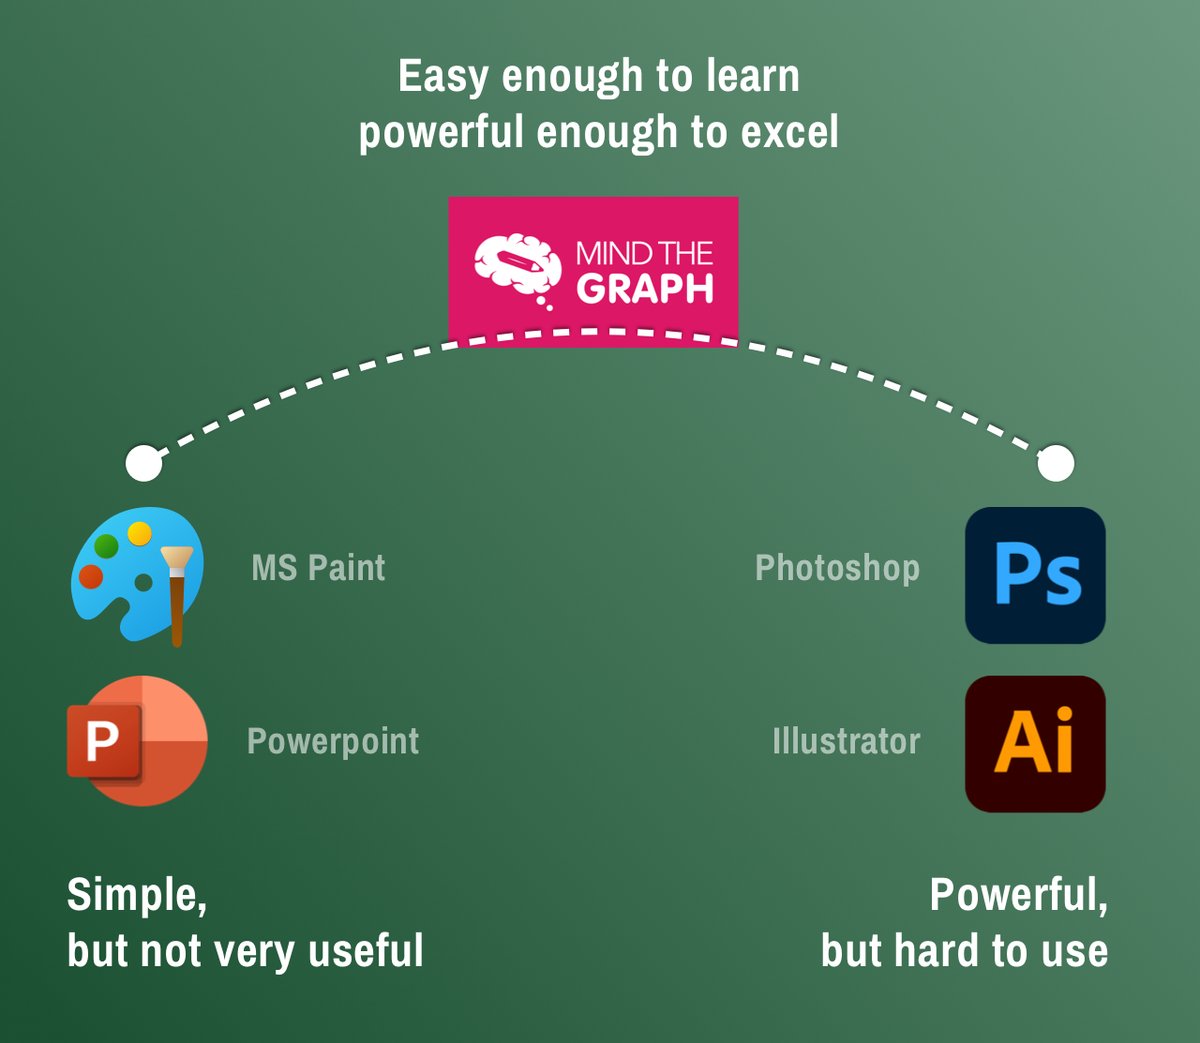
As a web designer I used Photoshop, Illustrator or Sketch.
While they are very powerful, they have a steep learning curve.
Simpler tools like Powerpoint, on the other hand, are not powerful enough.
There is a gap.
Mind The Graph is a tool that fills this gap.
While they are very powerful, they have a steep learning curve.
Simpler tools like Powerpoint, on the other hand, are not powerful enough.
There is a gap.
Mind The Graph is a tool that fills this gap.
@mindthegraph is as simple as PowerPoint.
Main advantage: 1000s of graphical elements from various scientific domains.
All you need to do is layout the elements.
Use it for: Conference posters, graphical abstracts, figures or presentations.
(Login instructions in last tweet)
Main advantage: 1000s of graphical elements from various scientific domains.
All you need to do is layout the elements.
Use it for: Conference posters, graphical abstracts, figures or presentations.
(Login instructions in last tweet)

@mindthegraph 1. Start with a Blank Canvas
First think about the size of your graphic.
Changing it later on, can mean a lot of work, so it is worth defining it first thing.
Click on "Settings" to adjust the size.
First think about the size of your graphic.
Changing it later on, can mean a lot of work, so it is worth defining it first thing.
Click on "Settings" to adjust the size.

@mindthegraph But: A blank canvas is very daunting.
There are two ways to make it easier.
First, use ChatGPT to create an idea of the VISUAL ELEMENTs of your illustration.
Here is a prompt I like to use.
(Copy it in the ALT text)
There are two ways to make it easier.
First, use ChatGPT to create an idea of the VISUAL ELEMENTs of your illustration.
Here is a prompt I like to use.
(Copy it in the ALT text)

@mindthegraph Here is what the reply looks like:
Chat GPT has analyzed ELEMENTS we can put onto our blank canvas.
The suggestions might not be perfect, but they are a great STARTING POINT!
Fine-tune the prompt to your domain to get even better results.
Chat GPT has analyzed ELEMENTS we can put onto our blank canvas.
The suggestions might not be perfect, but they are a great STARTING POINT!
Fine-tune the prompt to your domain to get even better results.

@mindthegraph 2. Using Mind The Graph Templates
ChatGPT gave us a content suggestion - Templates give us a design suggestion.
Even if you don't end up using a particular design, it's a great source of inspiration.
Observe how colours, sizes & fonts are combined to create a good result.
ChatGPT gave us a content suggestion - Templates give us a design suggestion.
Even if you don't end up using a particular design, it's a great source of inspiration.
Observe how colours, sizes & fonts are combined to create a good result.

@mindthegraph Now we have an Idea of the ELEMENTS and their DESIGN.
It is time to start adding these elements into our illustration and play around with it.
MindTheGraph has a large variety of elements available for you to choose from in the LEFT SIDEBAR.
Let's look into details:
It is time to start adding these elements into our illustration and play around with it.
MindTheGraph has a large variety of elements available for you to choose from in the LEFT SIDEBAR.
Let's look into details:
@mindthegraph Want to create a design from scratch? Follow these simple guidelines for a great design:
@mindthegraph 3. Adding Elements: Illustrations
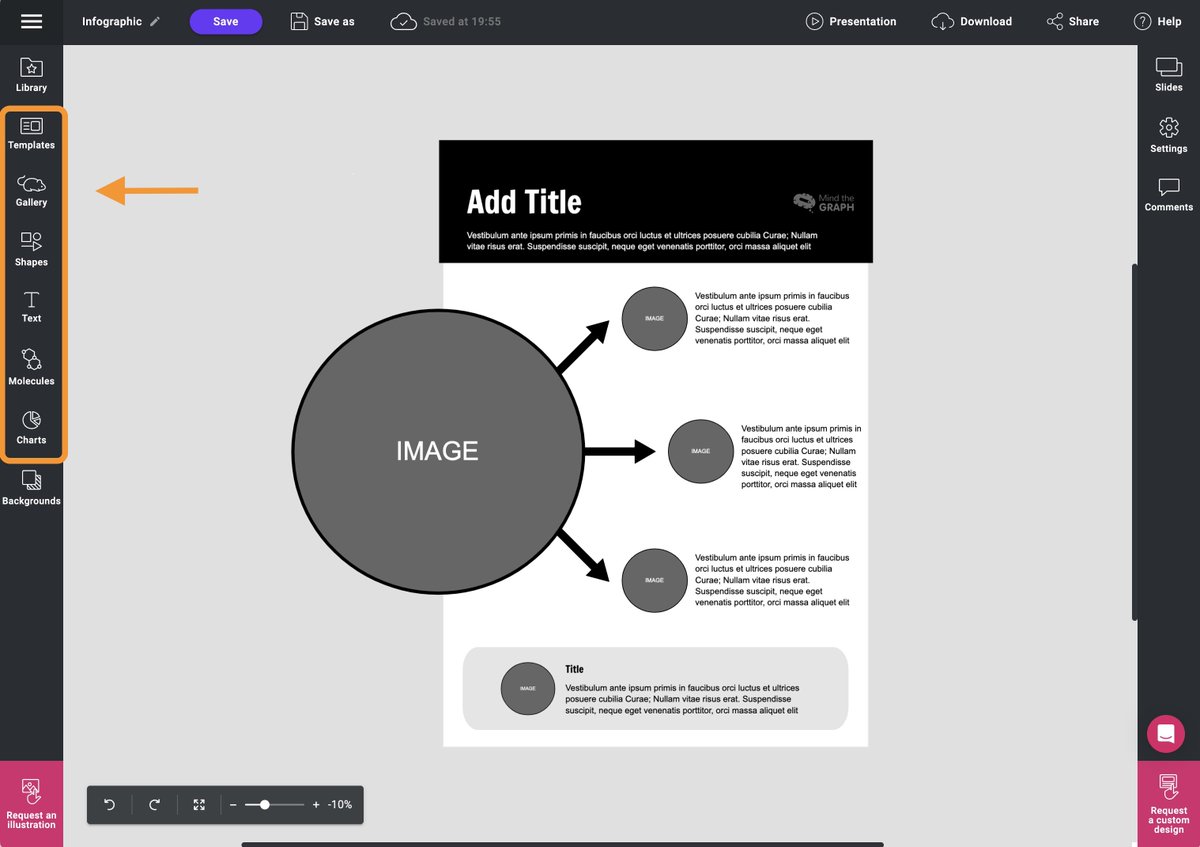
Mind The Graph has 1000s of elements sorted by scientific domain.
Click "Gallery" to explore the illustrations.
Filter by Domain using the tags at the top
Drag & Drop the elements you find useful.
Mind The Graph has 1000s of elements sorted by scientific domain.
Click "Gallery" to explore the illustrations.
Filter by Domain using the tags at the top
Drag & Drop the elements you find useful.

@mindthegraph 3a. Versions of Illustrations
Some Illustrations will have multiple "versions" available.
After dragging them onto the canvas, click them.
This brings up a bar at the top.
Here you can use the "Versions" dropdown to see variants of the same illustration.
Some Illustrations will have multiple "versions" available.
After dragging them onto the canvas, click them.
This brings up a bar at the top.
Here you can use the "Versions" dropdown to see variants of the same illustration.

@mindthegraph 4. Adding Elements: Icons
There is a sheer endless amount of icons.
Icons are a great way to avoid wordy images.
Click the "Icons" tab in Gallery.
Use the search bar to find what you are looking for.
Drag & Drop the Icons to the Canvas.
There is a sheer endless amount of icons.
Icons are a great way to avoid wordy images.
Click the "Icons" tab in Gallery.
Use the search bar to find what you are looking for.
Drag & Drop the Icons to the Canvas.

@mindthegraph 5. Adding Elements: Shapes, Molecules, Text
There are different other elements to choose from: Molecules, simple shapes, tables, graphs and text headers.
They all work similarly to Icons and Illustrations.
Here are examples:
There are different other elements to choose from: Molecules, simple shapes, tables, graphs and text headers.
They all work similarly to Icons and Illustrations.
Here are examples:


@mindthegraph 6. Working with Layers
Elements in MindTheGraph are arranged in a STACK.
Elements on top overwrite elements on the bottom.
Whenever you select an element you can move it up or down the stack, or push it directly all the way to the top/bottom.
Here is how that looks:
Elements in MindTheGraph are arranged in a STACK.
Elements on top overwrite elements on the bottom.
Whenever you select an element you can move it up or down the stack, or push it directly all the way to the top/bottom.
Here is how that looks:

@mindthegraph 7. Grouping elements
A very handy feature is GROUPING.
Drag the mouse to select multiple elements.
Then click the "Group Icon".
Your elements merge into a single element, that you can scale/rotate/move as one
(The same button ungroups them again).
Example:
A very handy feature is GROUPING.
Drag the mouse to select multiple elements.
Then click the "Group Icon".
Your elements merge into a single element, that you can scale/rotate/move as one
(The same button ungroups them again).
Example:

@mindthegraph 8. Using SLIDES
Create as many slides as you like to try out different layouts.
Professional designers always keep track of ALL attempts, even the ones that obviously won't work.
This helps to pick out the best design at the end.
Here is how to duplicate your current design:
Create as many slides as you like to try out different layouts.
Professional designers always keep track of ALL attempts, even the ones that obviously won't work.
This helps to pick out the best design at the end.
Here is how to duplicate your current design:

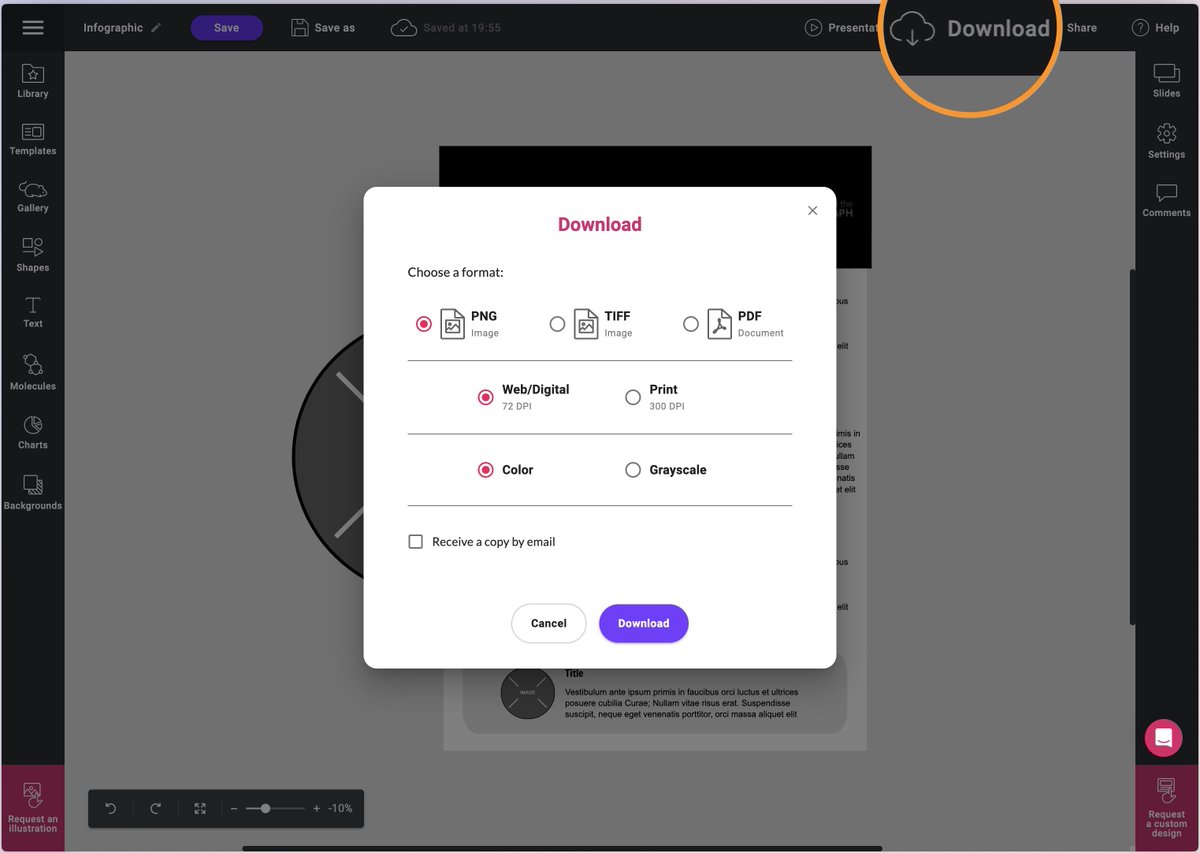
@mindthegraph 9. Export your final result
Click "Download" at the top, to export your final graphic in various formats.
Click "Download" at the top, to export your final graphic in various formats.
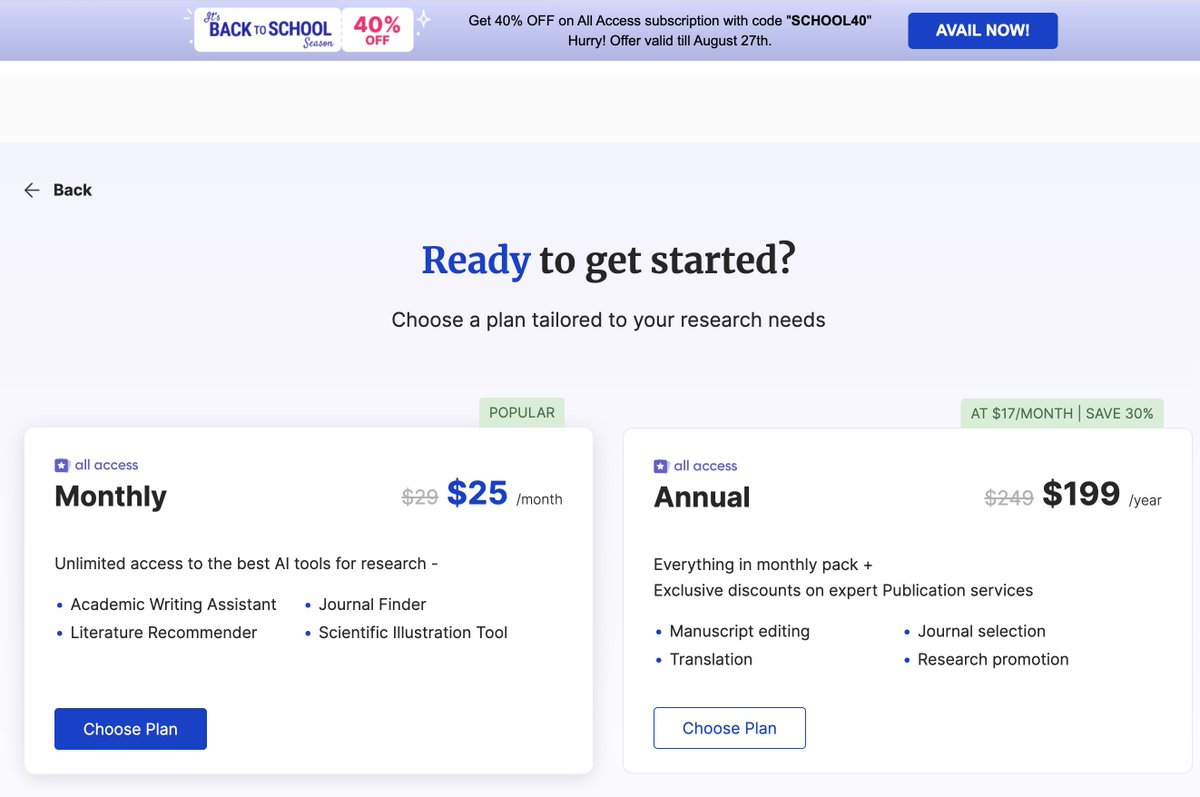
@mindthegraph Pricing
Mind the Graph is part of the Researcher Life bundle, that costs 25$/month.
This membership gives you access to @teampaperpal as well!
Sign up here: bit.ly
You can try it for free, with a limited number of illustrations on the canvas.
Mind the Graph is part of the Researcher Life bundle, that costs 25$/month.
This membership gives you access to @teampaperpal as well!
Sign up here: bit.ly
You can try it for free, with a limited number of illustrations on the canvas.
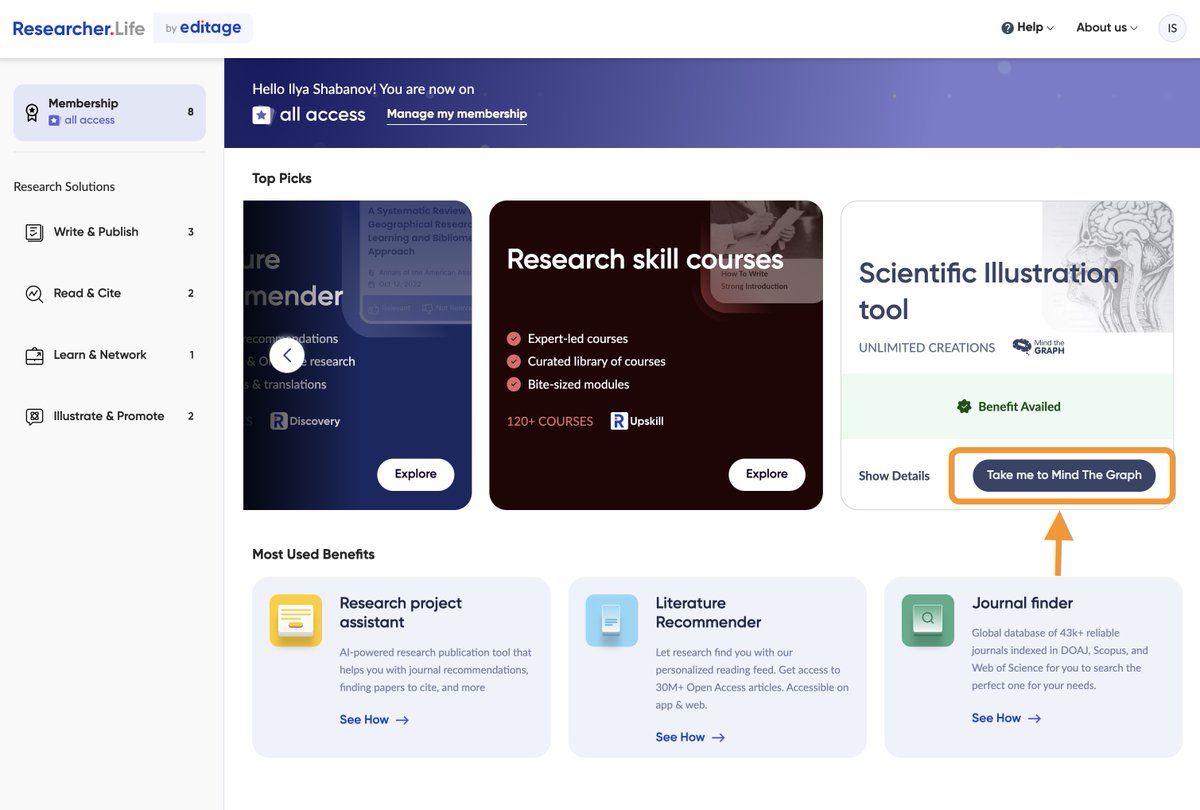
@mindthegraph @teampaperpal Login through Researcher Life
You access the tool by logging in at Researcher(dot)life.
In your Dashboard find the box called "Scientific Illustration Tool".
Click "Take me to Mind The Graph"
This will start Mind The Graph.
You access the tool by logging in at Researcher(dot)life.
In your Dashboard find the box called "Scientific Illustration Tool".
Click "Take me to Mind The Graph"
This will start Mind The Graph.
@mindthegraph @teampaperpal Mind The Graph is an easy and powerful tool.
Compared to Adobe Illustrator, Photoshop or Sketch it saves you time.
Using Templates and ChatGPT for inspiration is an easy way to get started.
If you want to visualize your own notes, try this:
Compared to Adobe Illustrator, Photoshop or Sketch it saves you time.
Using Templates and ChatGPT for inspiration is an easy way to get started.
If you want to visualize your own notes, try this:
@mindthegraph @teampaperpal Want to make your academic life easier with modern tools, workflows like this one?
Explore my workflows here:
Explore my workflows here:
Loading suggestions...