

🚨 CHART PATTERN MEGA THREAD 🧵
Let's break down some of these common chart patterns with REAL examples of how we traded them! Improving your ability to recognize these patterns in real time will help your trading tremendously!
Let's dive in and get to work! ⬇️ $SPY $QQQ $IWM
Let's break down some of these common chart patterns with REAL examples of how we traded them! Improving your ability to recognize these patterns in real time will help your trading tremendously!
Let's dive in and get to work! ⬇️ $SPY $QQQ $IWM
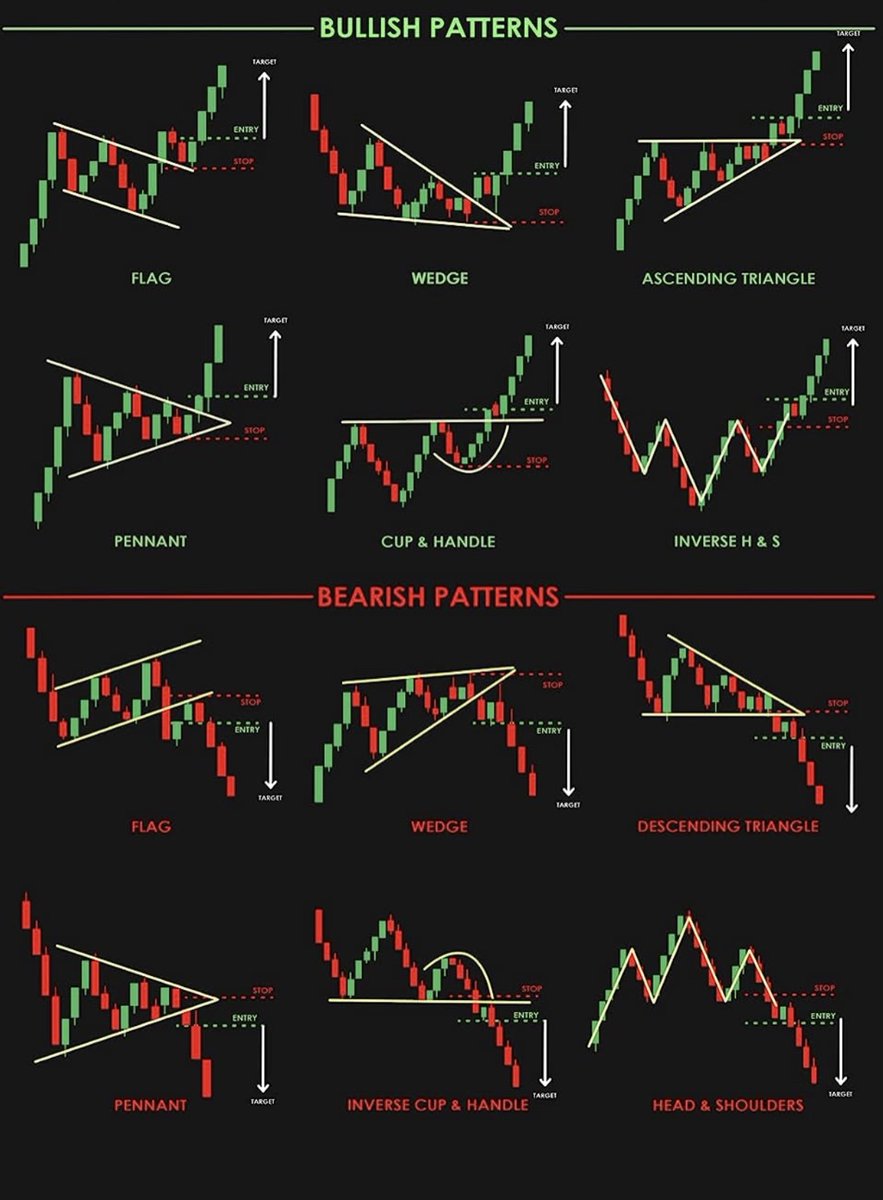
Bull / Bear Flags 🏳️
One of my favorites to trade! Very common and easy to spot. After a strong initial move up or down watch the pullback to form a 'flag" as it consolidates.
If you spot a flag, keep it on watch for a break and a continuation of that initial move ⬇️
One of my favorites to trade! Very common and easy to spot. After a strong initial move up or down watch the pullback to form a 'flag" as it consolidates.
If you spot a flag, keep it on watch for a break and a continuation of that initial move ⬇️
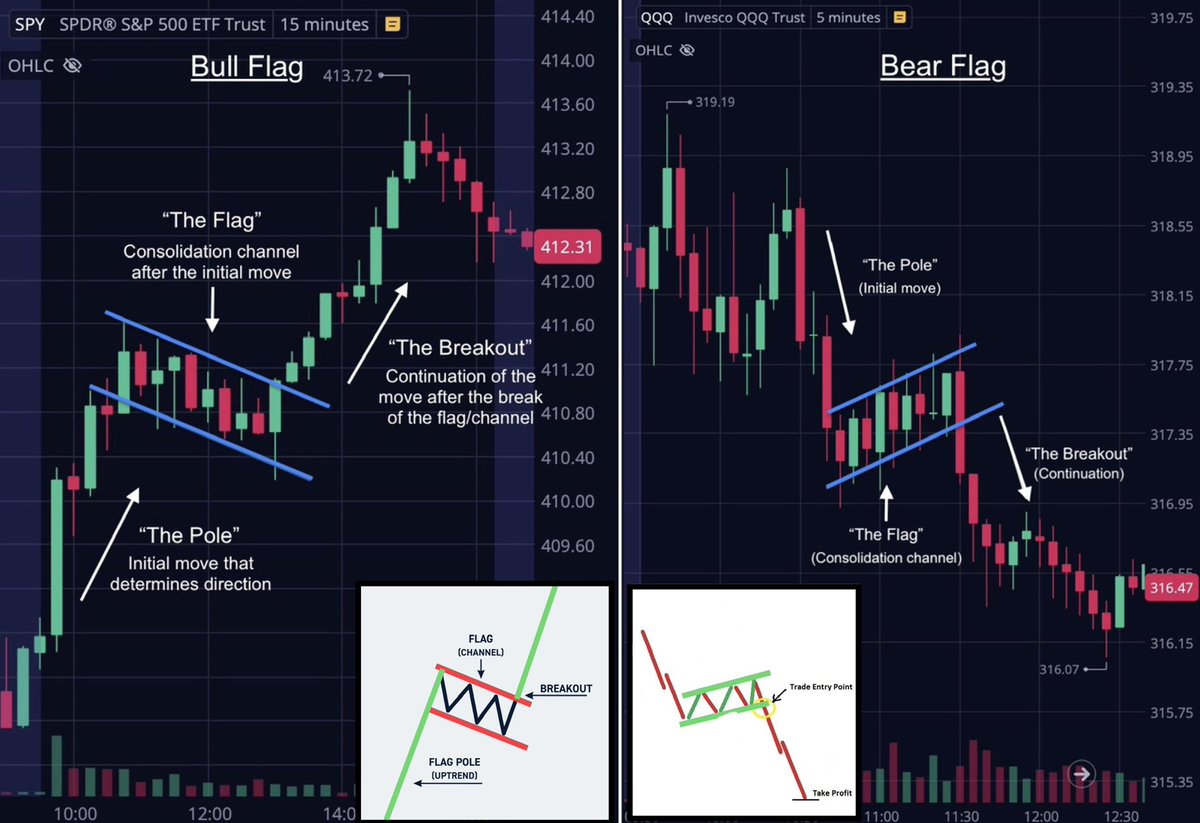
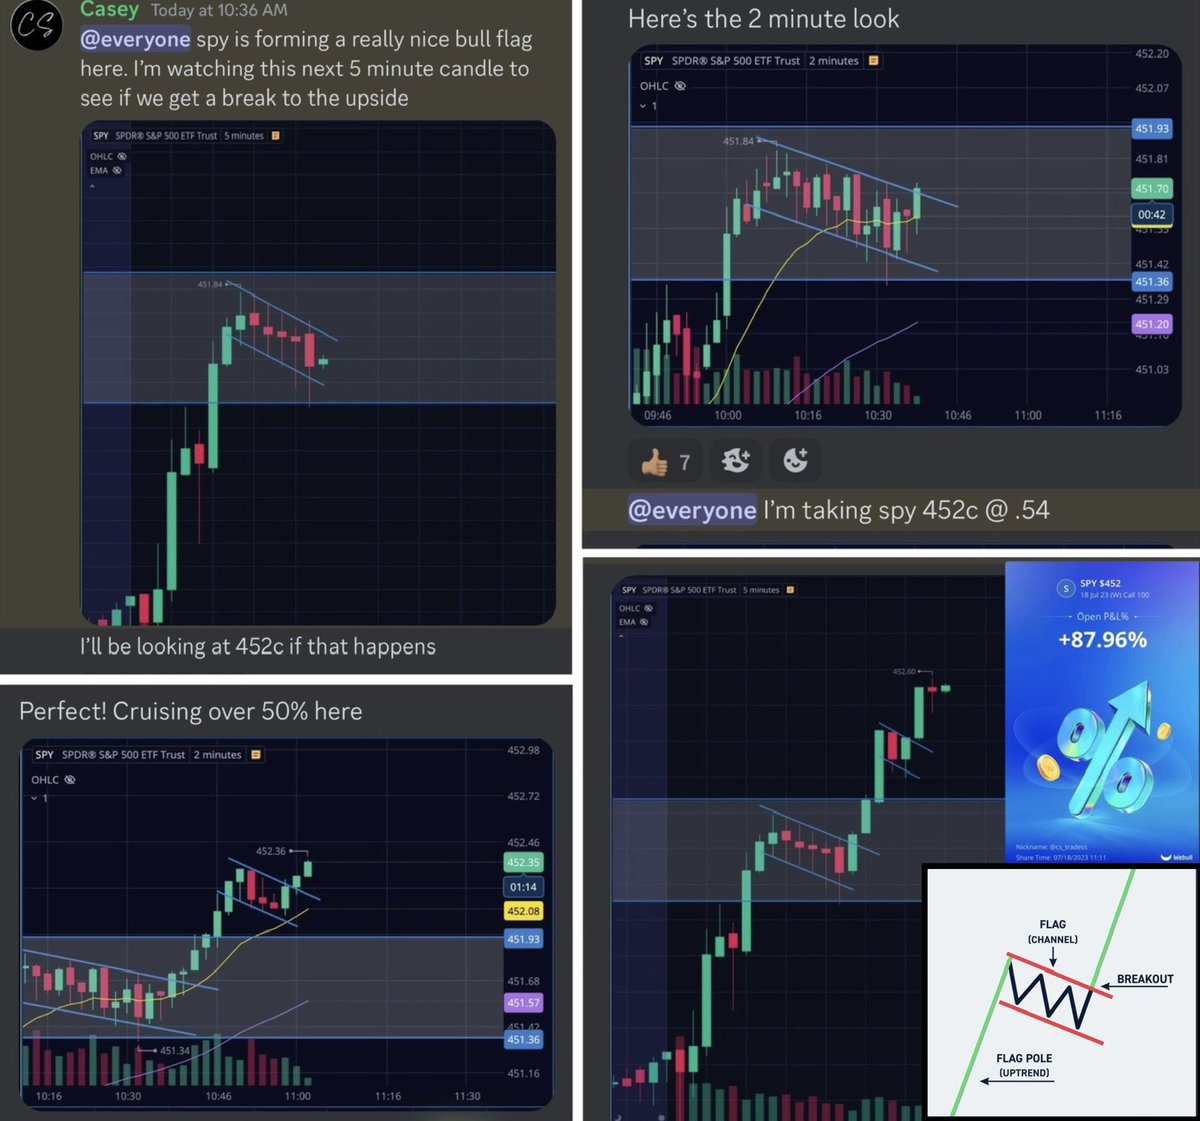
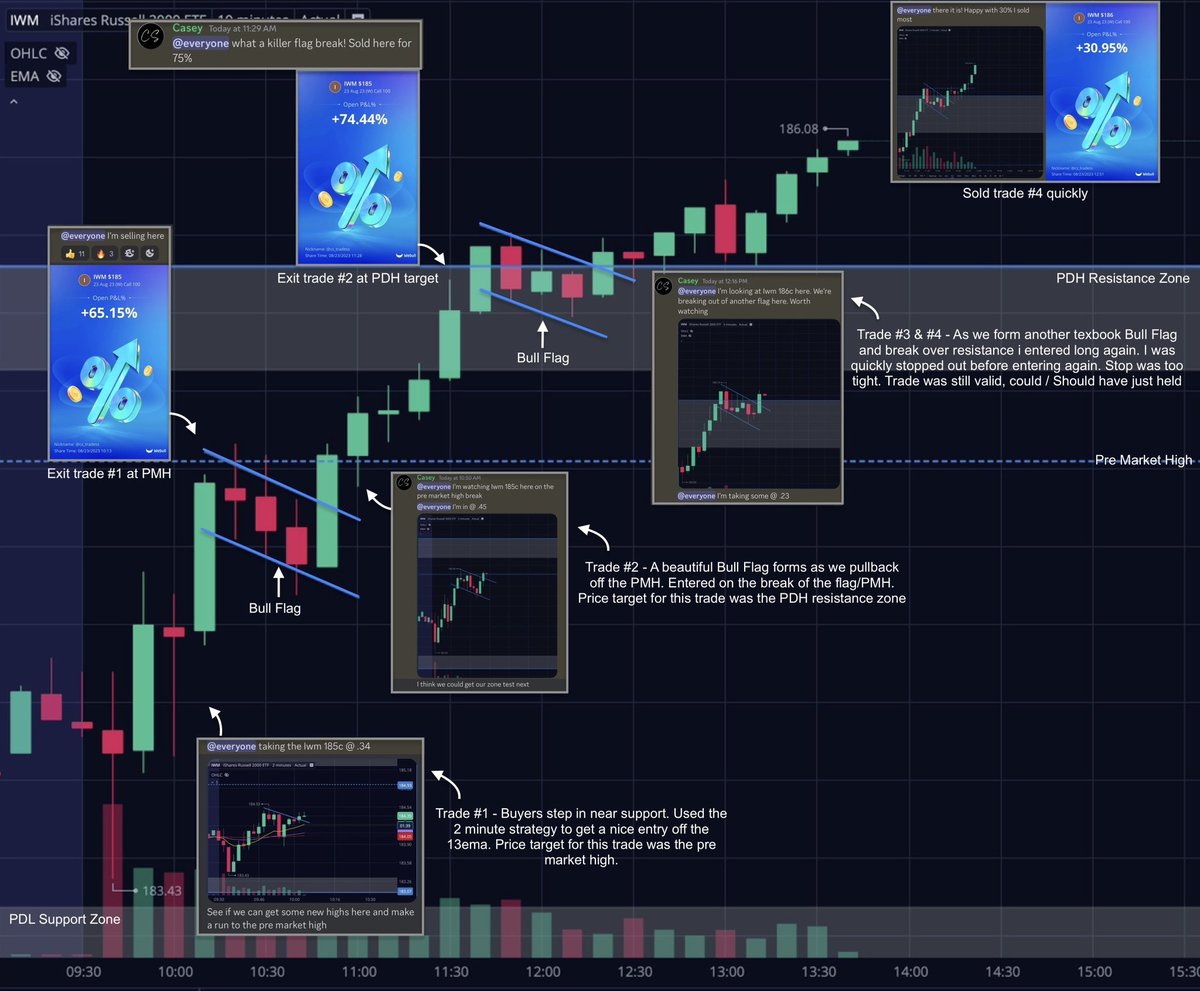
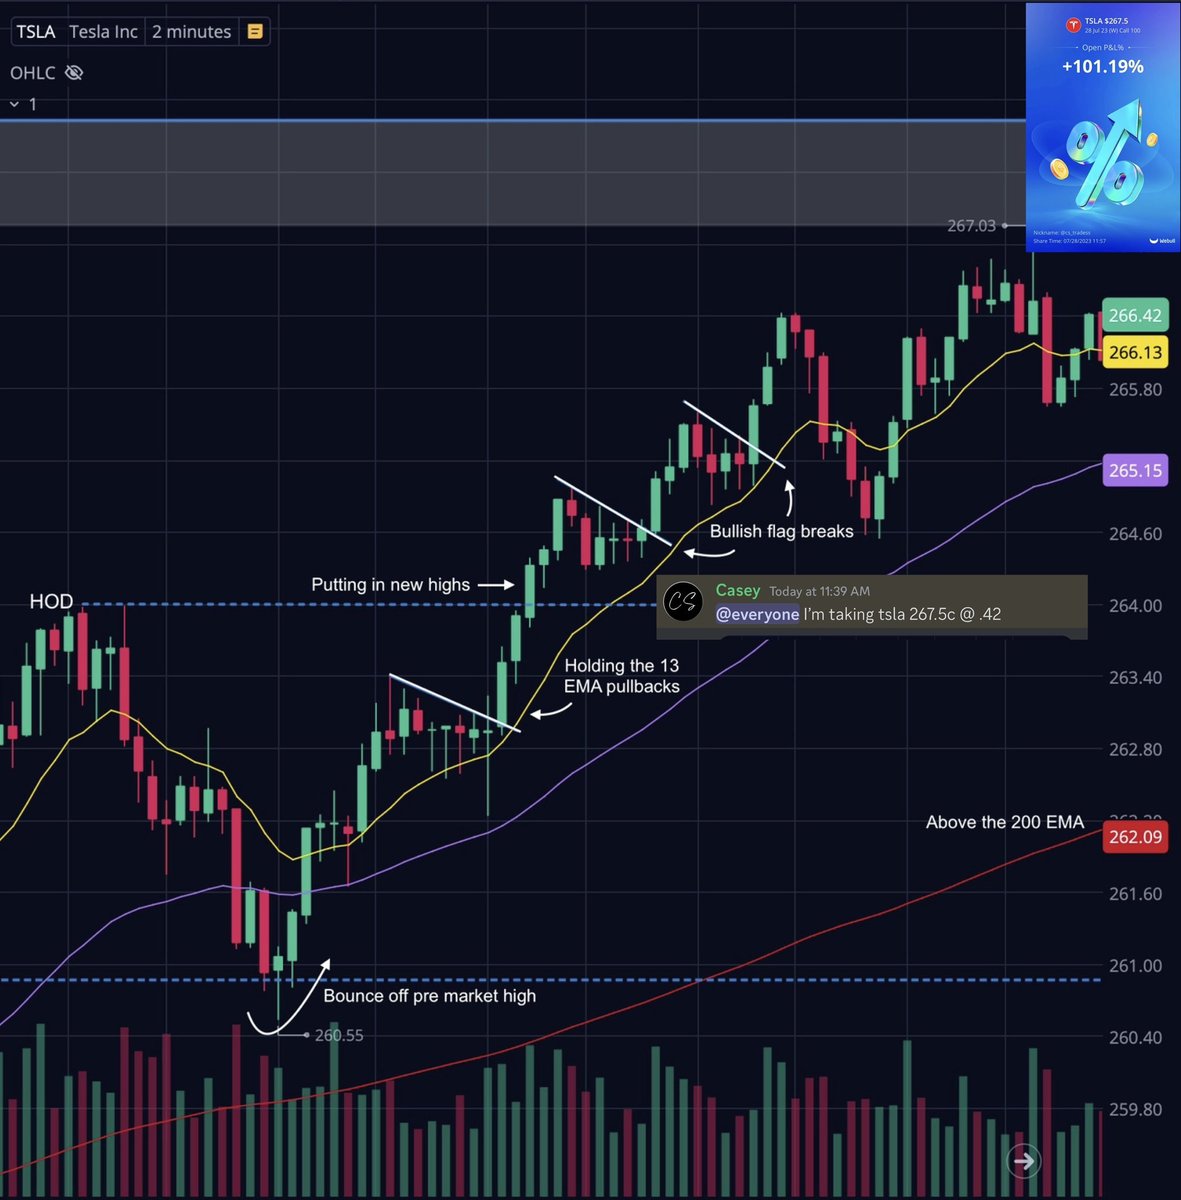
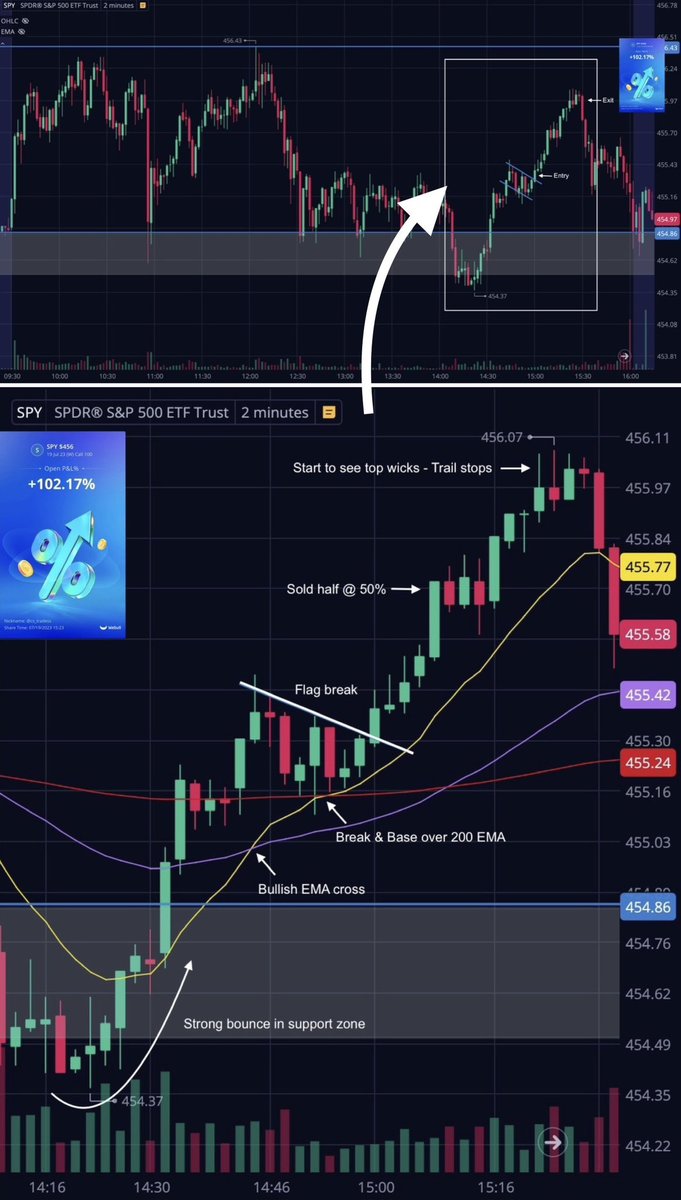
Bull Flag examples ⬇️
Strong move up ✅
Watch pullback for that flag to form 👀
Enter calls on the break for the continuation 📈
Very simple and effective. These are the go to pattern in a strong market!
Strong move up ✅
Watch pullback for that flag to form 👀
Enter calls on the break for the continuation 📈
Very simple and effective. These are the go to pattern in a strong market!
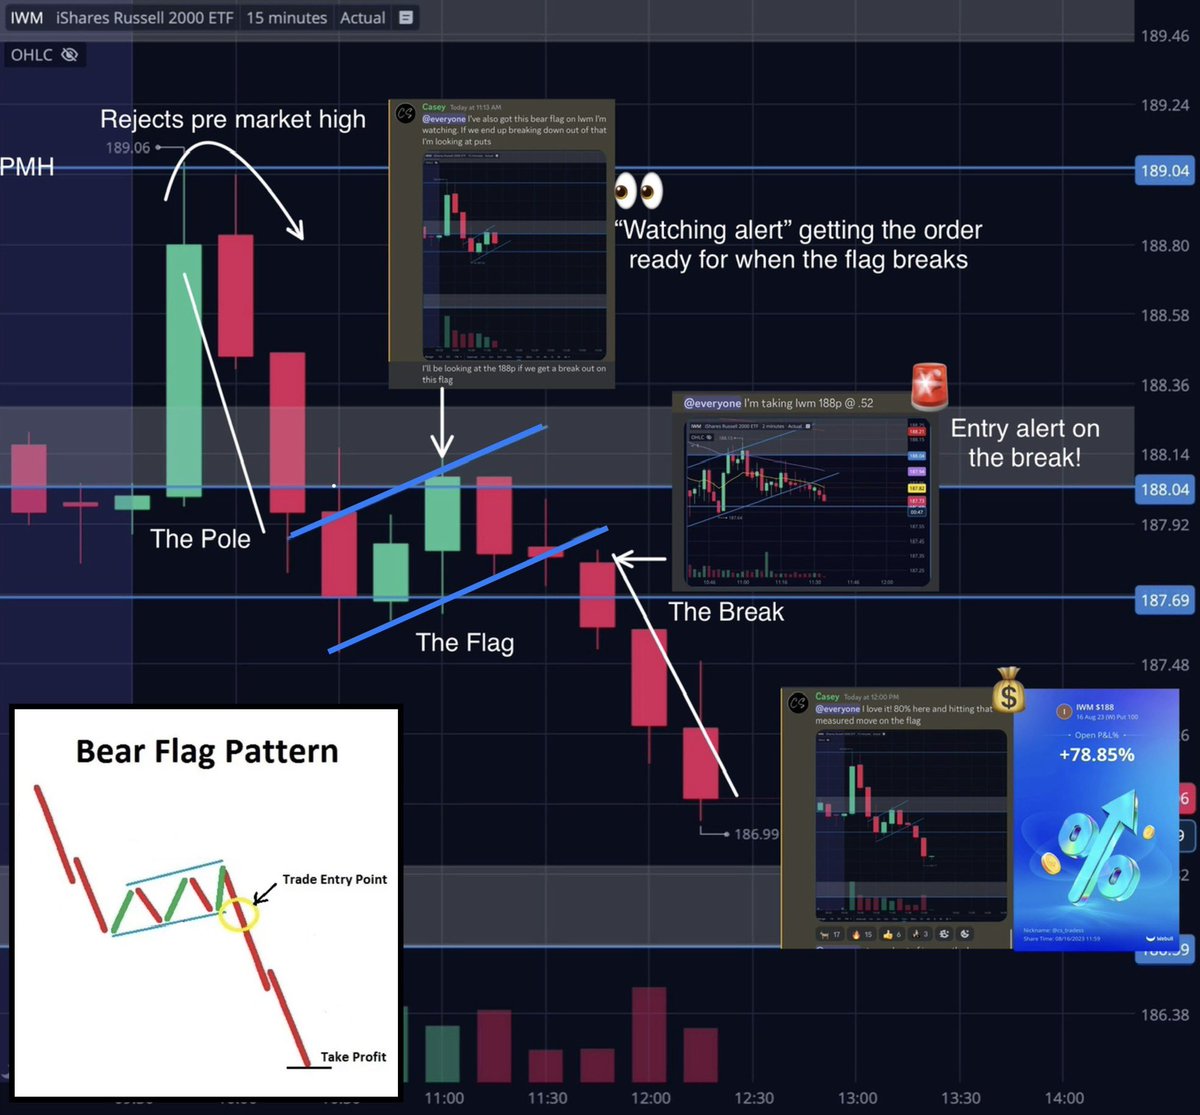
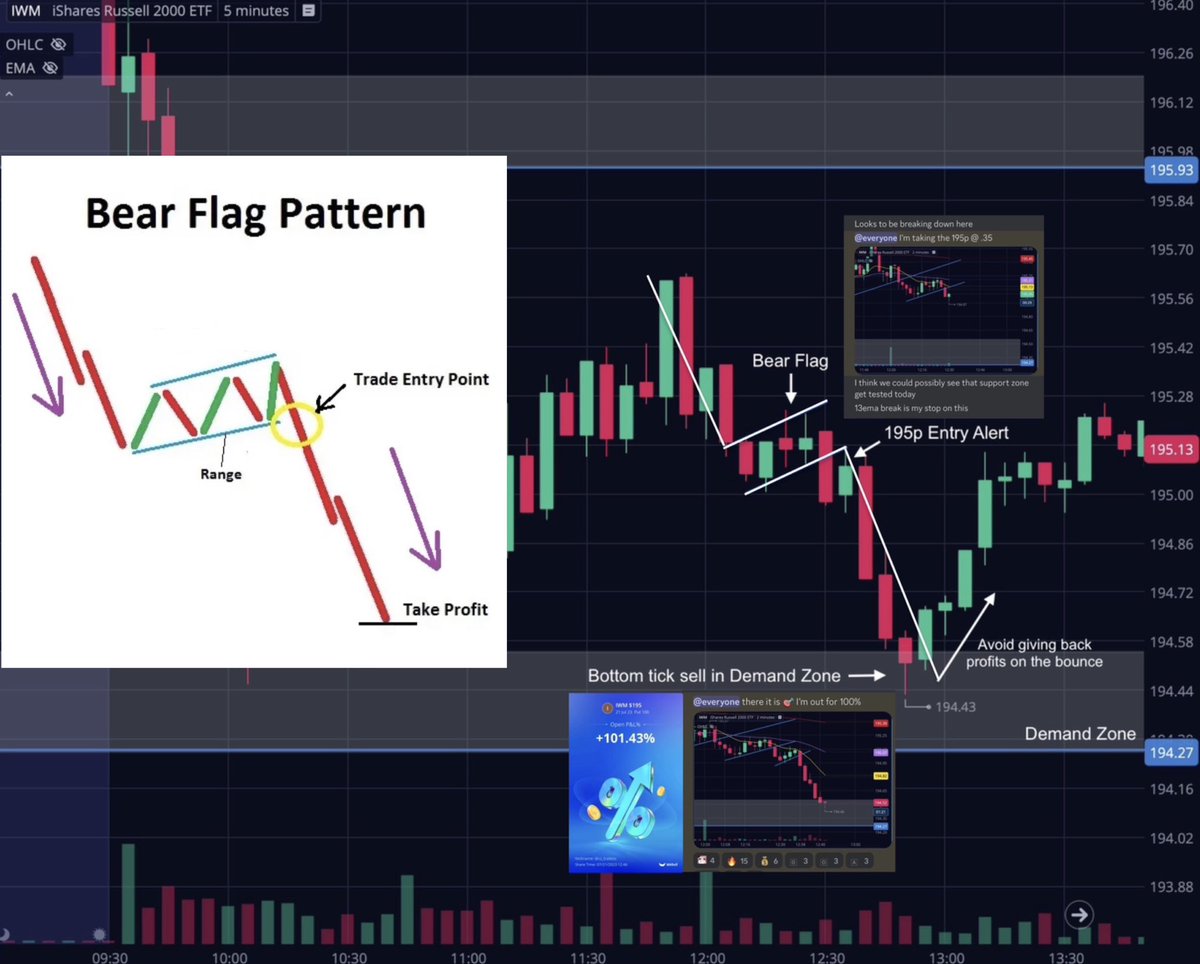
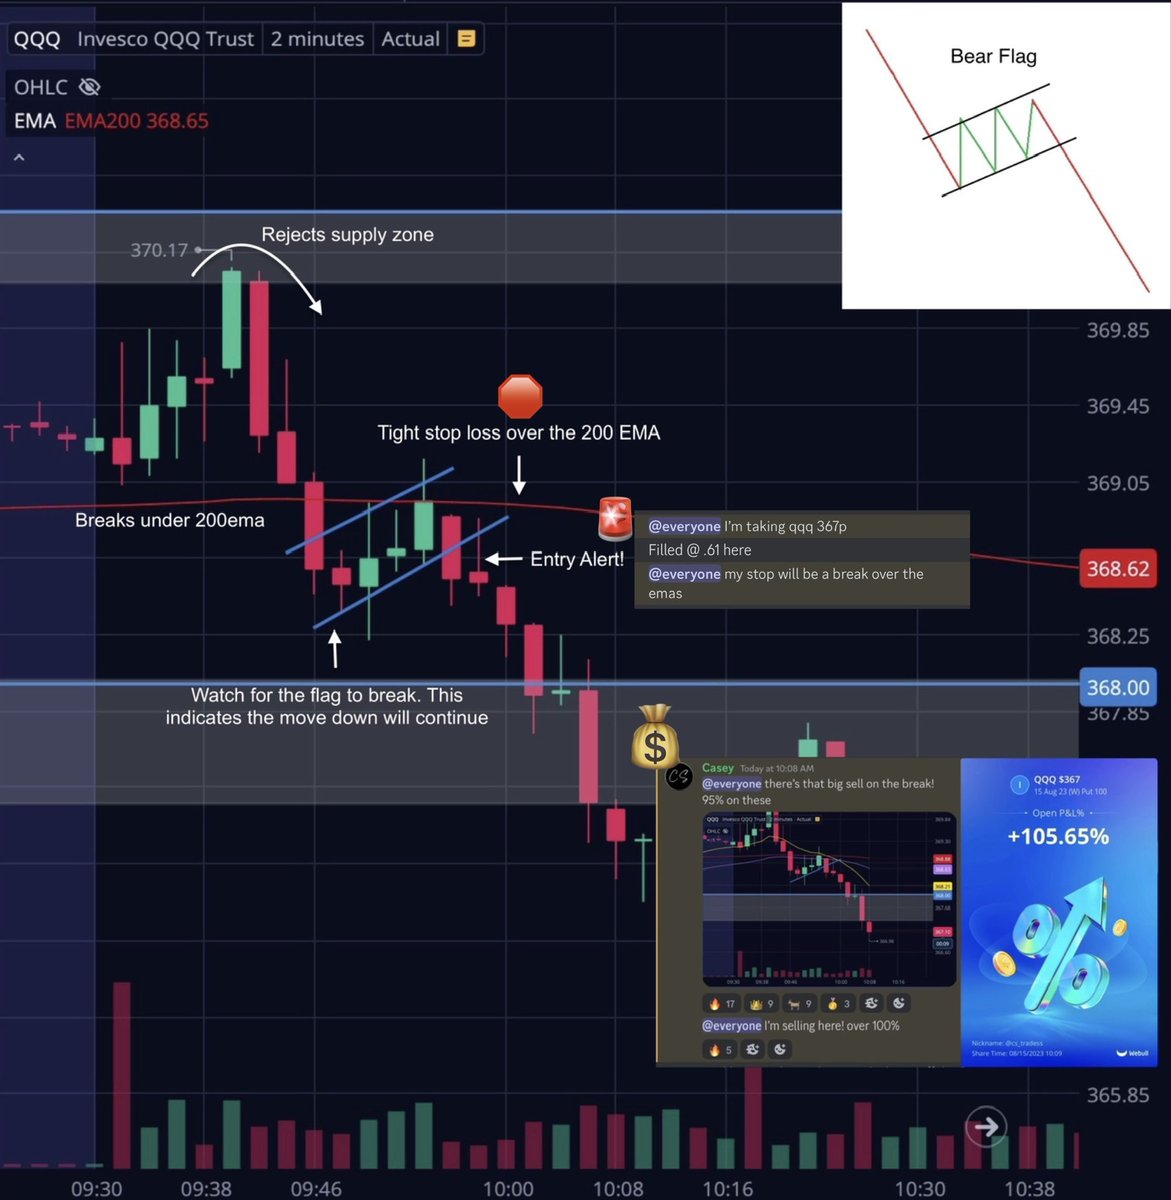
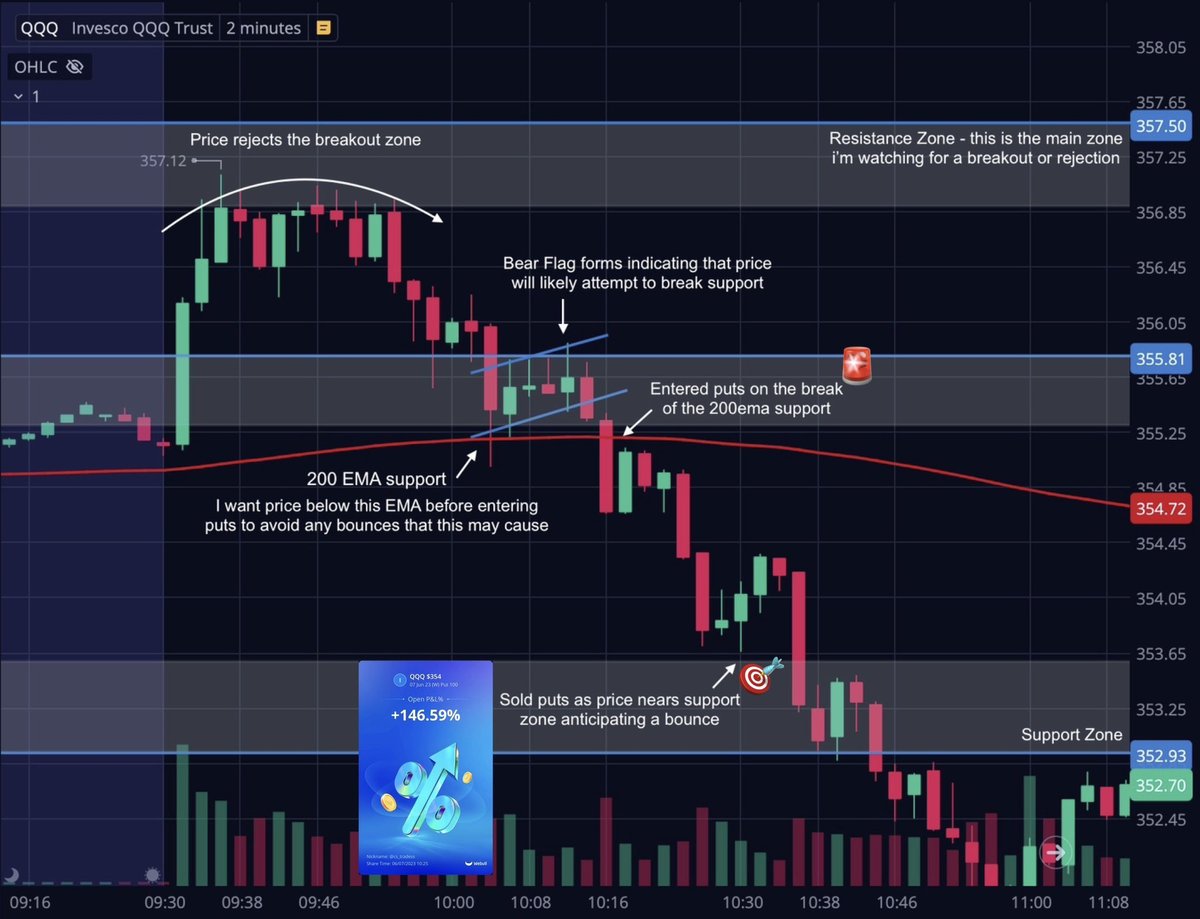
Bear Flag examples ⬇️
Strong move down ✅
Watch pullback for that flag to form 👀
Enter puts on the break for continuation 📉
These are the go to pattern when the market is weaker. If you struggle to play the downside moves these will help with that a lot!
Strong move down ✅
Watch pullback for that flag to form 👀
Enter puts on the break for continuation 📉
These are the go to pattern when the market is weaker. If you struggle to play the downside moves these will help with that a lot!
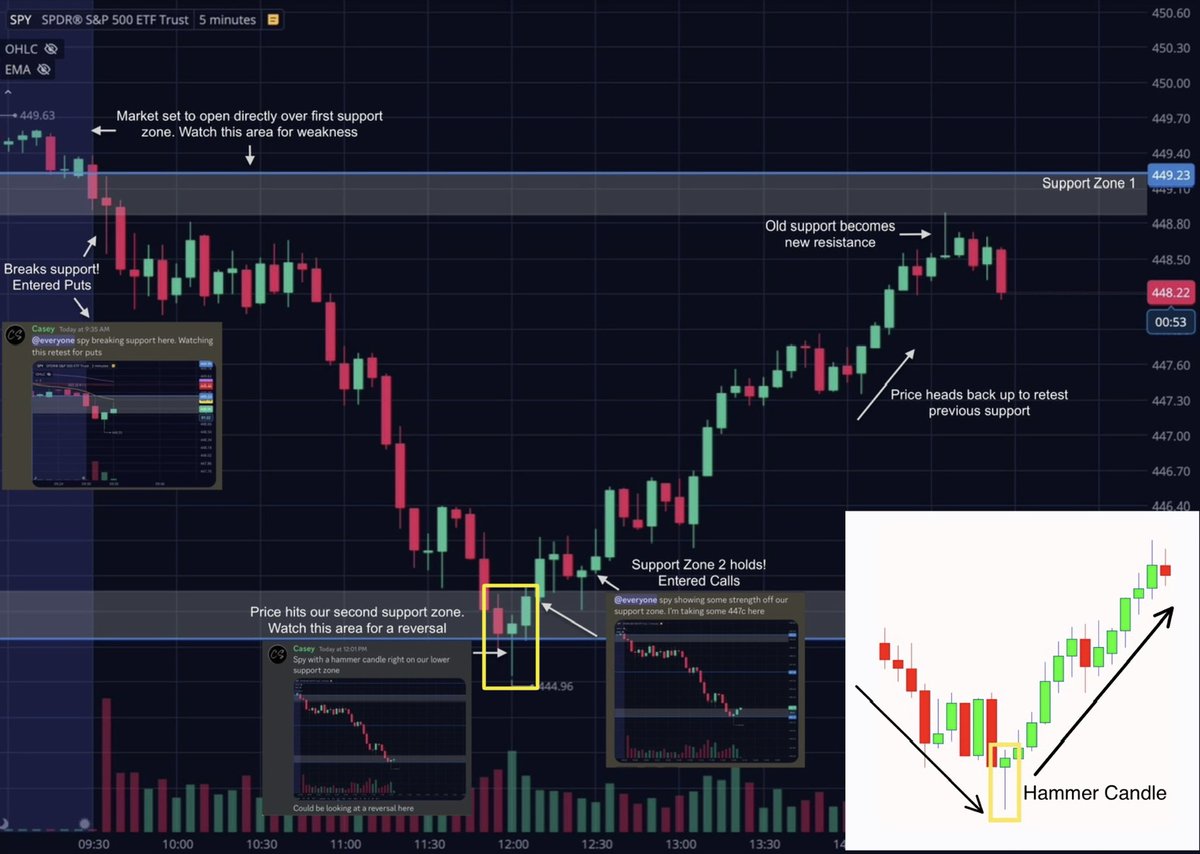
Hammer candles! 🔨 Bullish reversal sign. Long lower wick and small body on top. Watch for them at support levels and zones 👀
When they show up at support be open to the possibility of a reversal 📉📈
Great for locking profits on puts as well as finding entries on calls ⬇️
When they show up at support be open to the possibility of a reversal 📉📈
Great for locking profits on puts as well as finding entries on calls ⬇️
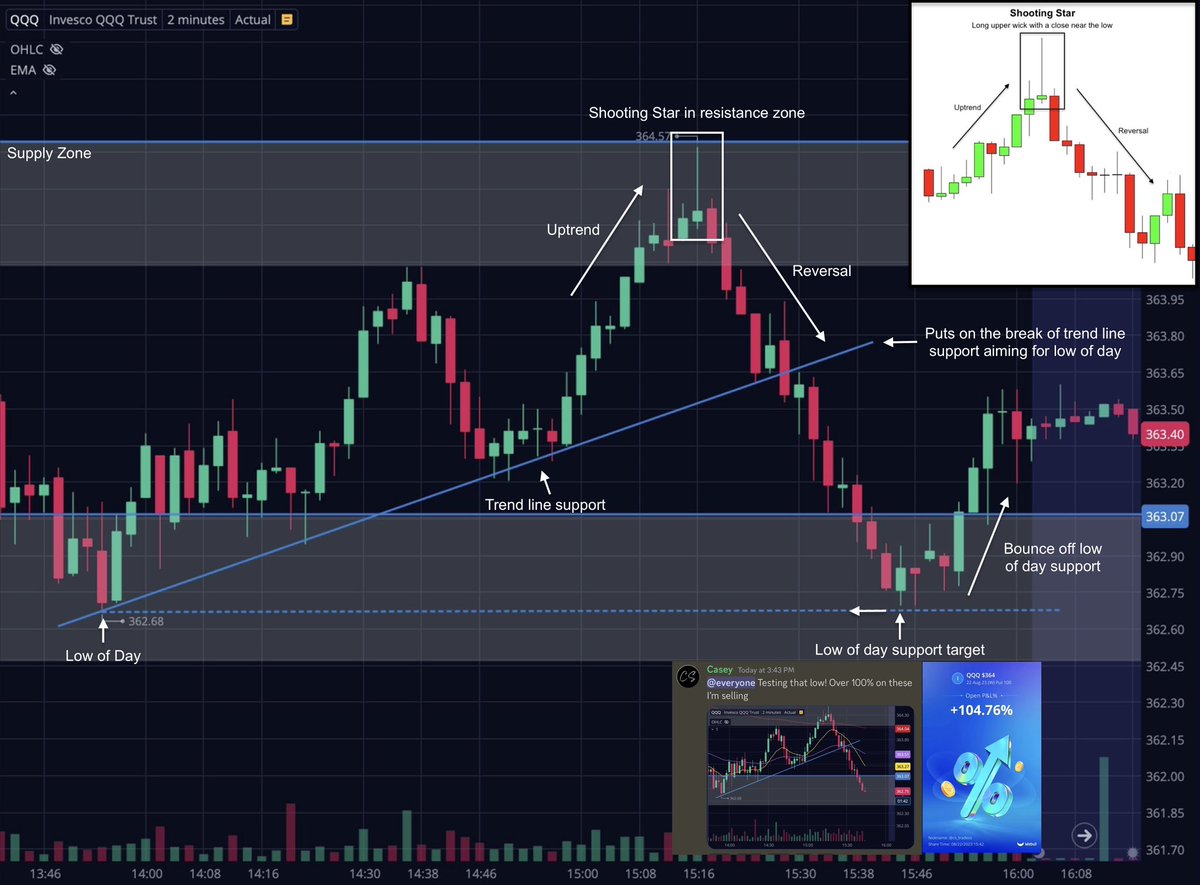
Shooting star candles! 🌠 Bearish reversal sign. Long upper wick with small body on bottom. Watch for them at resistance levels and zones👀
When they show up at the top of an uptrend watch for reversals shortly after 📈📉
Great sign for selling calls as well as put entries ⬇️
When they show up at the top of an uptrend watch for reversals shortly after 📈📉
Great sign for selling calls as well as put entries ⬇️
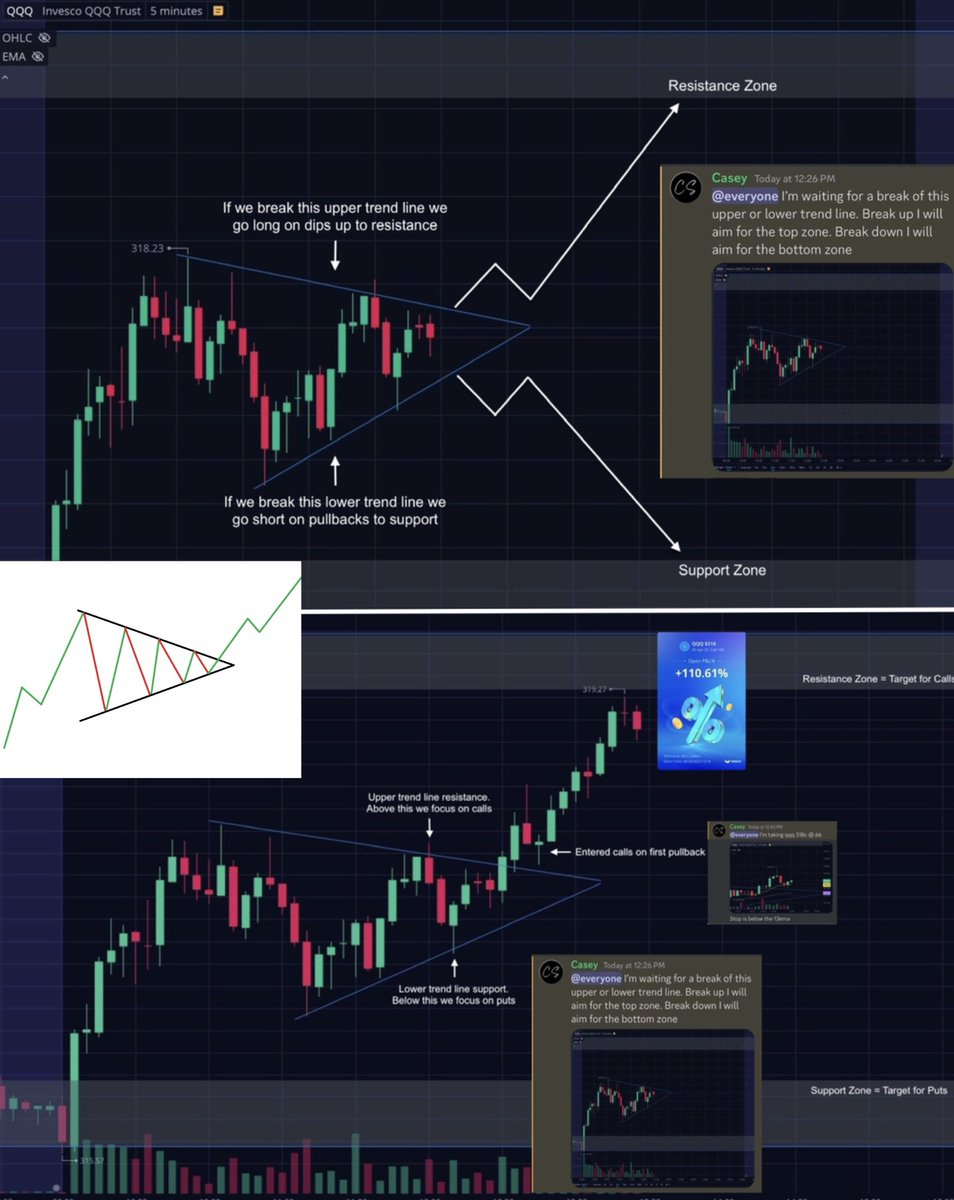
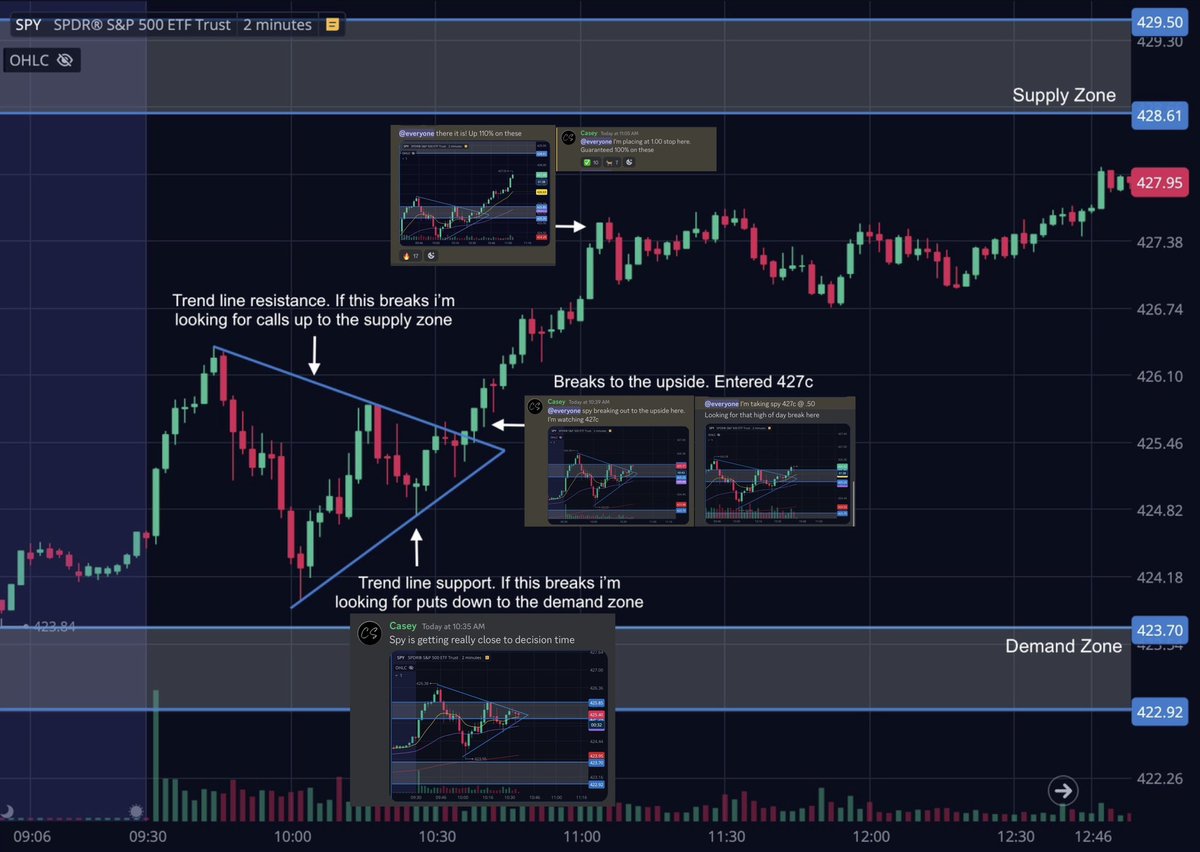
Triangle / Pennants! 📐 A consolidation pattern in the form of 2 converging trend lines. When they meet price will break to one side signaling the end of the consolidation period. Used for determining possible direction of a move ⬇️
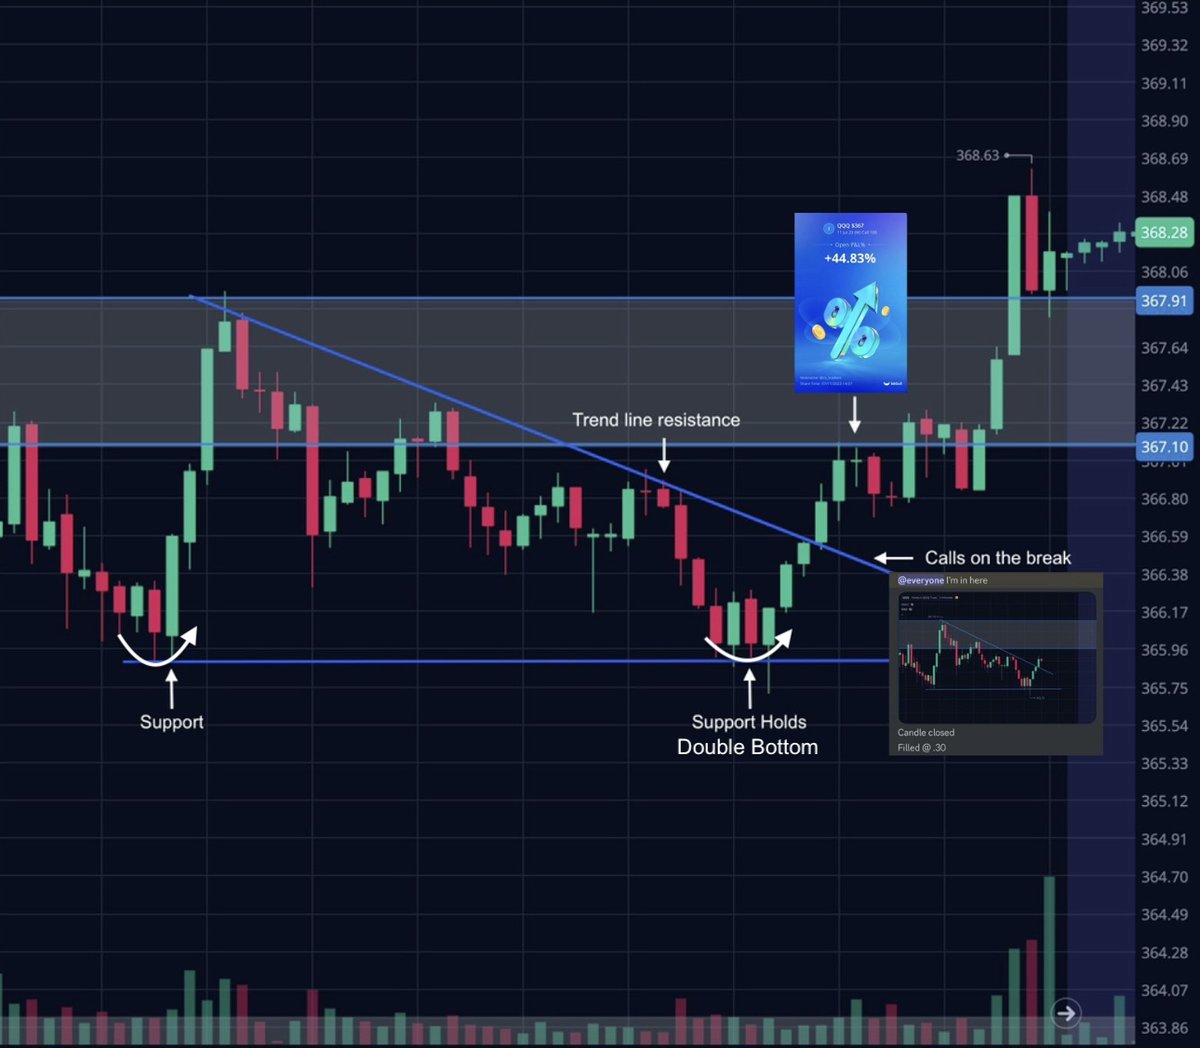
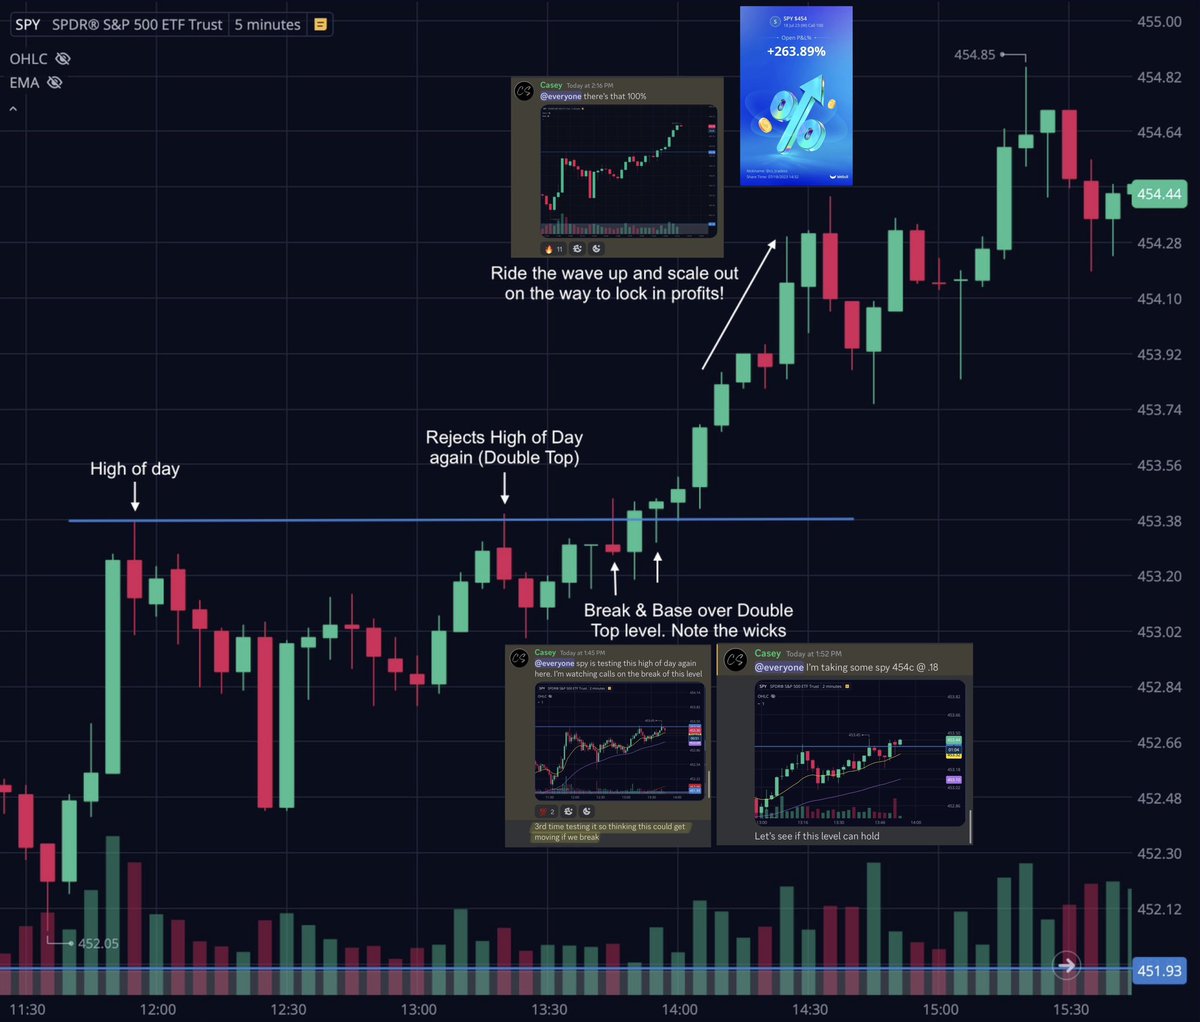
Double Tops / Bottoms! Usually seen at the high or low of day. Price will reject or bounce the same area twice. This creates a strong support / resistance level to watch.
Break double top = Good sign for calls 📈
Break double bottom = Good sign for puts 📉
Break double top = Good sign for calls 📈
Break double bottom = Good sign for puts 📉
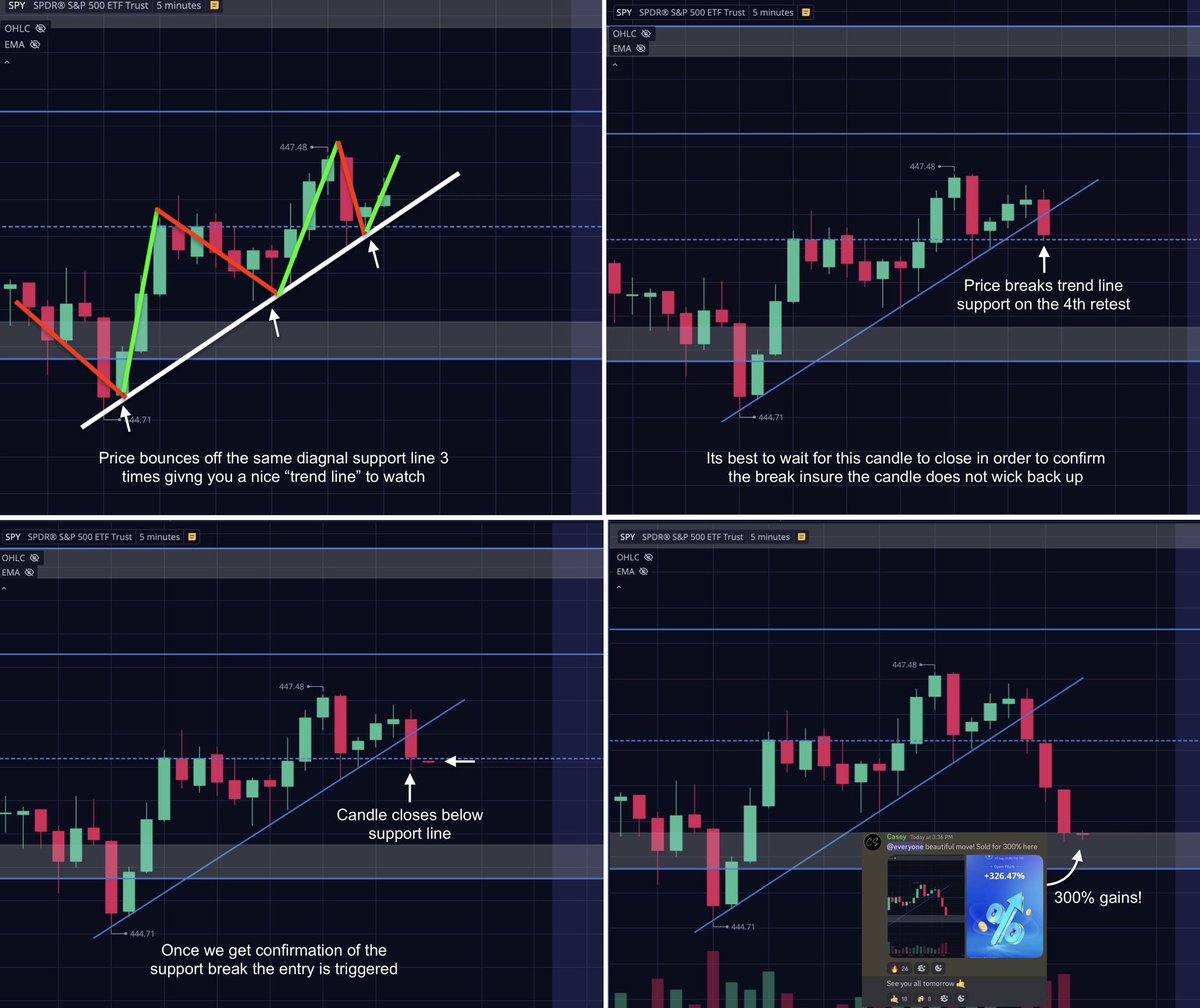
Trend lines! These are simply diagonal support and resistance levels. We know how good horizontal S&R levels work and the diagonal ones are no different.
Scan for these often because they provide excellent opportunities daily ⬇️
Scan for these often because they provide excellent opportunities daily ⬇️
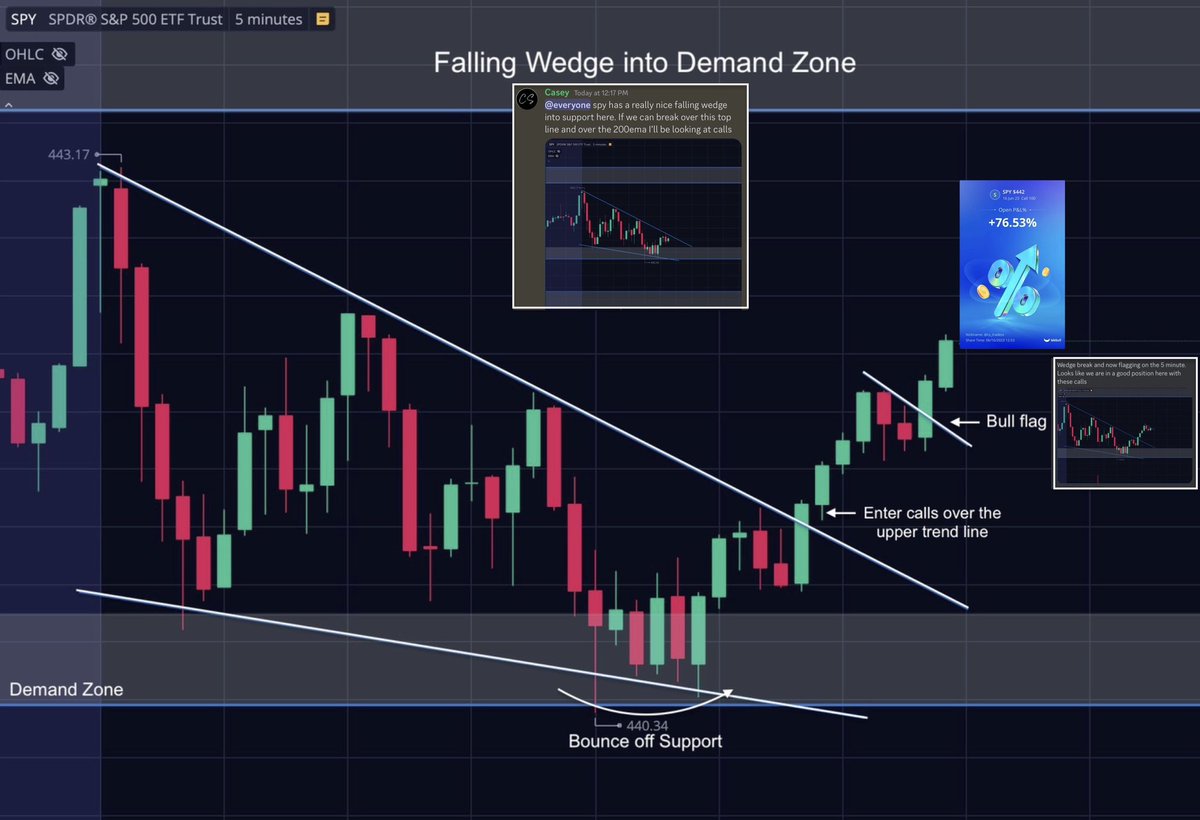
Falling wedges! These are made up of 2 trend lines consisting of lower highs and lower lows.
When price breaks the upper trend line it usually indicates a reversal in price and a great opportunity to go long ⬇️
When price breaks the upper trend line it usually indicates a reversal in price and a great opportunity to go long ⬇️
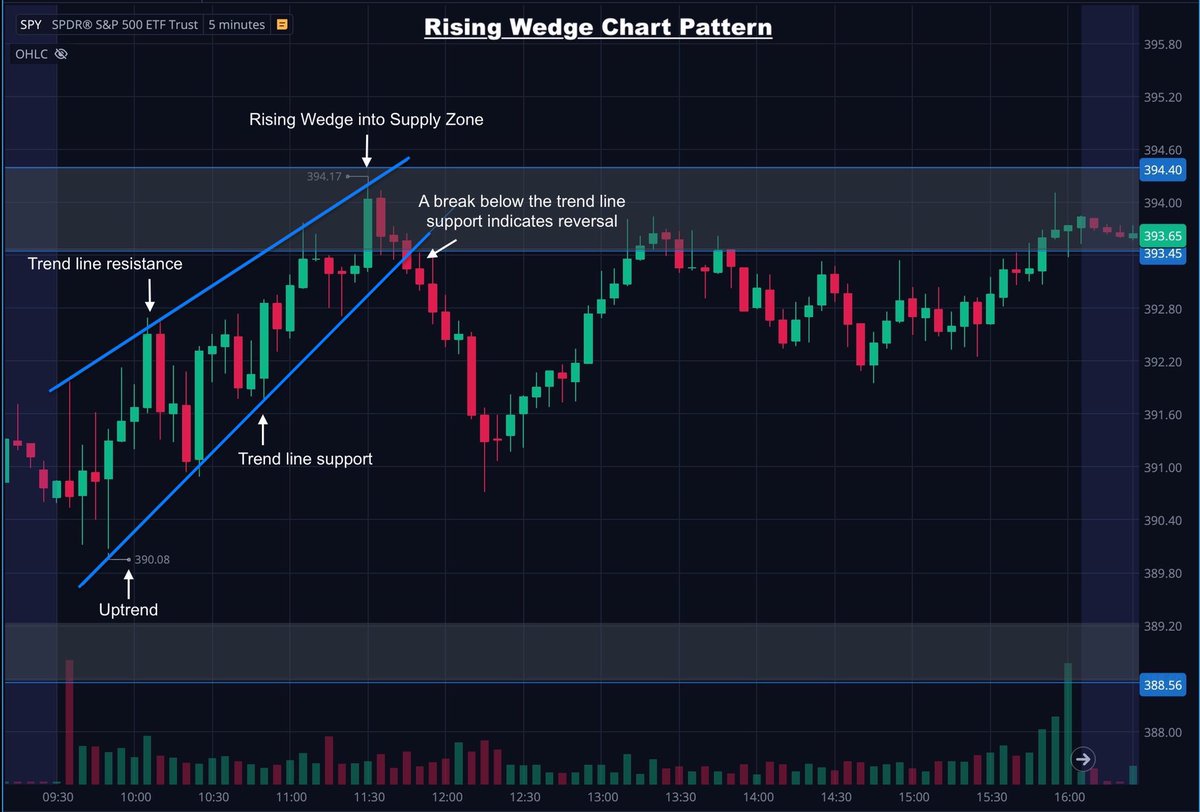
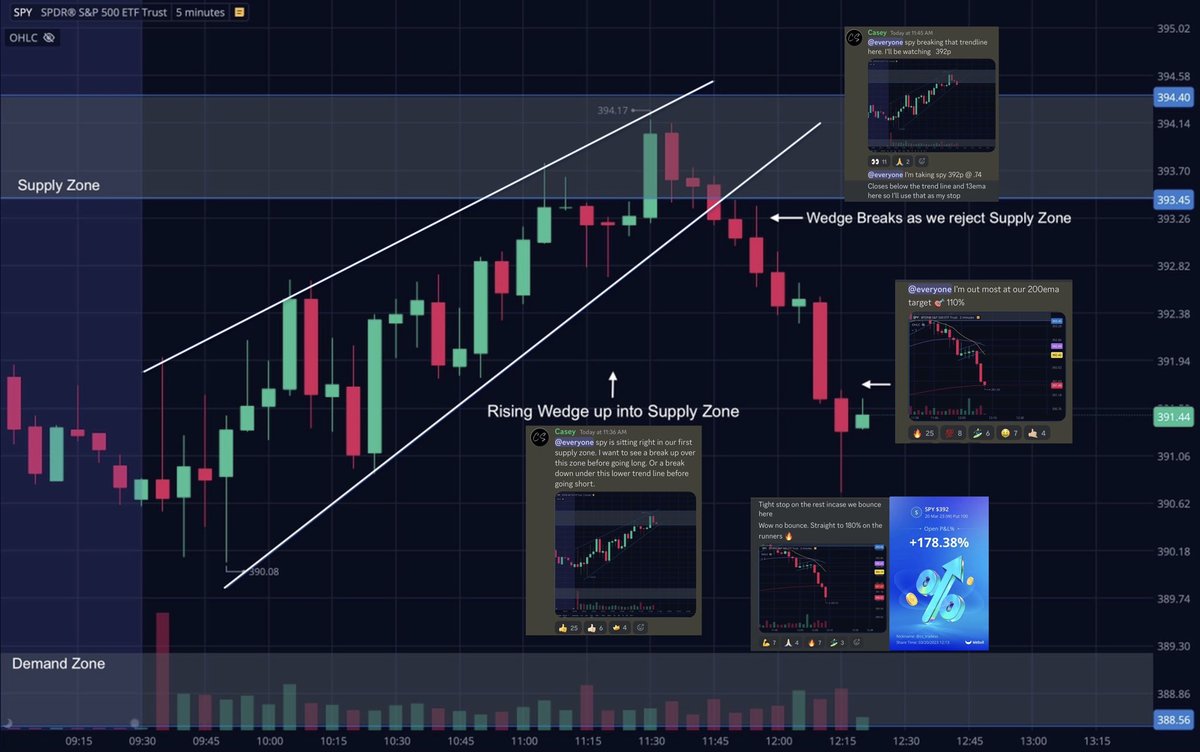
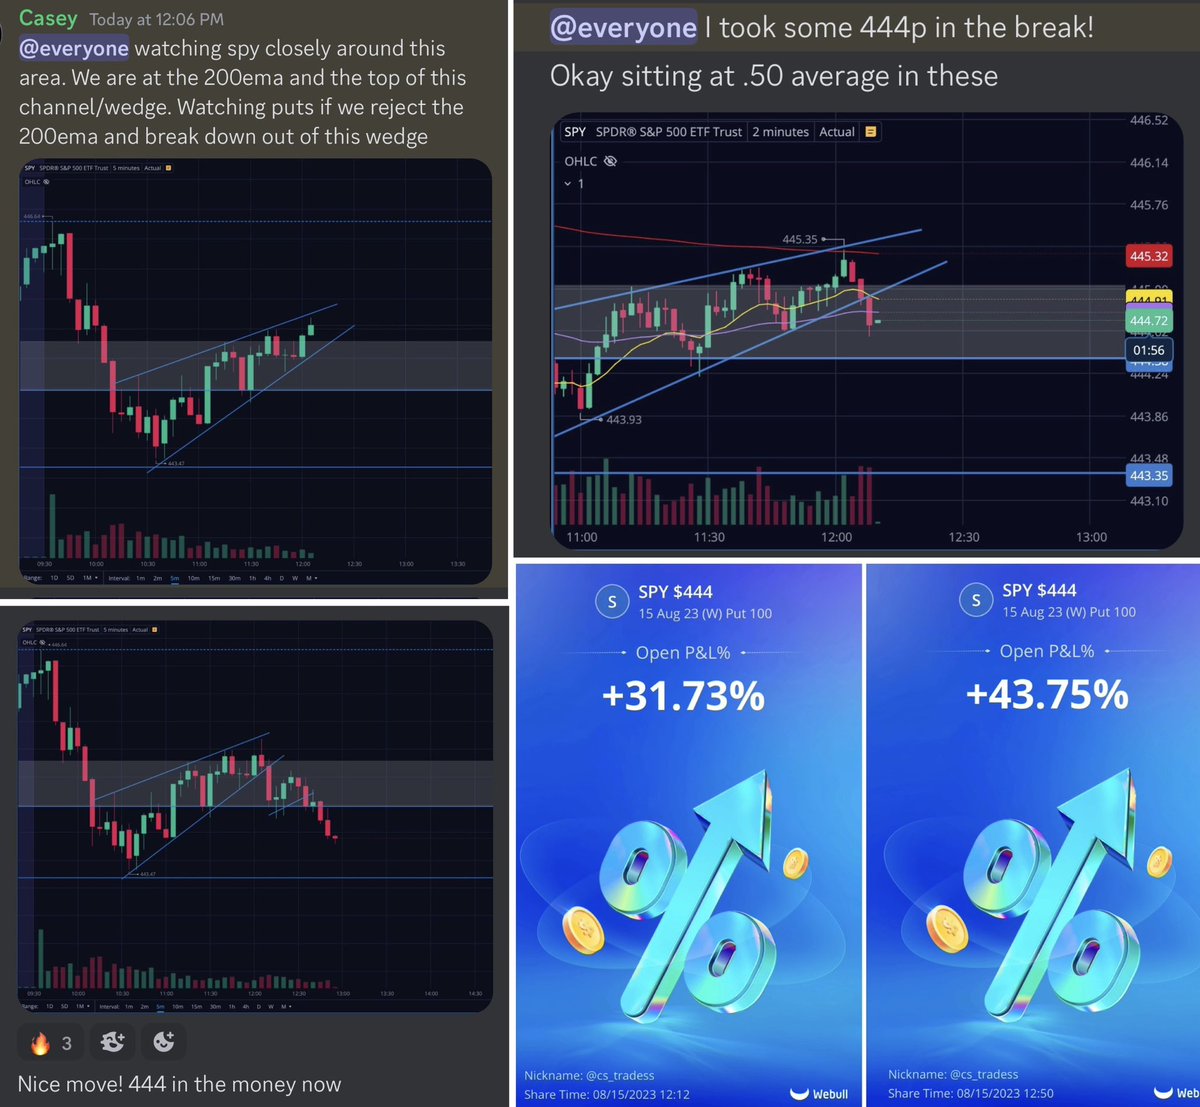
Rising wedges! The opposite of the falling wedge. Made up of 2 trend lines consisting of higher highs and higher lows.
When price breaks the lower trend line it indicates a reversal in price and offers a great opportunity to go short ⬇️
When price breaks the lower trend line it indicates a reversal in price and offers a great opportunity to go short ⬇️
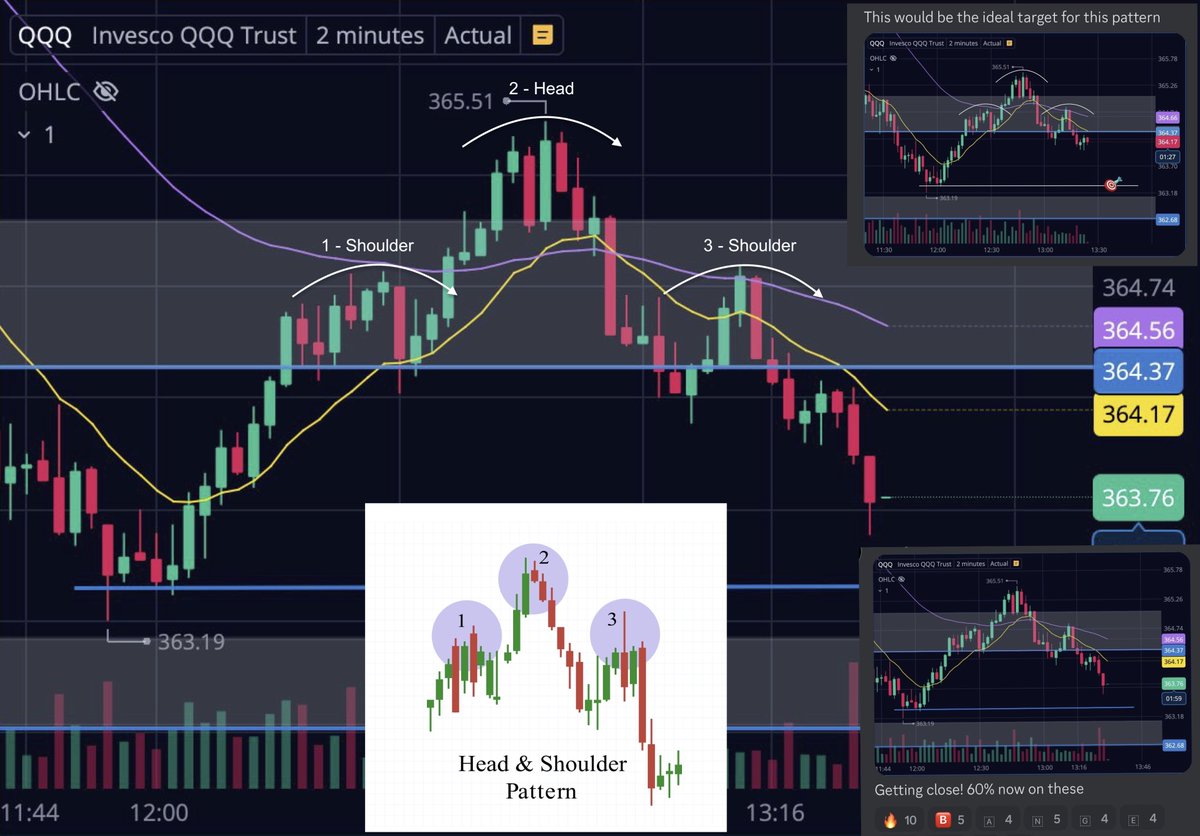
Head & Shoulders! A bearish chart patterns made up of 3 parts ⬇️
1- Right shoulder
2- Head just above that first shoulder
3- Left shoulder
Not my favorite to trade but something to watch when you see one form. Flip this pattern upside down for the bullish version or inverse H&S
1- Right shoulder
2- Head just above that first shoulder
3- Left shoulder
Not my favorite to trade but something to watch when you see one form. Flip this pattern upside down for the bullish version or inverse H&S
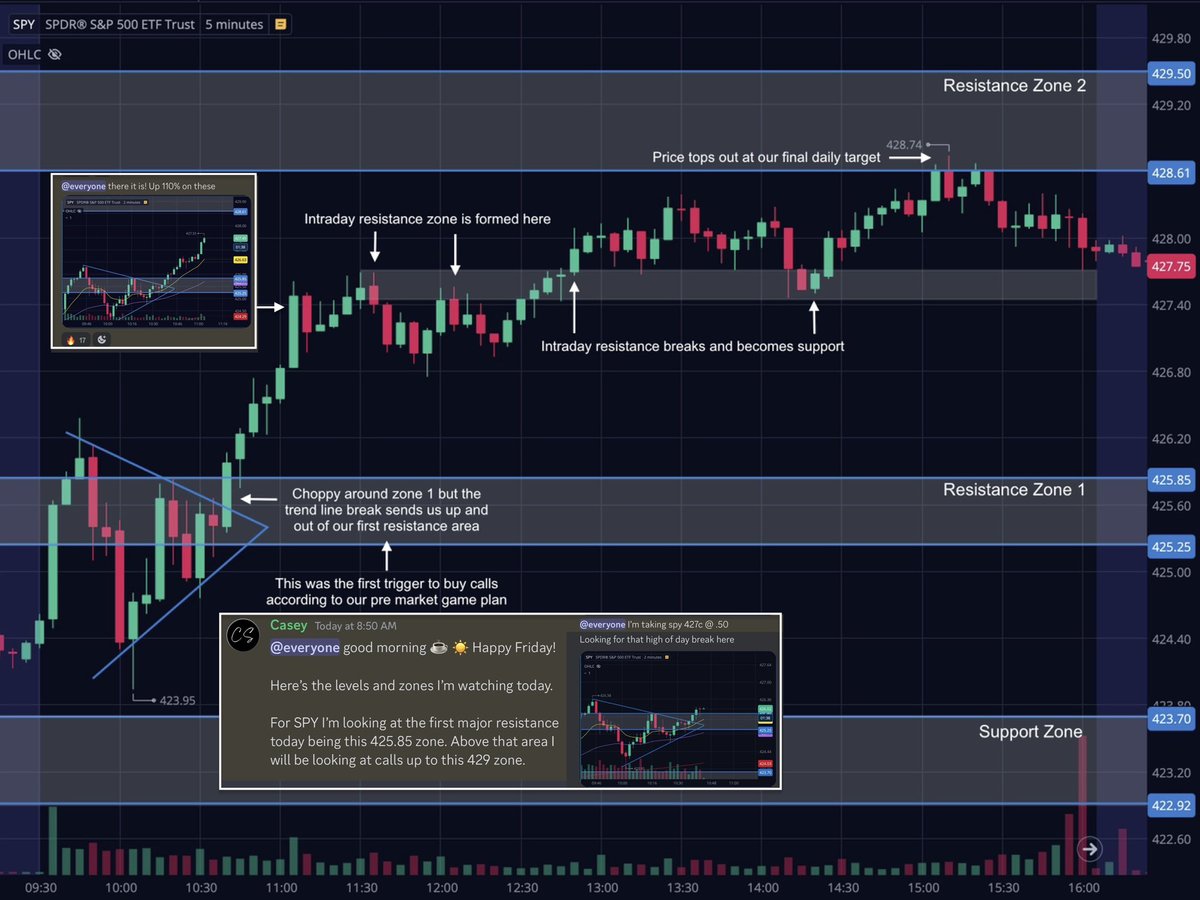
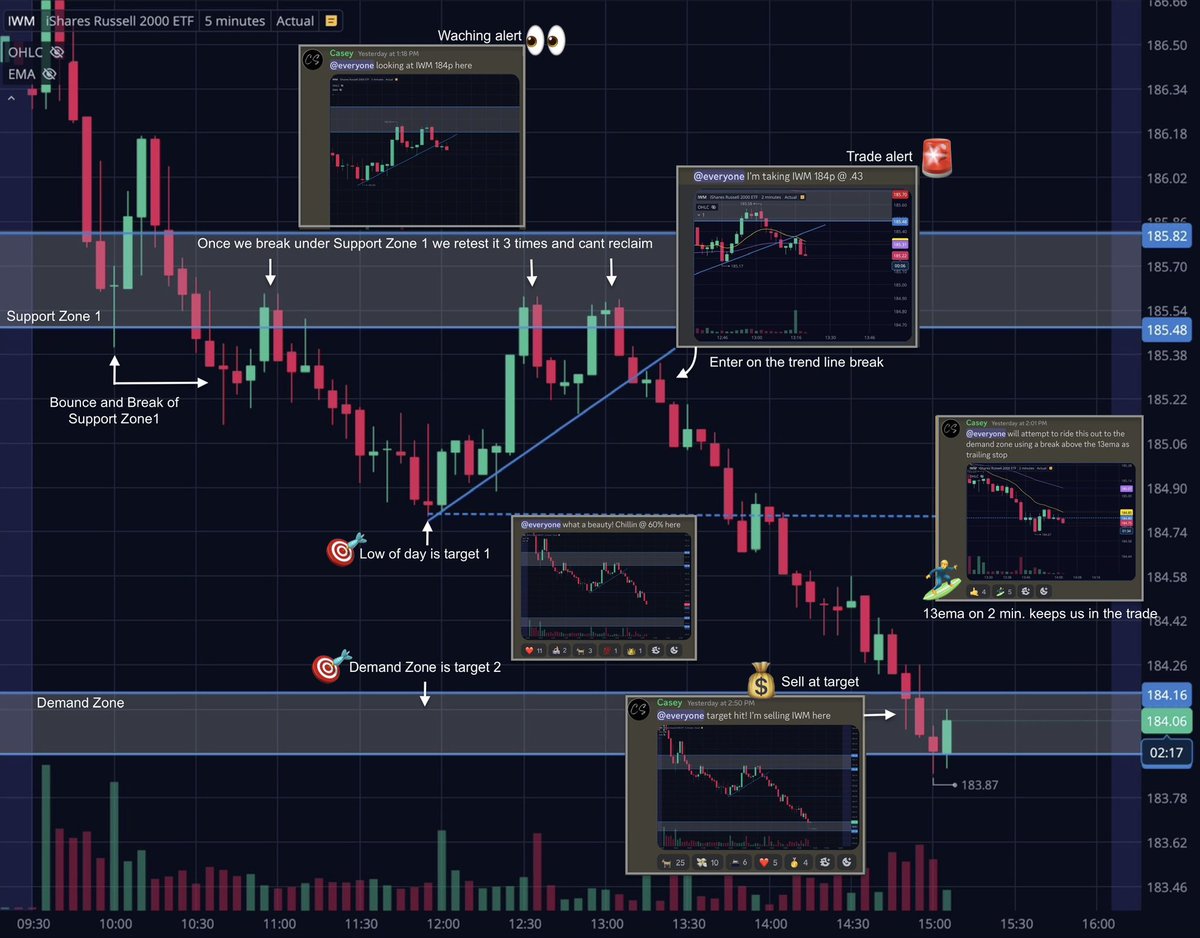
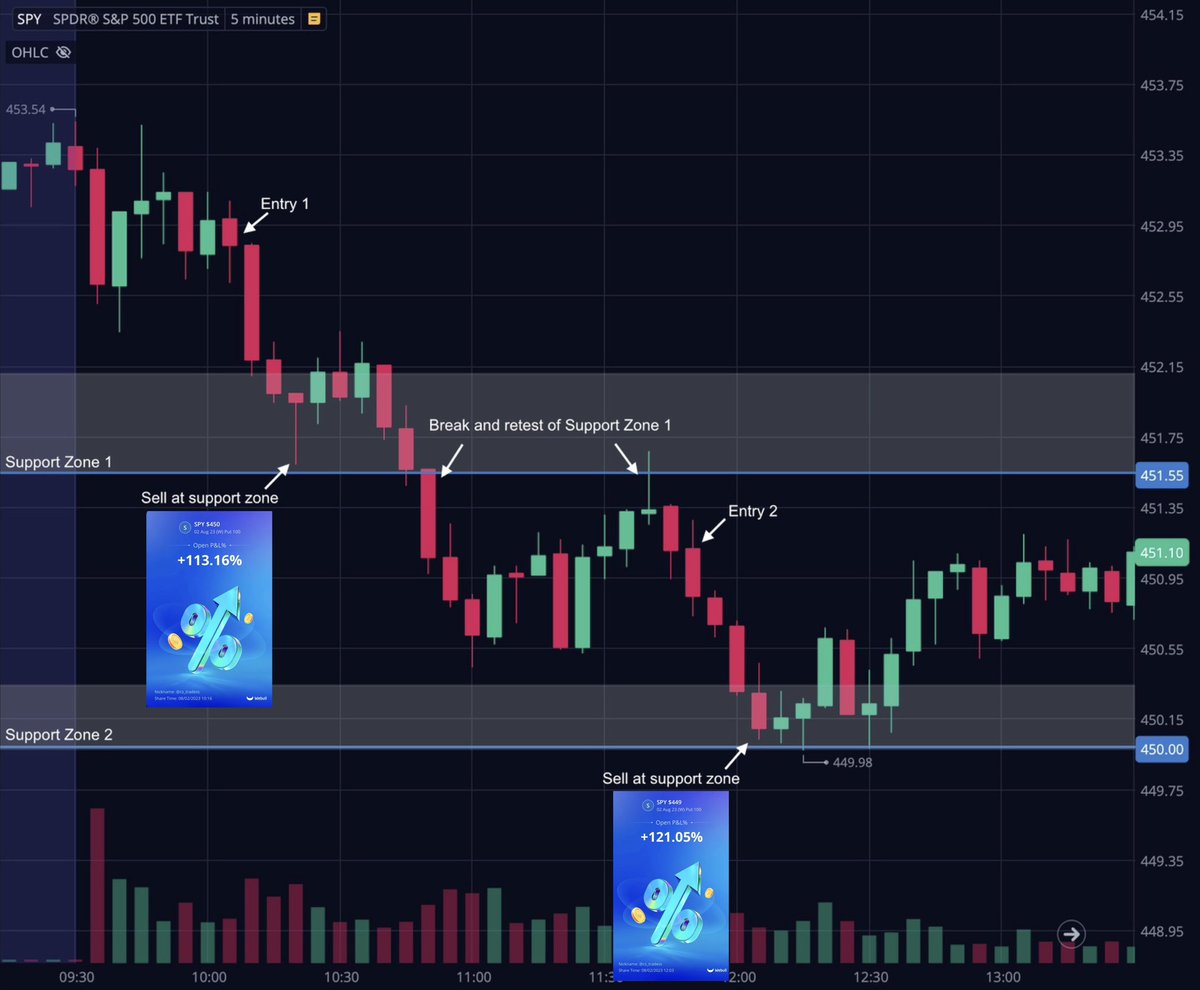
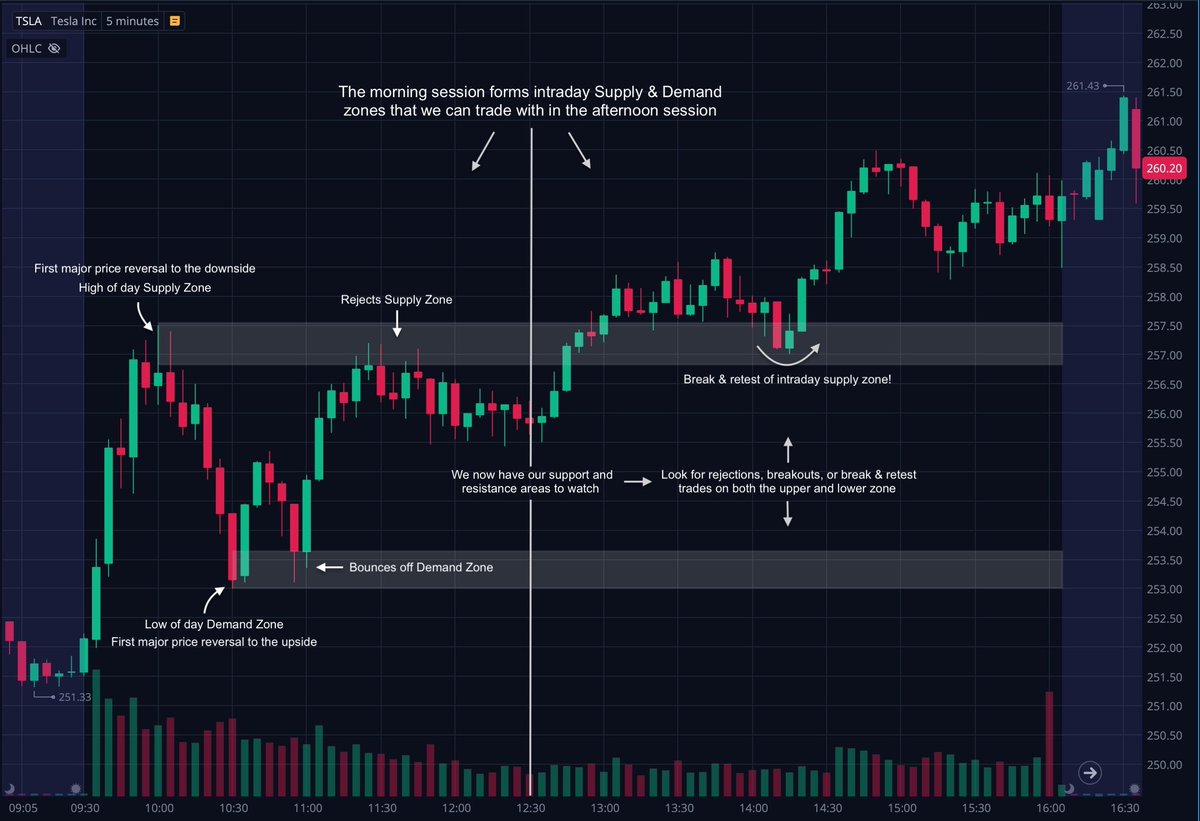
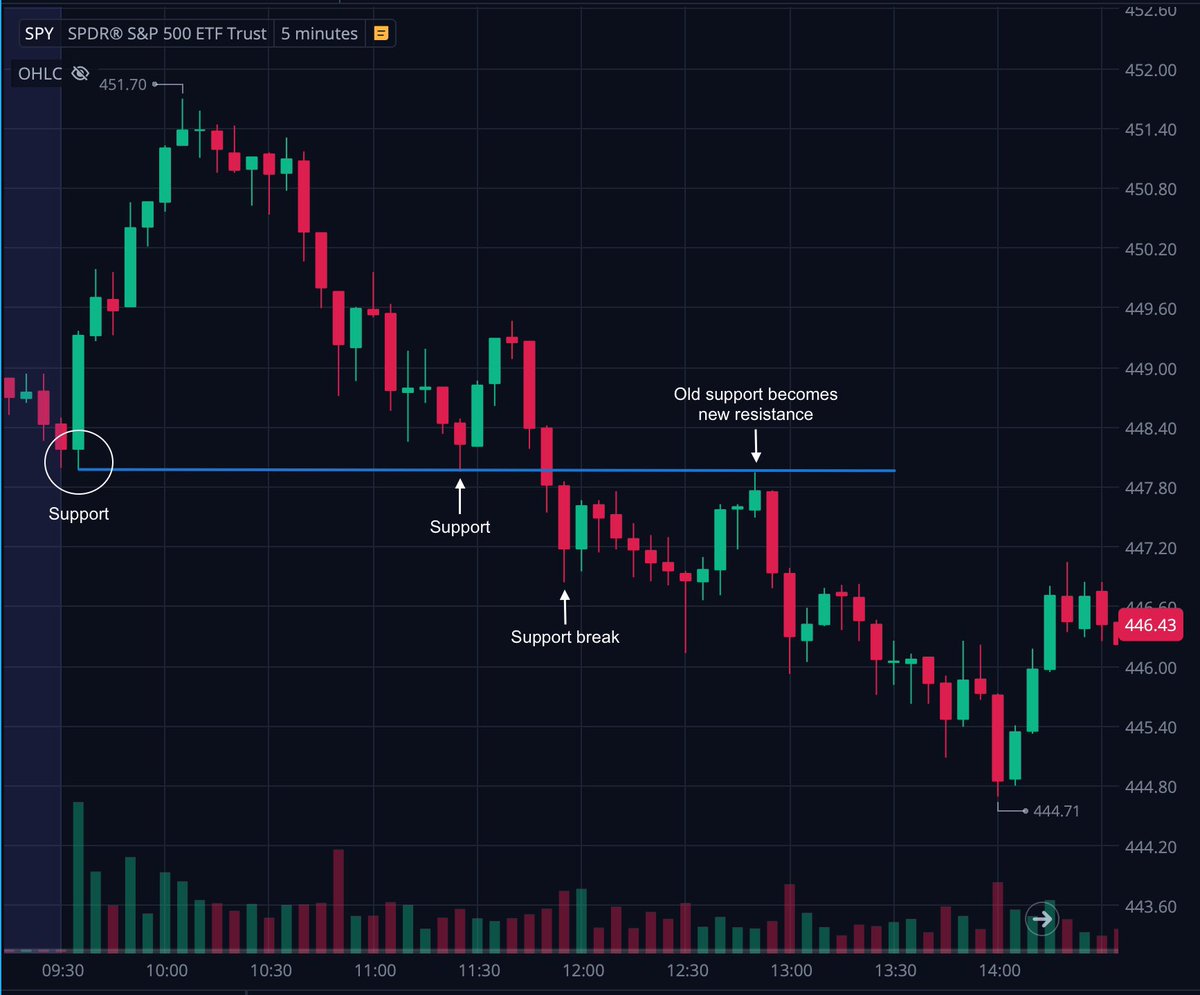
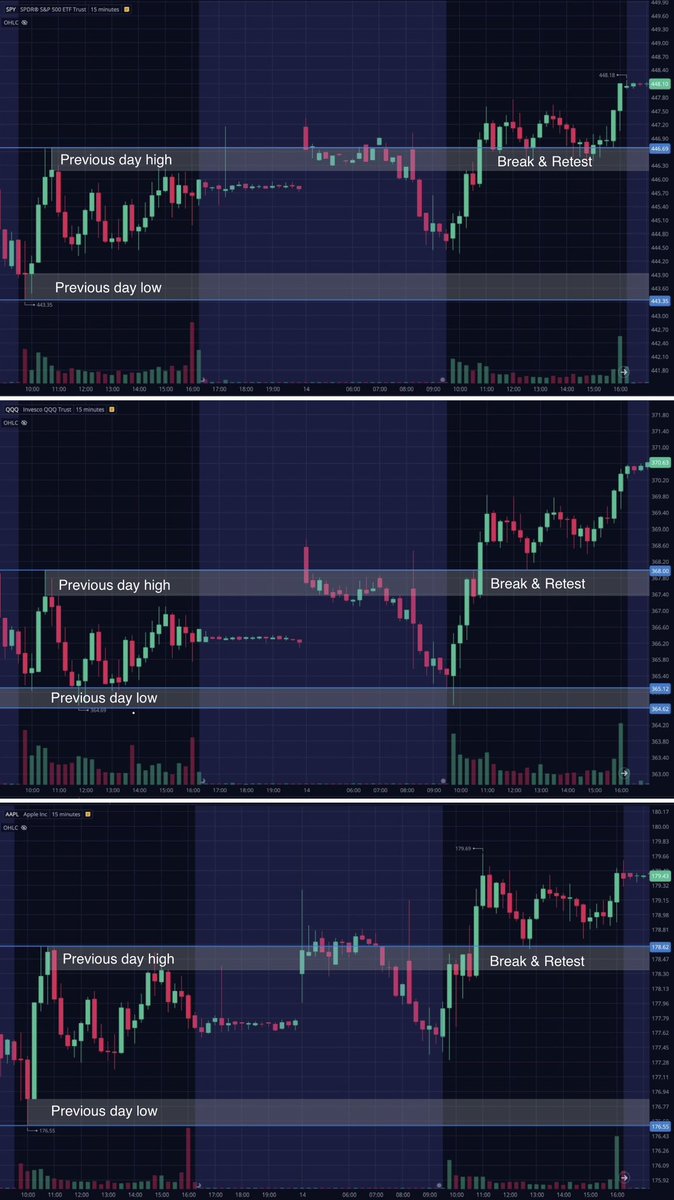
Support & Resistance! The most important chart pattern of them all. Everything works better when you trade around S&R levels.
The 3 most common ways to trade them ⬇️
Bounce/Rejection of a level ✅
Breakout of a level ✅
Break and retest of a level ✅
The 3 most common ways to trade them ⬇️
Bounce/Rejection of a level ✅
Breakout of a level ✅
Break and retest of a level ✅
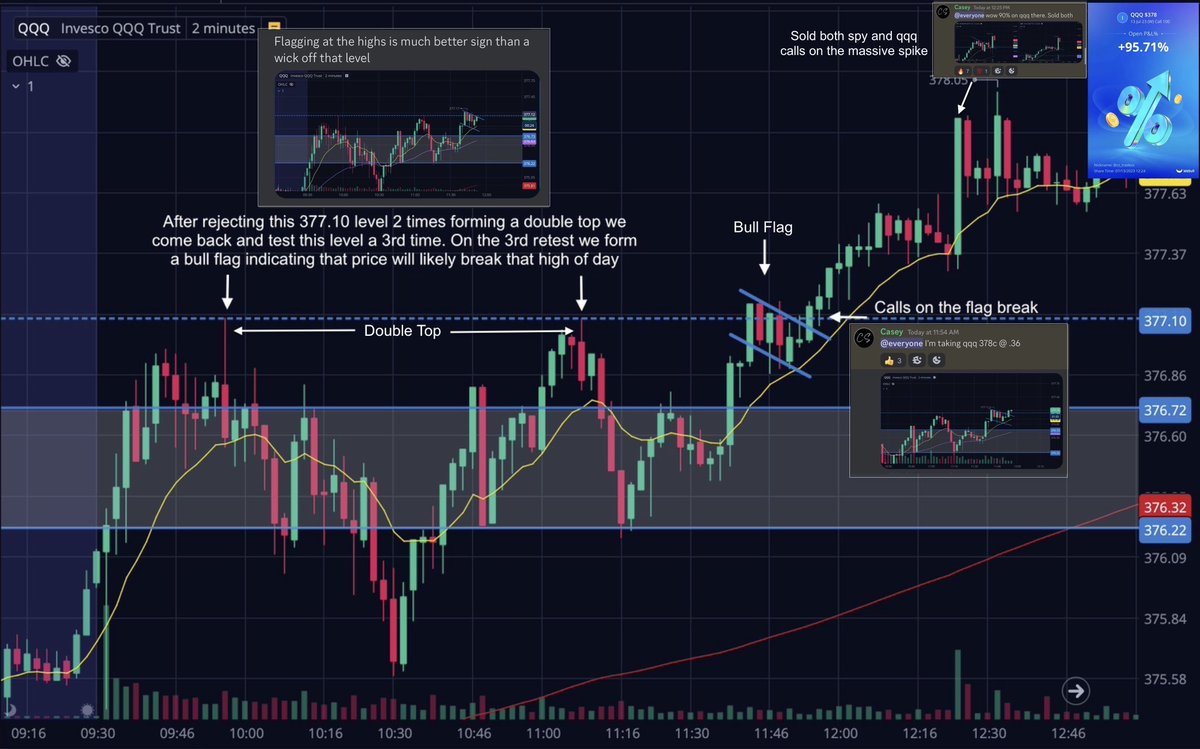
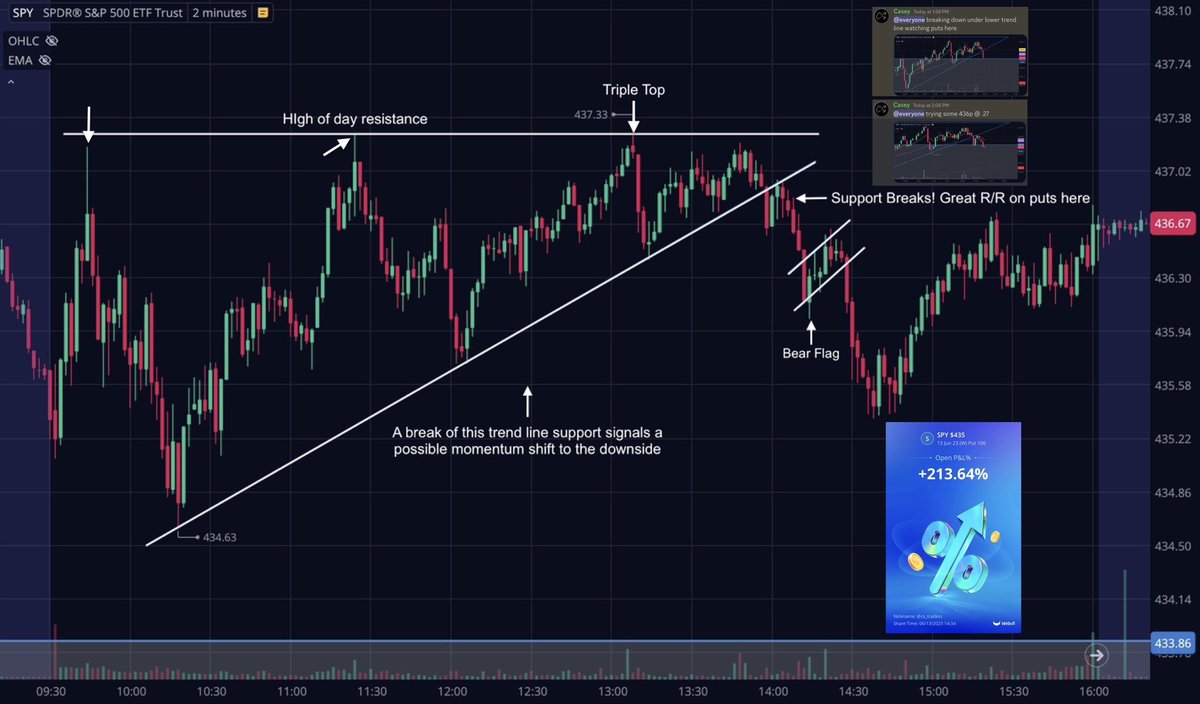
Multiple chart patterns together can tell a story and give you a excellent sense of direction on the day.
This example below shows a triple top, followed by a trend line support break, completed with a bear flag shortly after. This is called multiple confirmation trade ⬇️
This example below shows a triple top, followed by a trend line support break, completed with a bear flag shortly after. This is called multiple confirmation trade ⬇️
That wraps up this thread on common chart patterns! Thanks for reading 🙏 If you enjoyed it or learned something give it a ❤️ & ♻️ to share it. Let's all bank together!
Here's a link to the room where I call all my plays and we learn & earn daily ⬇️
patreon.com
Here's a link to the room where I call all my plays and we learn & earn daily ⬇️
patreon.com

Loading suggestions...