

$NZDUSD top down analysis in a thread 🧵💎

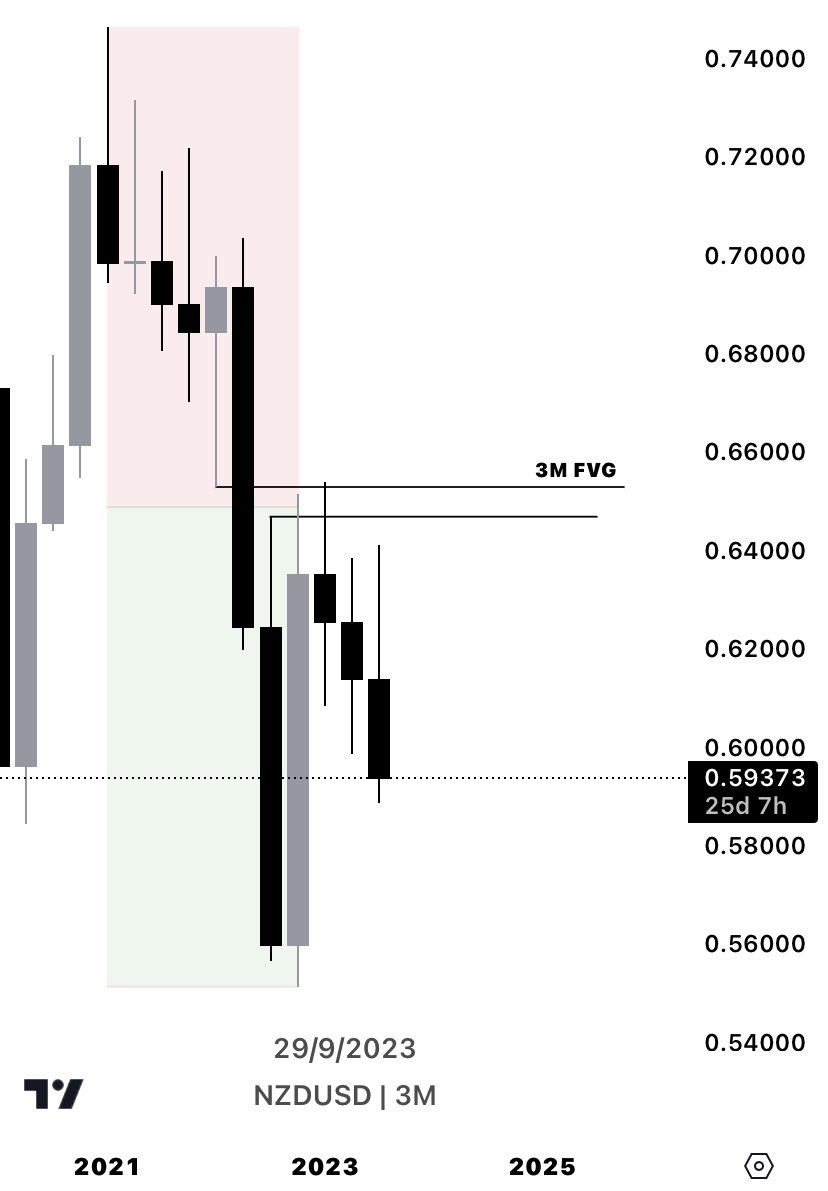
Starting with the 3 month timeframe ( don’t let this scare you away )
I only use the 3 month timeframe to get a better understanding of the 1 month timeframe.
What do we see ?
I only use the 3 month timeframe to get a better understanding of the 1 month timeframe.
What do we see ?

We see we tapped into a 3 month FVG, which was respected by price.
We also see all candles closed below the 3 month FVG
(wicks do the damage, bodies tell the story ! ) @I_Am_The_ICT
Let’s move onto the 1 month timeframe.
We also see all candles closed below the 3 month FVG
(wicks do the damage, bodies tell the story ! ) @I_Am_The_ICT
Let’s move onto the 1 month timeframe.
What do we see ?
First of all, 1 month candles also closing below the 3 month FVG
First of all, 1 month candles also closing below the 3 month FVG
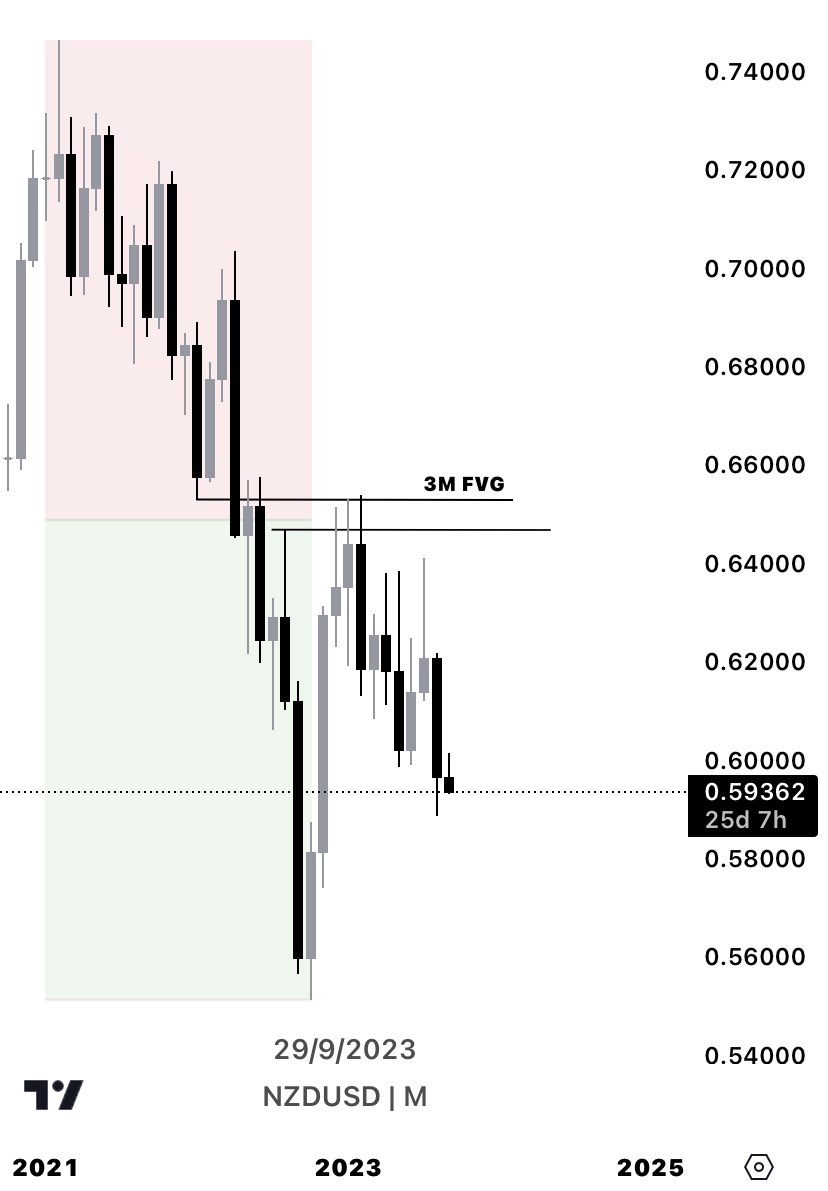
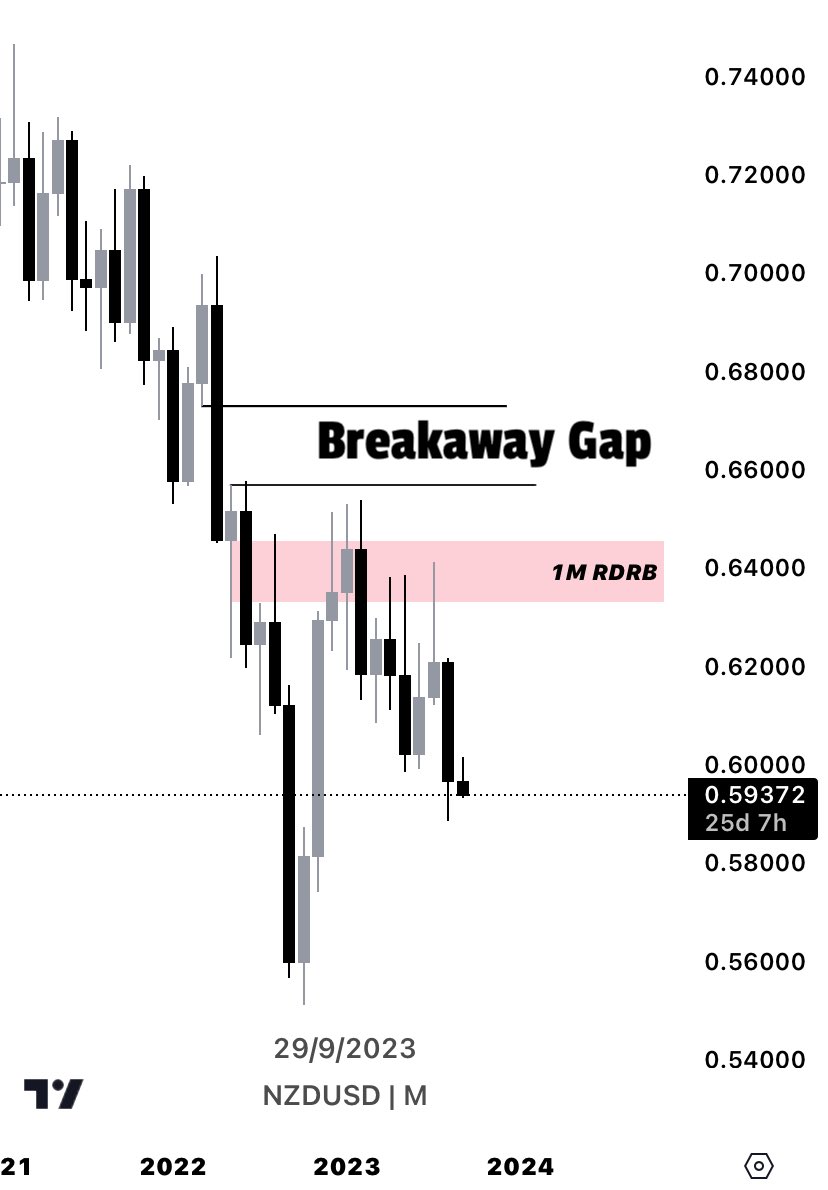
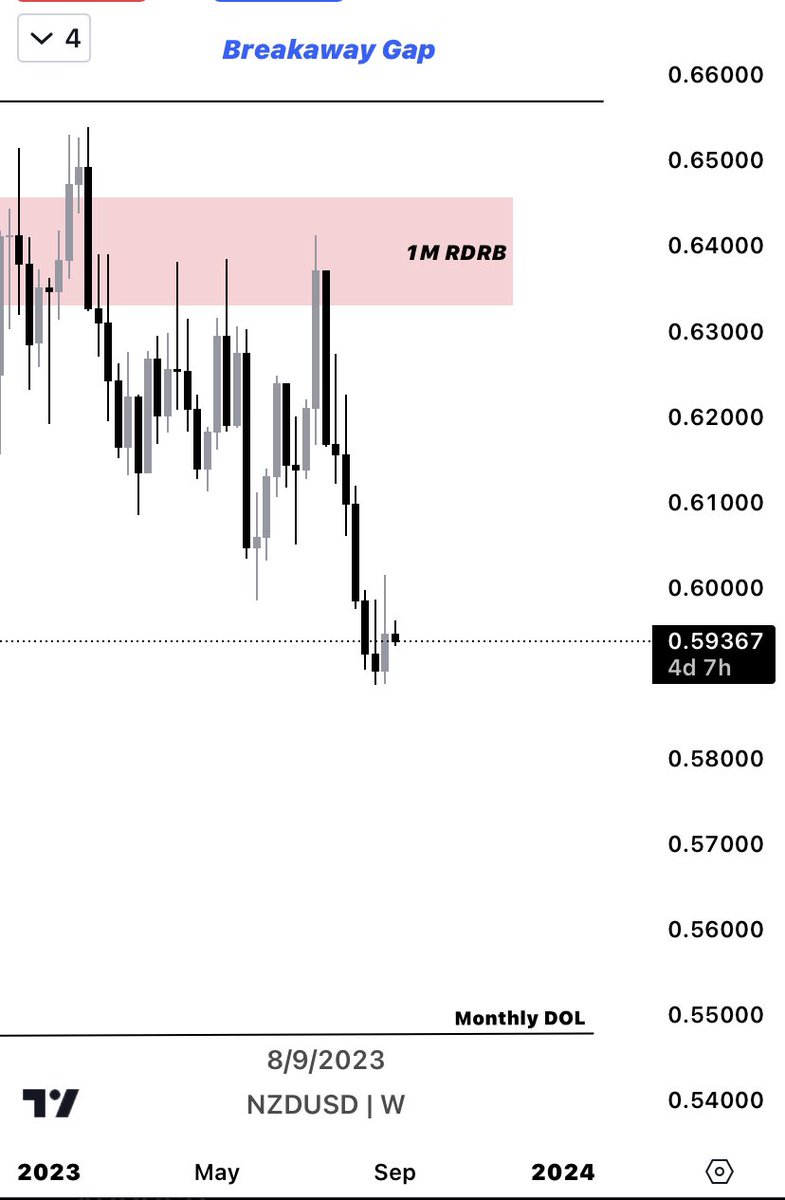
Well we see we tapped into a 1M RDRB price range.
• RDRB = Redelivered Rebalanced
This RDRB is actually what makes the FVG above, a breakaway gap.
More confirmation we are interested in lower prices.
• RDRB = Redelivered Rebalanced
This RDRB is actually what makes the FVG above, a breakaway gap.
More confirmation we are interested in lower prices.
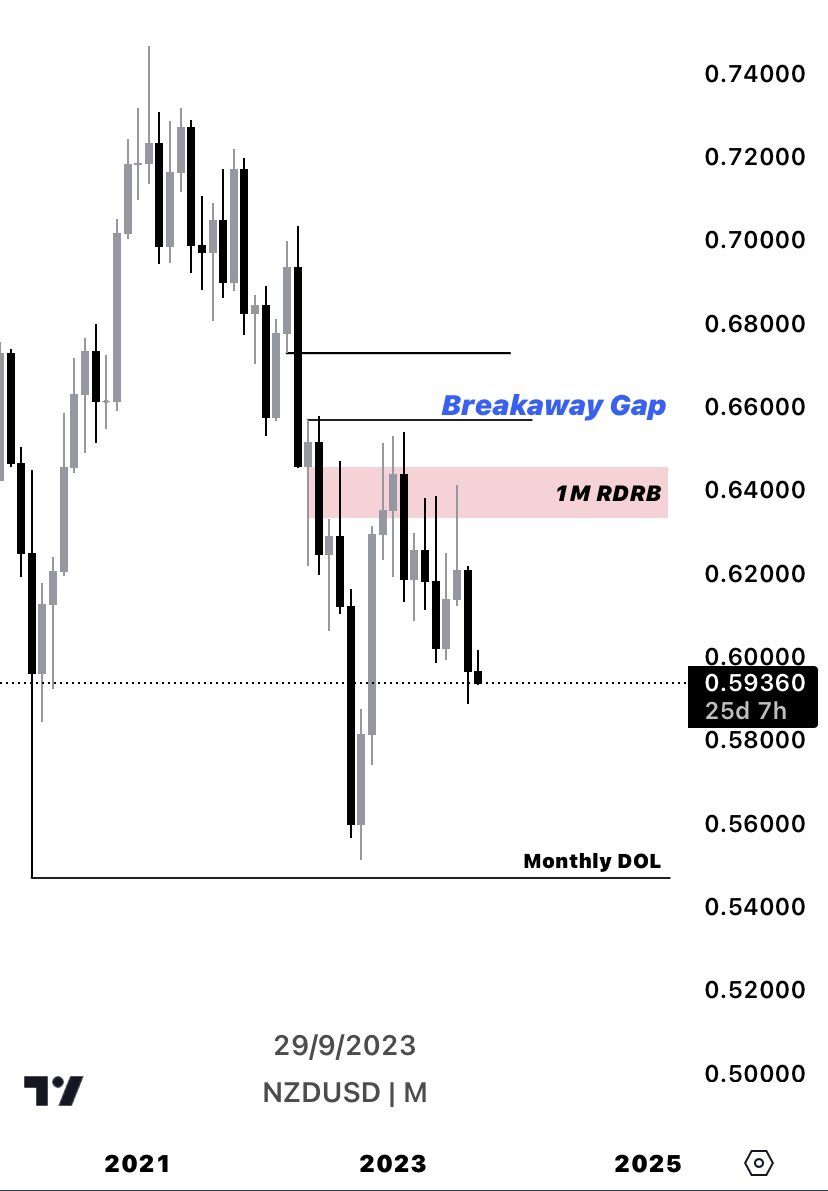
All of this is extra confirmation that our DOL is lower
• DOL = Draw On Liquidity
Those relative equal lows.
Also our 3 month Draw on Liquidity
So overall, we are bearish on the monthly timeframe.
• DOL = Draw On Liquidity
Those relative equal lows.
Also our 3 month Draw on Liquidity
So overall, we are bearish on the monthly timeframe.
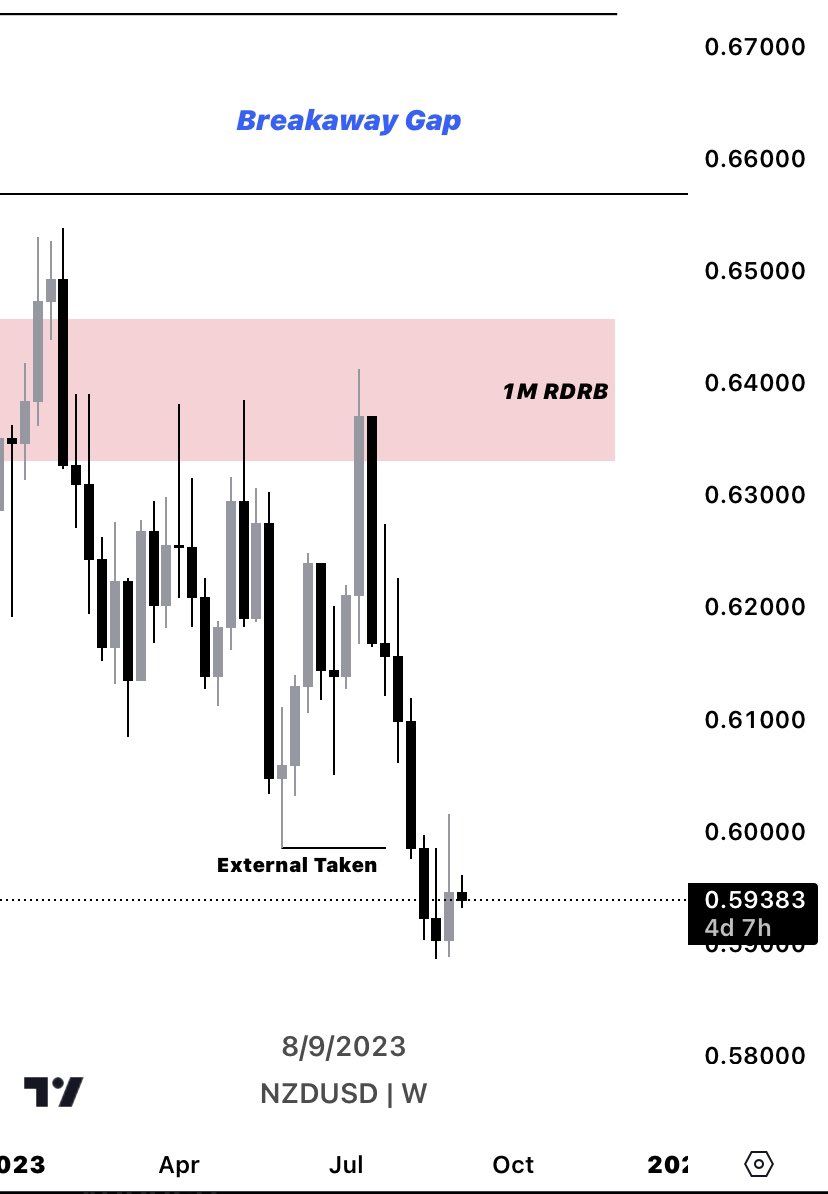
What do we see on the weekly ??
We see we took external range liquidity.
We should have then been interested in what ??
Eternal > Internal
So…. Internal range liquidity.
We see we tapped into a weekly FVG as of right now.
We should have then been interested in what ??
Eternal > Internal
So…. Internal range liquidity.
We see we tapped into a weekly FVG as of right now.
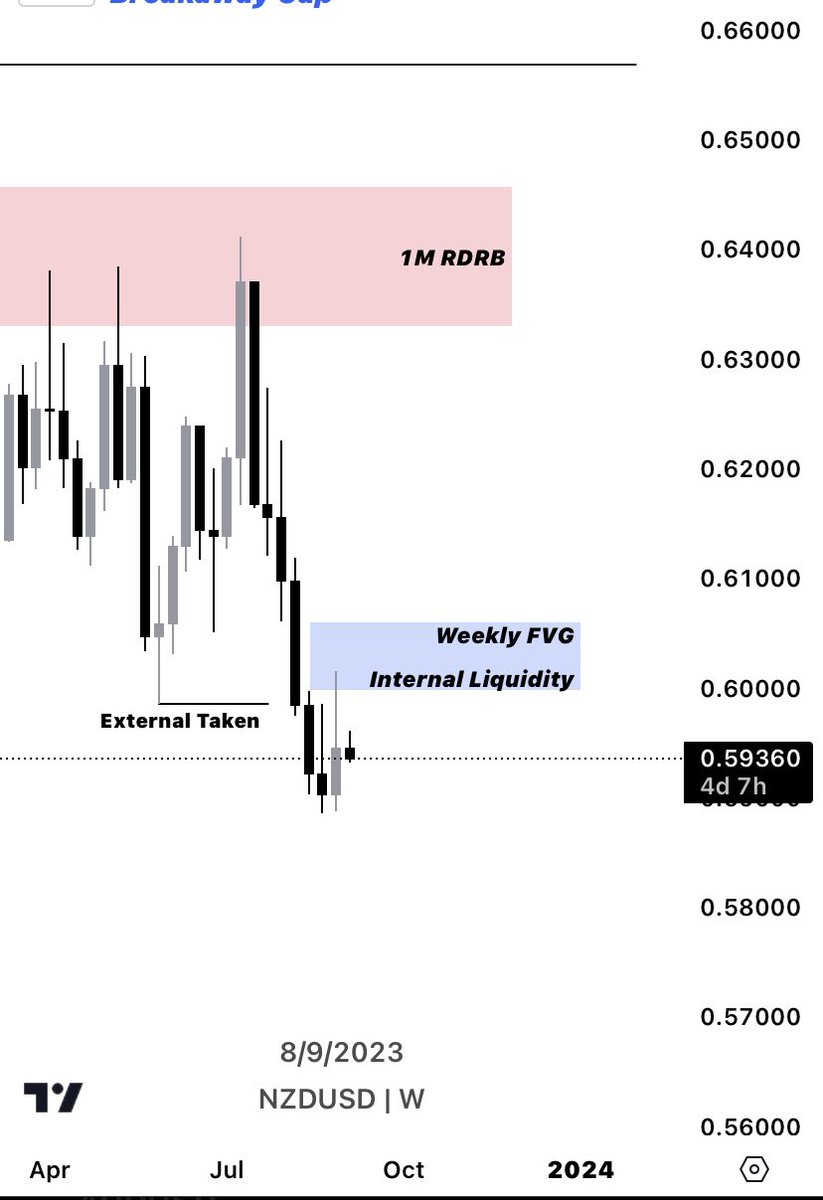
We see we tapped into a weekly FVG
AKA ?? Internal range liquidity.
We should use this internal range liquidity on the Weekly, to push towards our monthly DOL
• DOL = Draw on Liquidity
We could possibly fill this weekly FVG
But if it doesn’t, adapt.
AKA ?? Internal range liquidity.
We should use this internal range liquidity on the Weekly, to push towards our monthly DOL
• DOL = Draw on Liquidity
We could possibly fill this weekly FVG
But if it doesn’t, adapt.
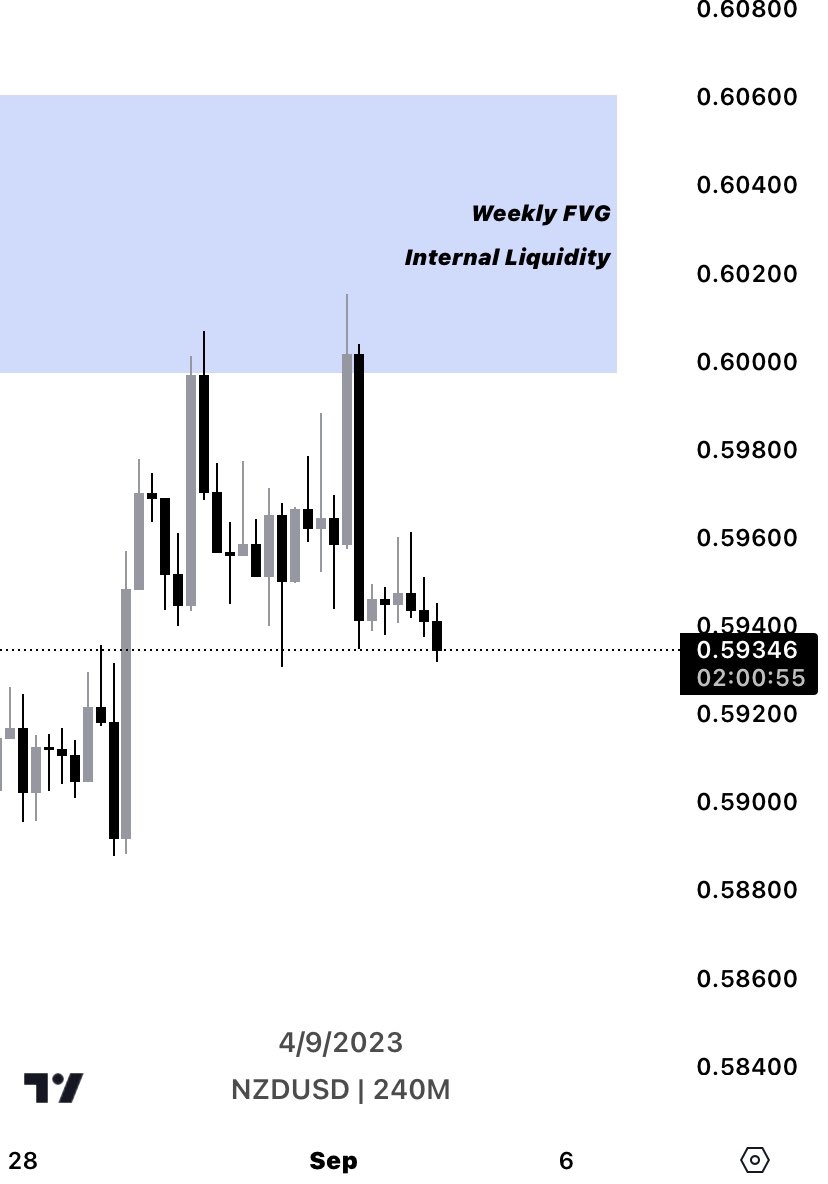
Let’s move onto the 4H to confirm our weekly bias.
We see there has been no clean market structure shift to the downside to confirm this idea.
So we sit on our hands until this is confirmed, because we could fill this FVG before continuing lower.
So without a MSS this idea is…
We see there has been no clean market structure shift to the downside to confirm this idea.
So we sit on our hands until this is confirmed, because we could fill this FVG before continuing lower.
So without a MSS this idea is…
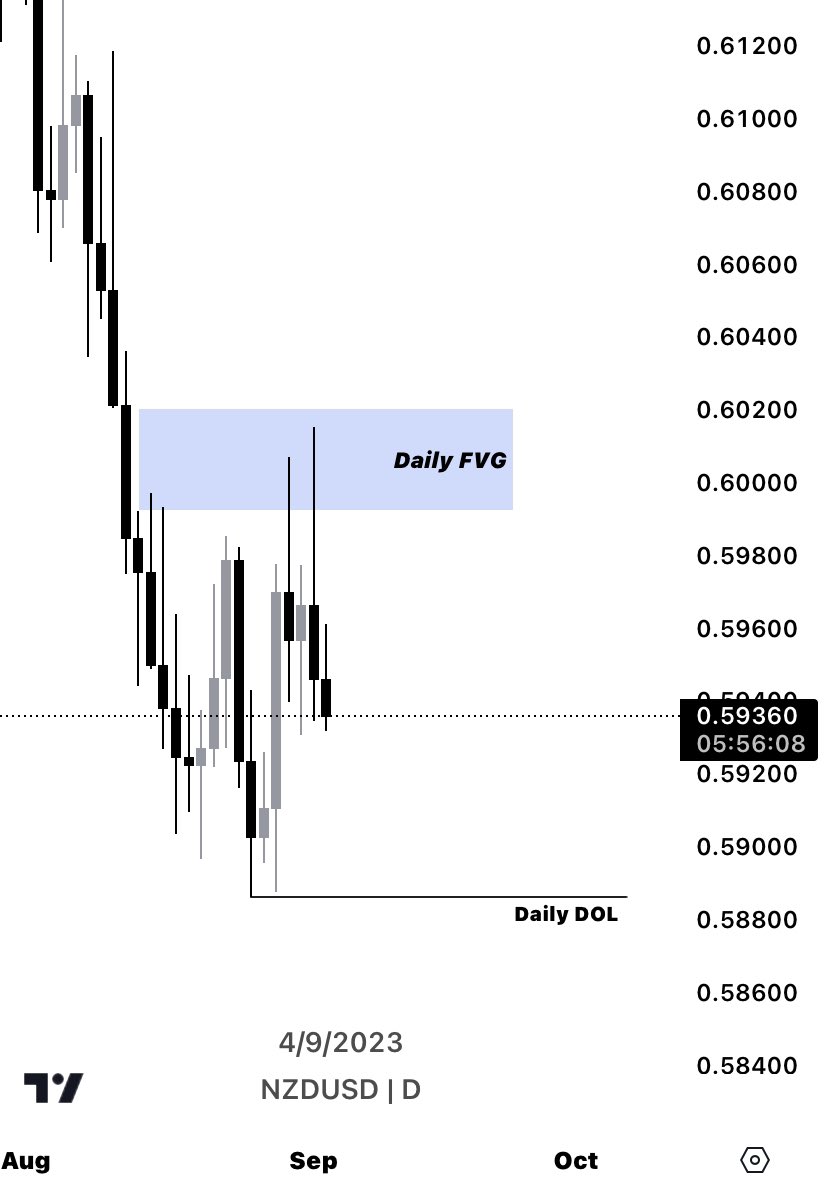
Let’s move onto the daily
What do we see ?
What do we see ?
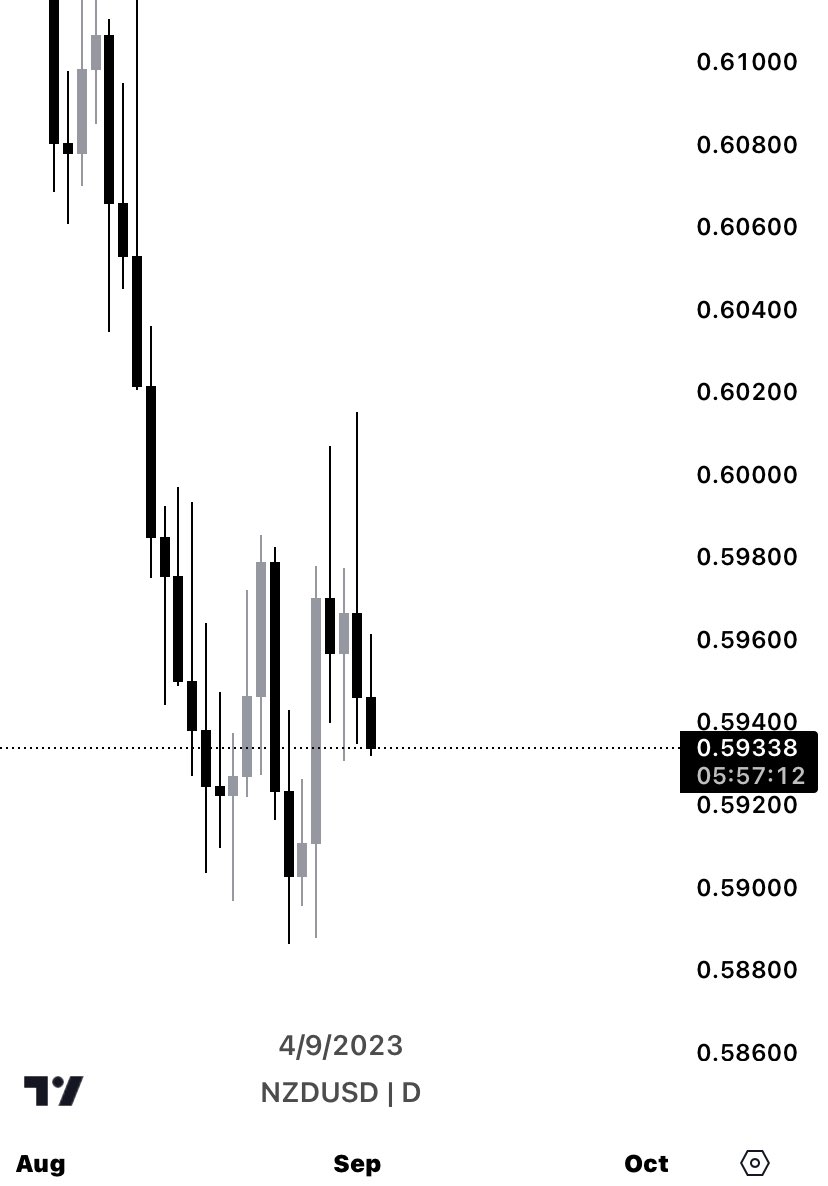
After tapping into this daily FVG, we can see, our draw on liquidity is lower.
We would need a clean market structure shift on the 1H to confirm this idea
We would need a clean market structure shift on the 1H to confirm this idea
Good luck this week 💞
Any information I gave you must be confirmed on lower time frames.
Weekly > 4H > 15min
Monthly > Daily > 1H > 5min
Did you learn something from this thread ? 🧵🥷🏽
Any information I gave you must be confirmed on lower time frames.
Weekly > 4H > 15min
Monthly > Daily > 1H > 5min
Did you learn something from this thread ? 🧵🥷🏽
Loading suggestions...