

Confidence ellipse can help to identify outliers 🔽
Here is how to draw it!
1/5
Here is how to draw it!
1/5

Looking at a simple scatterplot it is hard to define the border between "normal" values and outliers.
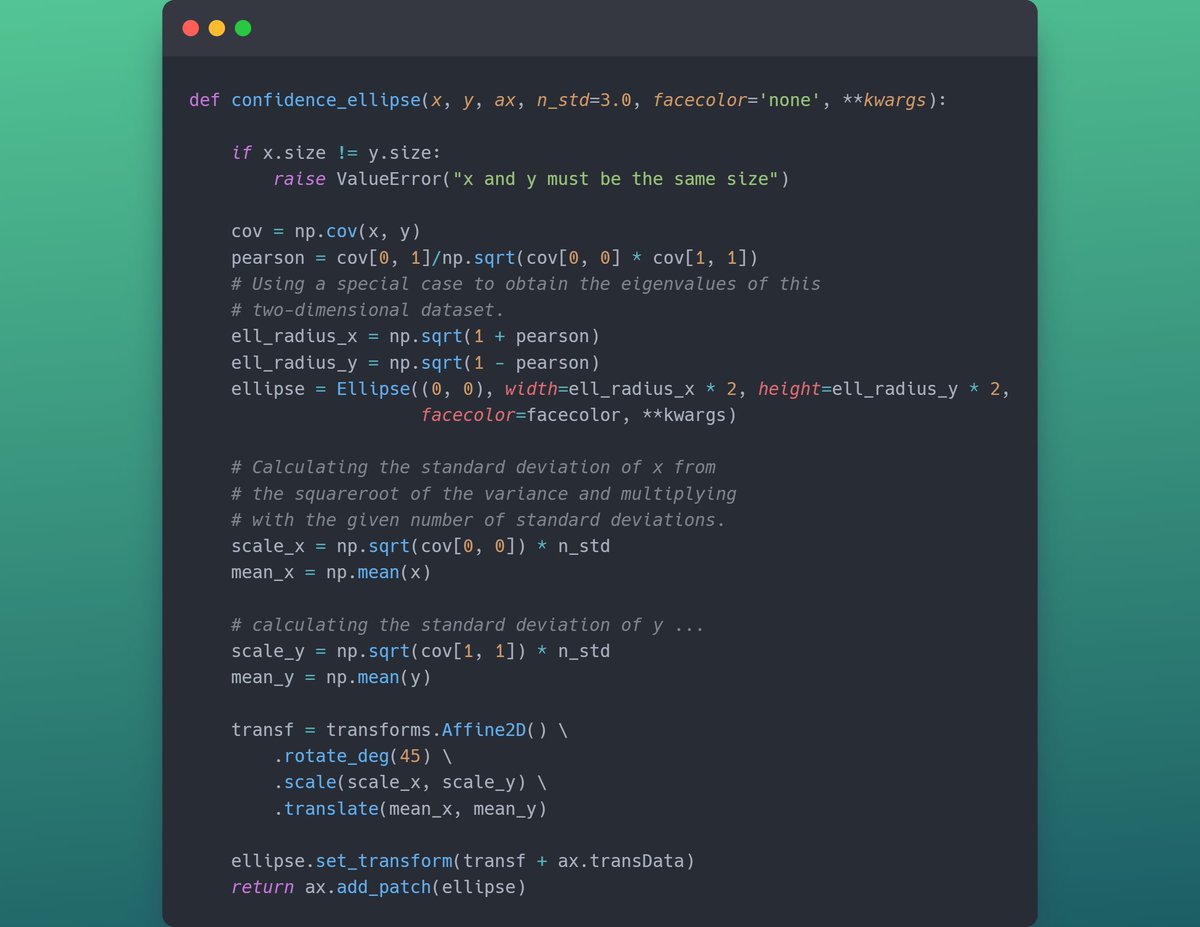
But with matplotlib, it is easy to draw the confidence ellipse, which will help to decide.
Find the code below 👇
2/5
But with matplotlib, it is easy to draw the confidence ellipse, which will help to decide.
Find the code below 👇
2/5

Matpltolib uses standard deviation to determine outliers.
The default value is 3 which makes the ellipse enclose 98.9% of the points.
Here is the link to the code: matplotlib.org
3/5
The default value is 3 which makes the ellipse enclose 98.9% of the points.
Here is the link to the code: matplotlib.org
3/5

That's it for today.
I hope you've found this thread helpful.
Like/Retweet the first tweet below for support and follow @levikul09 for more Data Science threads.
Thanks 😉
4/5
I hope you've found this thread helpful.
Like/Retweet the first tweet below for support and follow @levikul09 for more Data Science threads.
Thanks 😉
4/5
You should also join our newsletter, DSBoost.
We share:
• Interviews
• Podcast notes
• Learning resources
• Interesting collections of content
dsboost.dev
5/5
We share:
• Interviews
• Podcast notes
• Learning resources
• Interesting collections of content
dsboost.dev
5/5

Loading suggestions...