

New York City just released a report titled "Crime and Enforcement Activity in New York City" for 2022. It tracks the identities of victims, suspects, and arrestees. Here are some of the highlights.
For context, NYC is about 32% white, 29% Hispanic, 23% black, and 14% Asian🧵
For context, NYC is about 32% white, 29% Hispanic, 23% black, and 14% Asian🧵
Let's start with "Misdemeanor Criminal Mischief." Here, the numbers are relatively even given what we'll see below. Black are only 50% of suspects and a smaller portion of arrestees.

In the area of murder, blacks are 63.8% of suspects, 57.8% of arrestees. Whites are only 2.9% of suspects. Interestingly, Asians commit murder at a higher rate than whites in NYC, a pattern we'll see in other crimes. I would guess this has something to do with age distributions

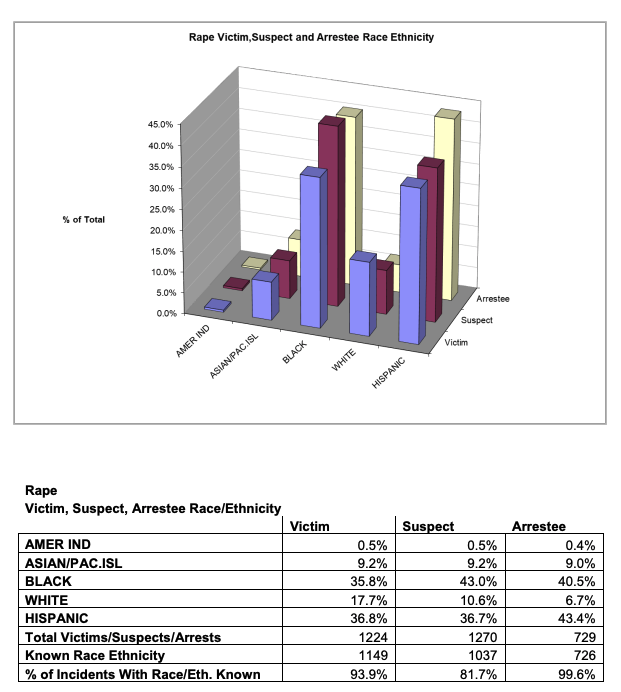
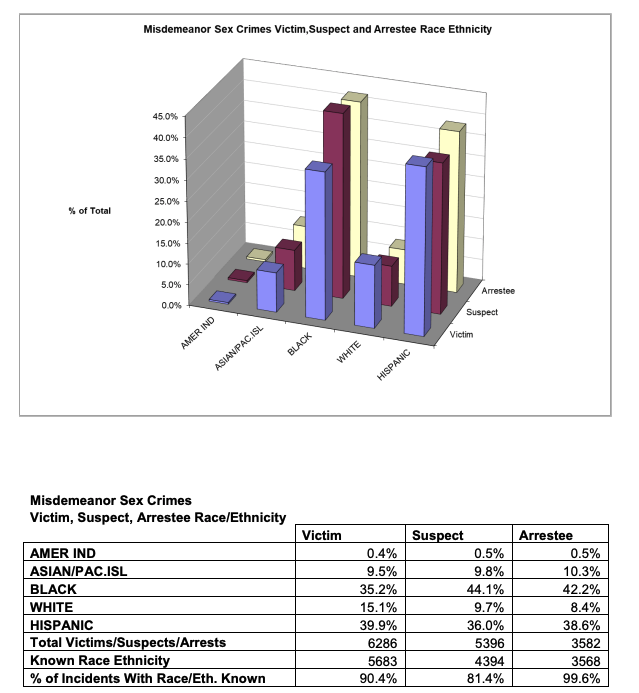
In rape, blacks are 43% of suspects, and Hispanics 36.7%. The same groups are over/under represented, but this is closer than most other crimes.
Whites are only 10.6% of suspects and 6.7% of arrestees, but relatively higher as victims, at 17.7%.
Whites are only 10.6% of suspects and 6.7% of arrestees, but relatively higher as victims, at 17.7%.
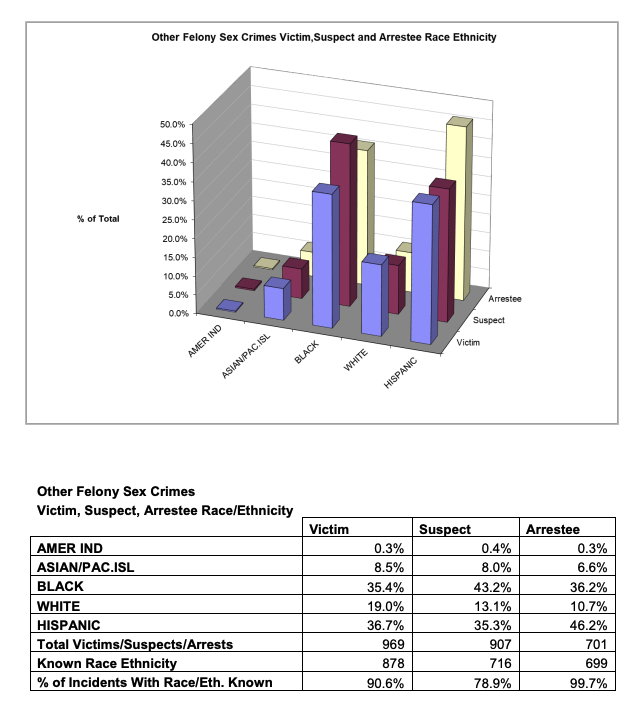
Other felony sex crimes look similar, so the pattern above isn't specific to rape.
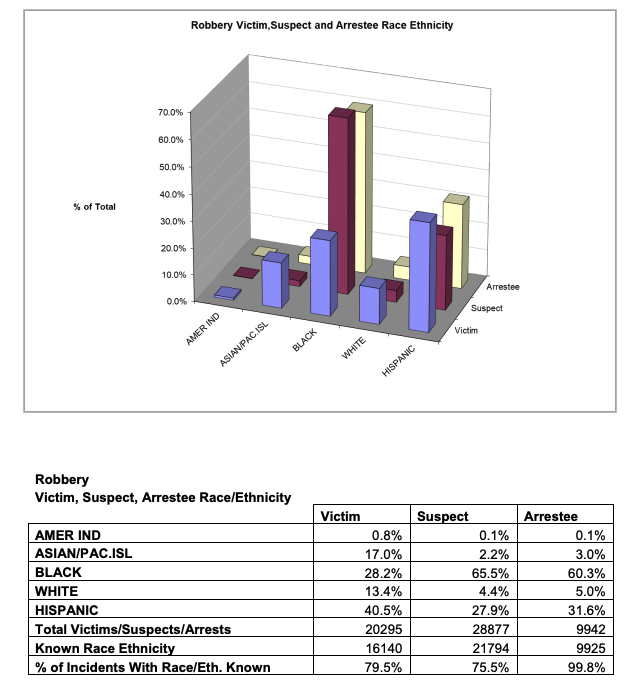
When it comes to robbery suspects, we see massive differences. Blacks are 65.5% and Hispanics 27.9%.
Only 28.2% of robbery victims are black. All other groups are overrepresented as victims, especially Asians.
Robbery involves a lot of blacks targeting people of other races.
Only 28.2% of robbery victims are black. All other groups are overrepresented as victims, especially Asians.
Robbery involves a lot of blacks targeting people of other races.
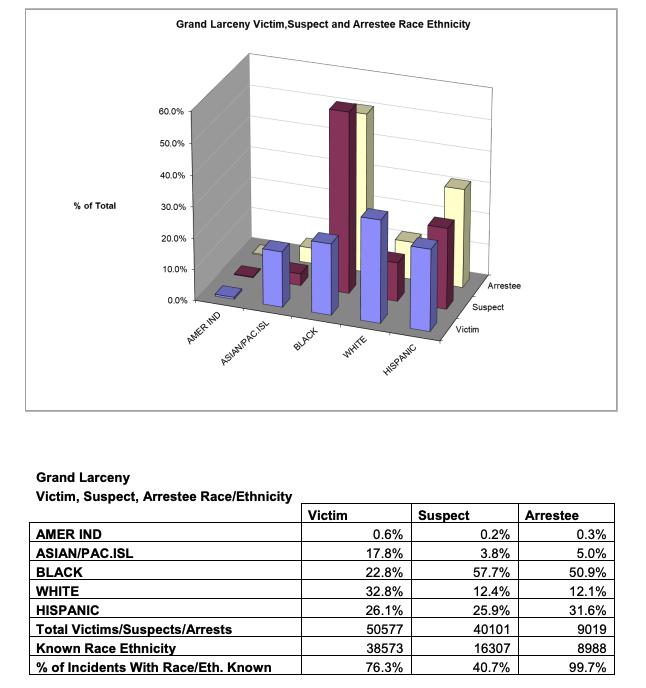
When it comes to "grand larceny", thefts over $1K, whites are 12% of suspects and 33% of victims! For Asians, the numbers are 4% and 18%.
Blacks are 58% of suspects, but only 23% of victims.
Blacks are 58% of suspects, but only 23% of victims.
Misdemeanor sex crimes look like rape and sexual assault. Are the numbers more even for sex crimes because people target those they know, meaning few opportunities to cross racial boundaries and more equality in numbers? Or is there another explanations?
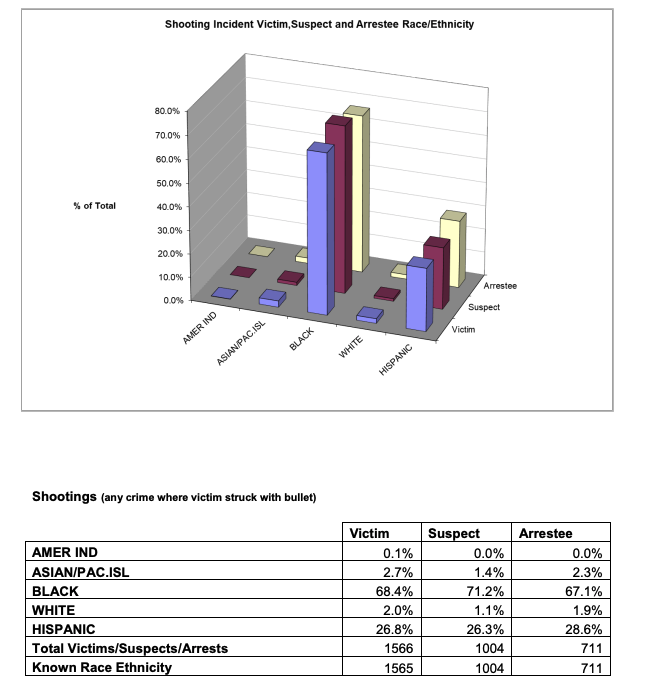
Number of shootings are off the charts in terms of disparities. Blacks are 71% of suspects, and Hispanics another 26%. That only leaves 3% of shootings for whites, Asians, and everyone else!
Remember this the next time someone complains about disparities in police stops.
Remember this the next time someone complains about disparities in police stops.
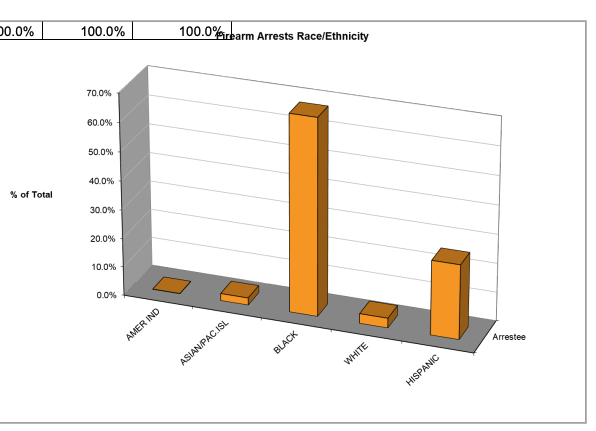
Looks like NYPD made a formatting error in this chart. Too bad, because I think they had fun making it.
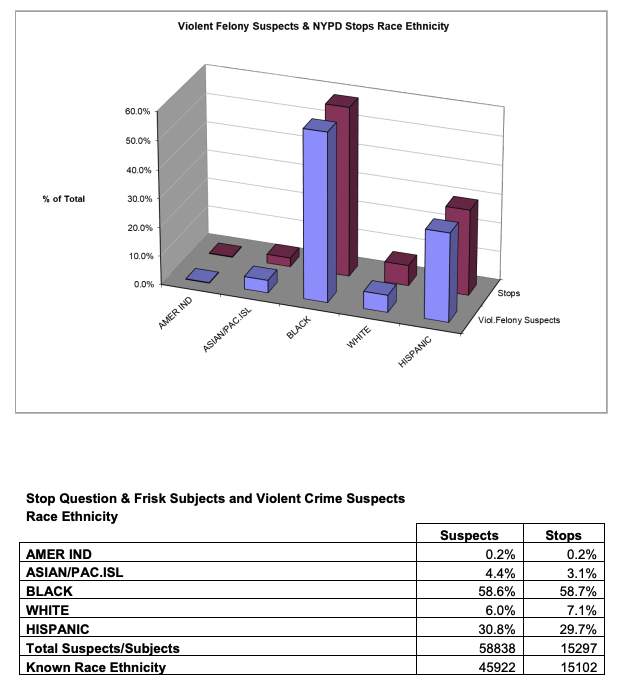
NYPD presents data showing that the numbers for stop and frisk look similar to numbers for violent felony suspects.
Blacks and Hispanics make up around both 90% of suspects and 90% of those stopped. In other words, no racism, it's all lies.
Blacks and Hispanics make up around both 90% of suspects and 90% of those stopped. In other words, no racism, it's all lies.
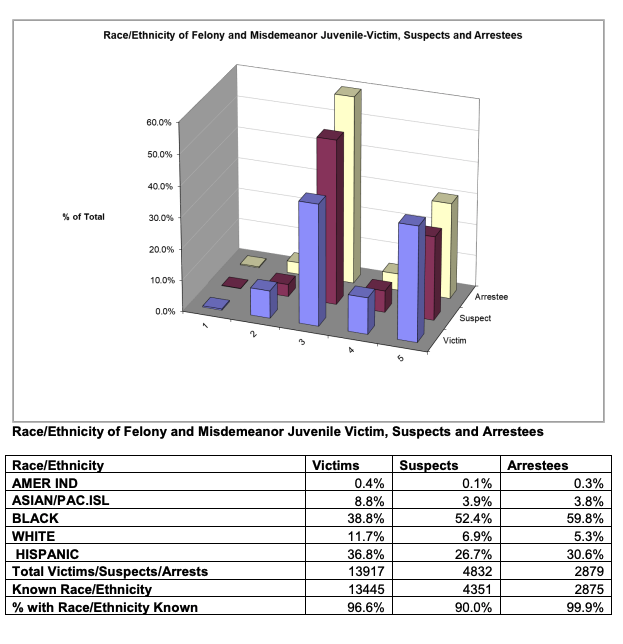
Finally, here are the numbers for juveniles. You will not be surprised by the results.
Interestingly, the higher Asian crime rate among adults is much more muted among juveniles. Why? I don't know. Maybe Asians are late bloomers in crime.
Interestingly, the higher Asian crime rate among adults is much more muted among juveniles. Why? I don't know. Maybe Asians are late bloomers in crime.
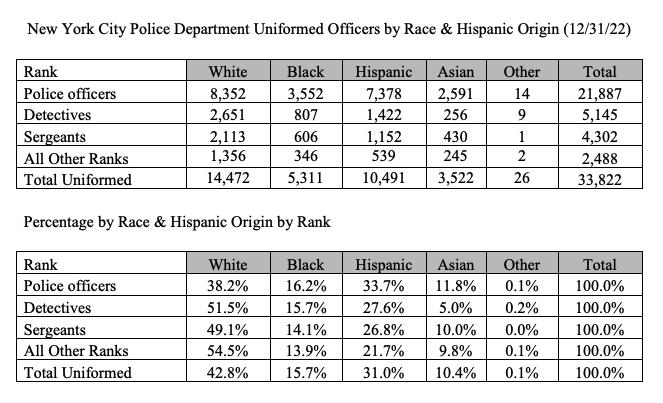
NYPD also provides data on their own officers. You have to work really hard on affirmative action to get numbers this close! Too bad government can't affirmative action the crime data.
In sum, it's sort of nuts NYPD does this. Cops are very right-wing, and this just shows how the ideology of government workers decides what data is collected. If sociologists were in charge I'm sure they would release the victim numbers but not suspects or arrestees.
Link to the entire report. nyc.gov
Loading suggestions...