

Mastering The Market Structure
A Thread 🧵
Table of contents:
1. Market Structure Overview
2. Three Types of Market Structure
3. Market Structure Shift
4. Swing Highs & Lows
5. How To Trade With #MarketStructure
• Reversal
• Continuation
• Range Trading
6. Conclusion
A Thread 🧵
Table of contents:
1. Market Structure Overview
2. Three Types of Market Structure
3. Market Structure Shift
4. Swing Highs & Lows
5. How To Trade With #MarketStructure
• Reversal
• Continuation
• Range Trading
6. Conclusion
1. Market Structure Overview:
Market structure is a technical analysis tool used to identify the direction and strength of a trend. Market structure is determined by analyzing the highs and lows of a chart and connecting the swing highs and lows with lines.
Market structure is a technical analysis tool used to identify the direction and strength of a trend. Market structure is determined by analyzing the highs and lows of a chart and connecting the swing highs and lows with lines.
By observing the market structure, traders can gain insight into the direction of the trend and make #trading decisions accordingly.
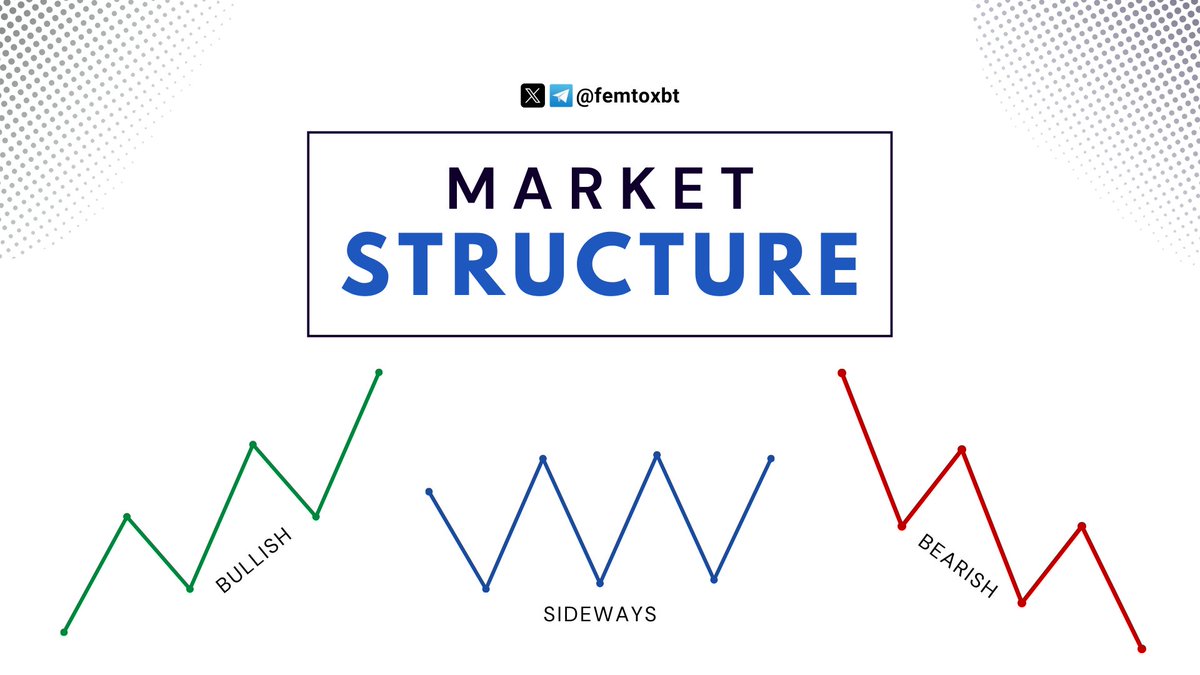
2. Three Types of Market Structure:
Market structure can take on three general forms:
• Bullish Market Structure
• Bearish Market Structure
• Sideways Market Structure
Market structure can take on three general forms:
• Bullish Market Structure
• Bearish Market Structure
• Sideways Market Structure
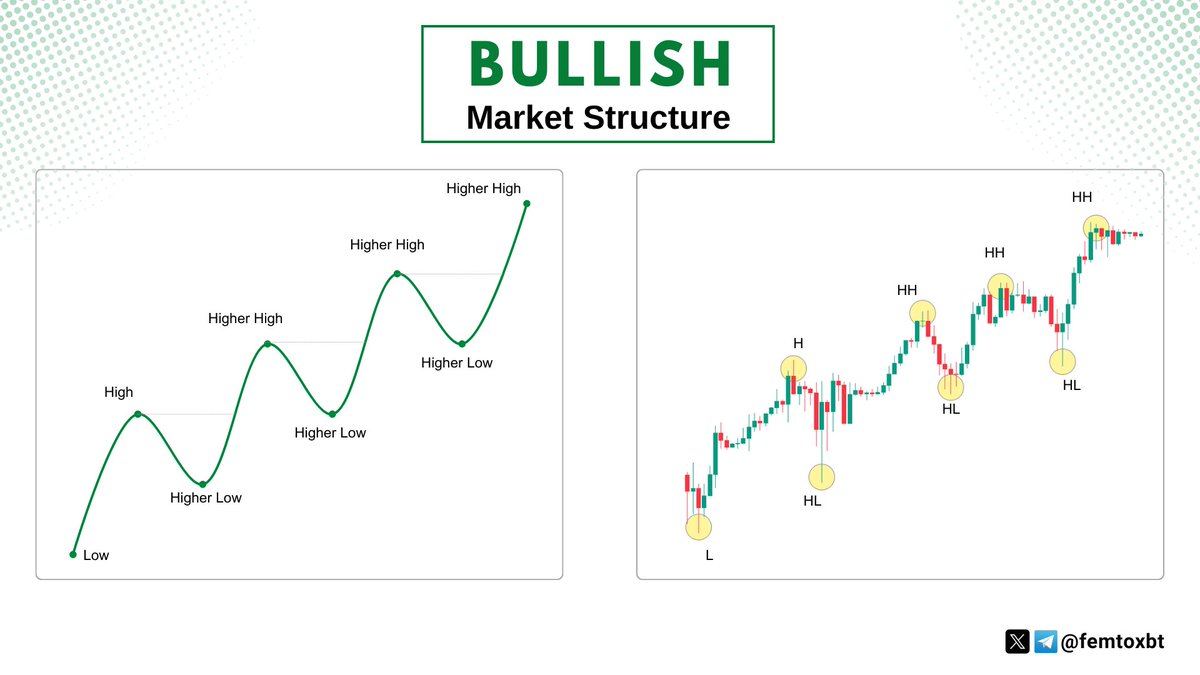
⦿ Bullish Market Structure (Uptrend): 🐂
A bullish structure is an upward trend in the market. It is characterized by higher highs and higher lows. This indicates that the overall trend is moving up and that buyers are dominating the market.
A bullish structure is an upward trend in the market. It is characterized by higher highs and higher lows. This indicates that the overall trend is moving up and that buyers are dominating the market.
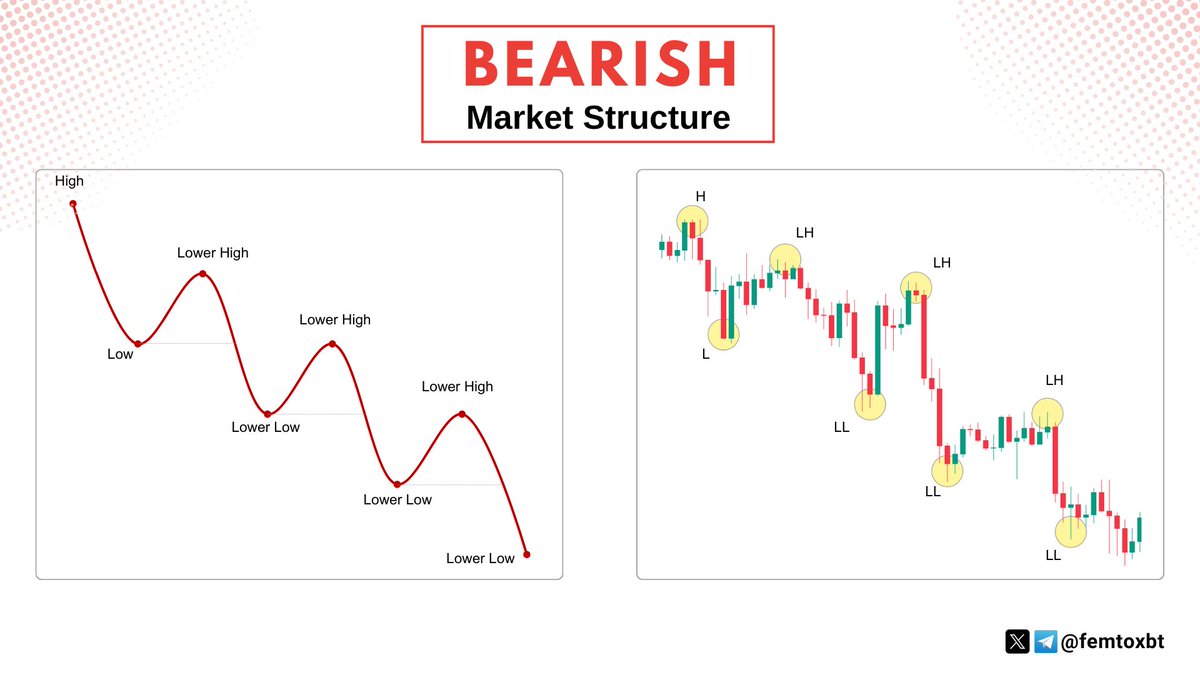
⦿ Bearish Market Structure (Downtrend): 🐻
A bearish structure is a downward trend in the market. It is characterized by lower highs and lower lows. This indicates that the overall trend is moving down and that sellers are dominating the market.
A bearish structure is a downward trend in the market. It is characterized by lower highs and lower lows. This indicates that the overall trend is moving down and that sellers are dominating the market.
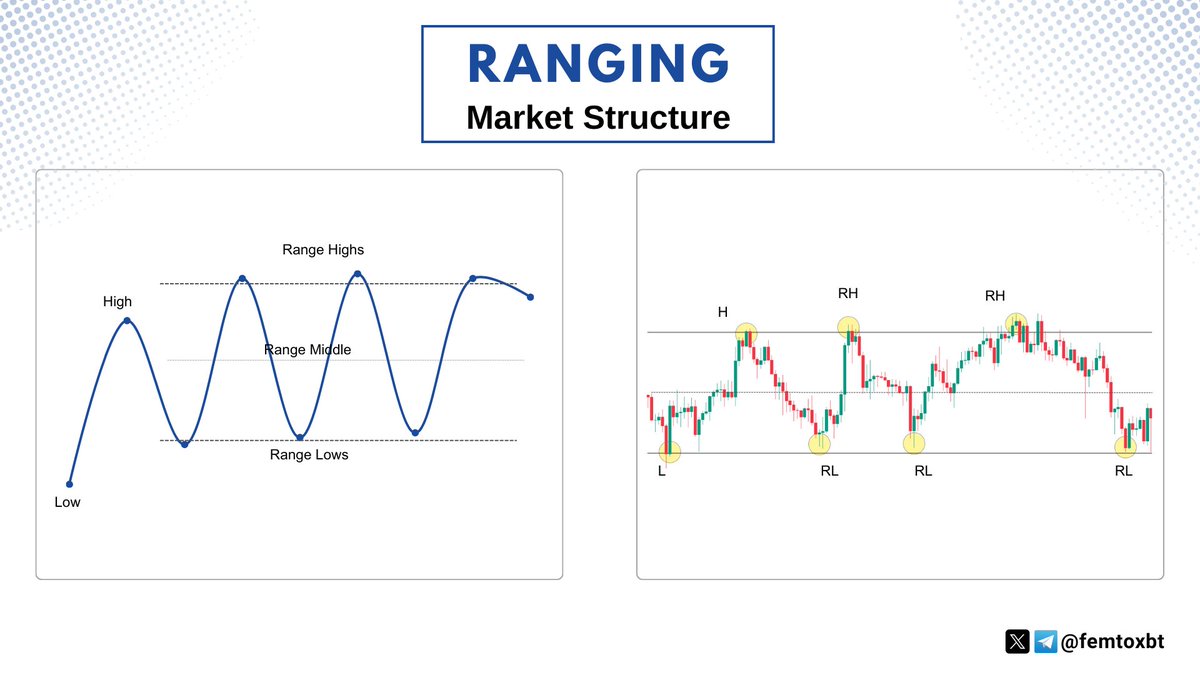
⦿ Sideways Market Structure (Ranging): 🐛
A sideways structure is a sideways or flat trend in the market. It is characterized by a lack of clear direction. This is usually seen when there is a balance between the supply and demand of a particular asset.
A sideways structure is a sideways or flat trend in the market. It is characterized by a lack of clear direction. This is usually seen when there is a balance between the supply and demand of a particular asset.
3. Market Structure Shift:
A market structure shift occurs when the market structure changes from one type to another. For example, a market may move from a bullish structure to a bearish structure or from a bearish structure to a bullish structure.
A market structure shift occurs when the market structure changes from one type to another. For example, a market may move from a bullish structure to a bearish structure or from a bearish structure to a bullish structure.
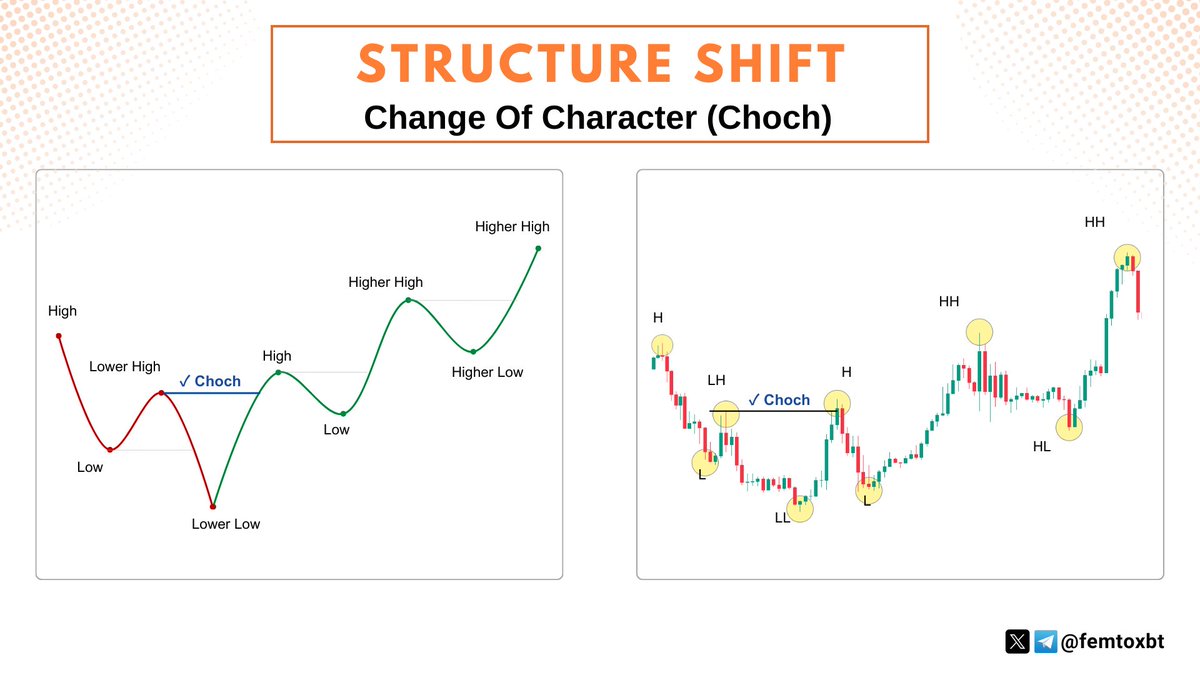
Structure shifts can indicate a change in the trend and should be used as a sign to trade in the direction of the new trend.
4. Swing Highs and Swing Lows:
Swing highs and swing lows are key components of market structure. Swing highs are the highest points in a chart and swing lows are the lowest points.
Swing highs and swing lows are key components of market structure. Swing highs are the highest points in a chart and swing lows are the lowest points.

By connecting the swing highs & lows with lines, traders can identify the overall trend and get a better sense of the direction the market is headed. It is used to identify areas of support and resistance, and are key levels for traders to watch for potential entries and exits.
5. How To Trade With Market Structure:
⦿ Reversal of the trend: 🔄
A Reversal market structure is when the market is moving from one structure to another, such as from a bullish to a bearish structure.
⦿ Reversal of the trend: 🔄
A Reversal market structure is when the market is moving from one structure to another, such as from a bullish to a bearish structure.
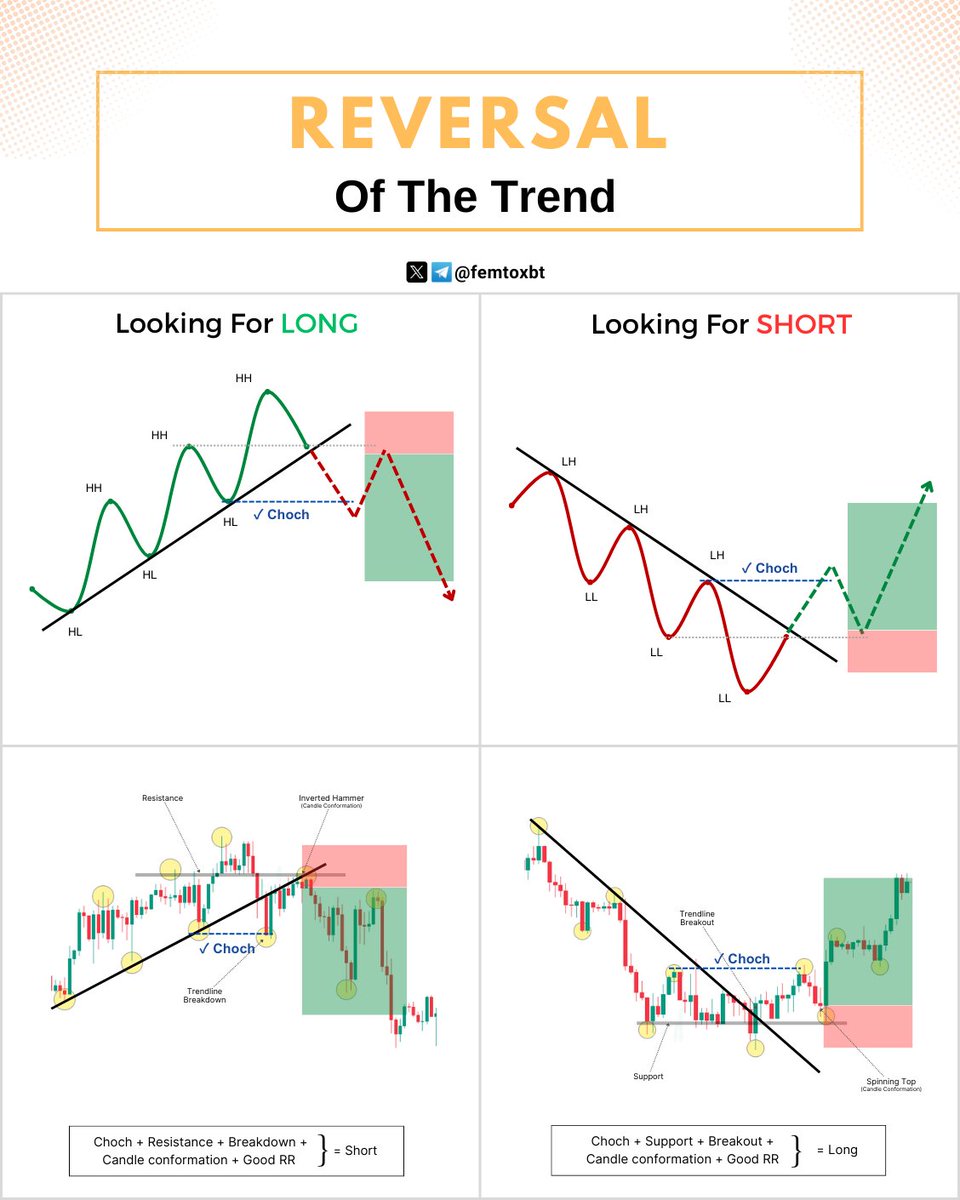
Look for signs of trend exhaustion, such as divergences or breakouts of key levels, to enter trades against the prevailing trend with CHOCH conformation.
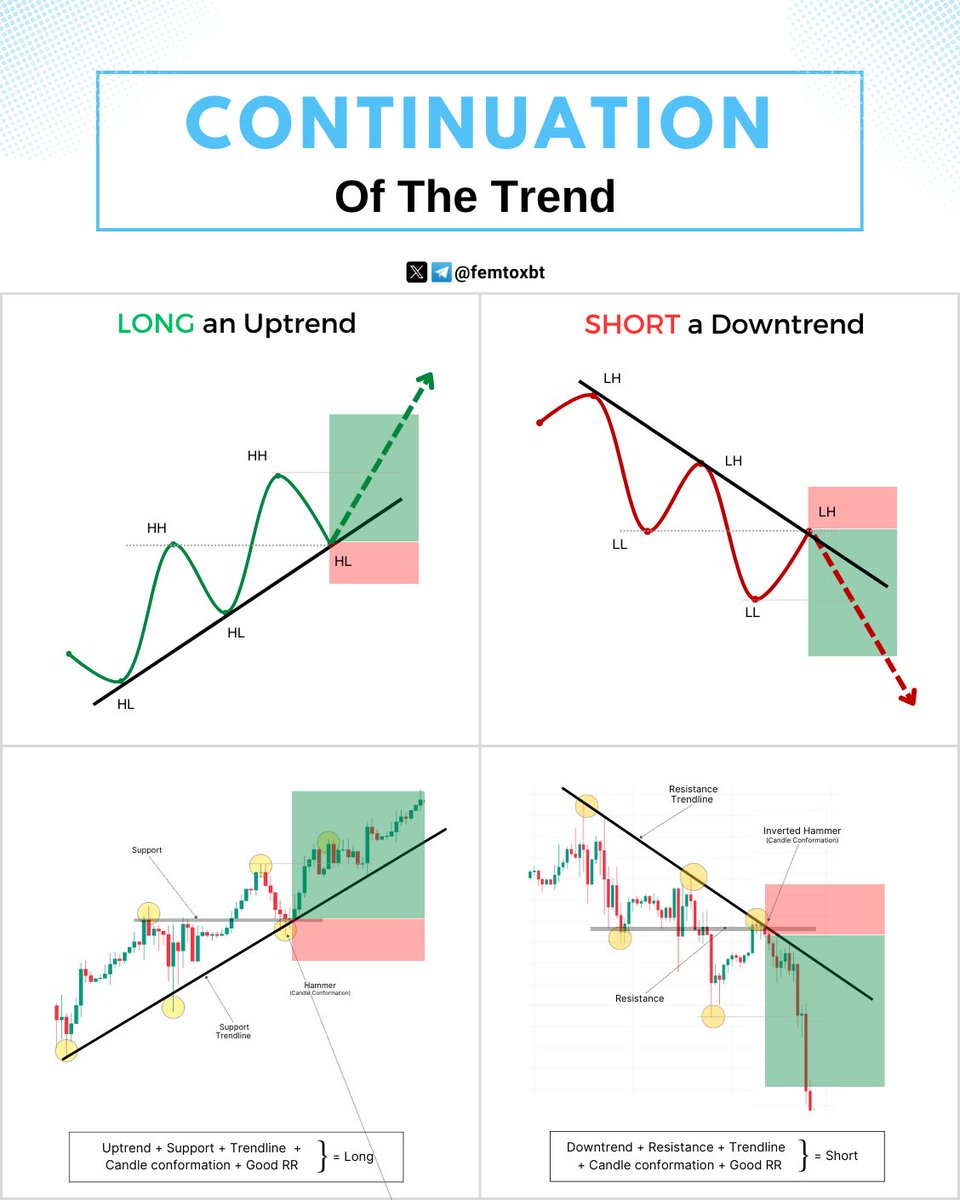
⦿ Continuation of the trend: ⤴️
A continuation is when the market is continuing in the same direction, such as a bullish or bearish structure. Identify pullbacks or retracements within the trend and use them as opportunities to enter trades in the direction of the same trend.
A continuation is when the market is continuing in the same direction, such as a bullish or bearish structure. Identify pullbacks or retracements within the trend and use them as opportunities to enter trades in the direction of the same trend.
⦿ Range trading: ↔️
If the market is in a sideways structure, traders can look for potential range trading opportunities.
• Range High -> Looking for Short entries
• Range Low -> Looking for Long entries
• Range Middle -> No trades are preferred
If the market is in a sideways structure, traders can look for potential range trading opportunities.
• Range High -> Looking for Short entries
• Range Low -> Looking for Long entries
• Range Middle -> No trades are preferred

So, traders can look for opportunities to buy at Range Low and sell at Range High until a breakout occurs. We can also trade the breakout of the channel once it has been confirmed.
6. Conclusion
The market structure is your trading compass. By mastering it, traders can gain an edge in the market and increase their chances of success.
Thanks for joining this thread! Stay tuned for more trading insights. 💙
The market structure is your trading compass. By mastering it, traders can gain an edge in the market and increase their chances of success.
Thanks for joining this thread! Stay tuned for more trading insights. 💙
Loading suggestions...