

Retracement probabilities - Understanding #DRIDR winrate correctly and why 50% is not the same as 50%!
Mechanical trading based on data, and then “only” 30-35% winrate. Let's get to the bottom of the matter.
@Matthewwmickey1 @IamMas7er @M7_DR_ACADEMY @ICT_Concepts
Mechanical trading based on data, and then “only” 30-35% winrate. Let's get to the bottom of the matter.
@Matthewwmickey1 @IamMas7er @M7_DR_ACADEMY @ICT_Concepts

If you have already started your journey in the DR academy or have read up on DR, then you will have probably heard that it is possible to be profitable very mechanically and relatively easily. There is often talk of a win rate of around 30%.
First of all: Yes, it is profitable, and there is a good reason for the "low" winrate.
To understand this, we should first sort out a few things. Roughly summarized, the basic idea is that the DR range is formed, there is then a confirmation, followed by a retracement.
To understand this, we should first sort out a few things. Roughly summarized, the basic idea is that the DR range is formed, there is then a confirmation, followed by a retracement.
at the maximum of this retracement we want to enter a trade in order to take the following extension as a profit.
One way to catch this maximum is in the DR Lens data. When we talk about purely mechanical and data-based trading, we completely ignore all "advanced" confluences...
One way to catch this maximum is in the DR Lens data. When we talk about purely mechanical and data-based trading, we completely ignore all "advanced" confluences...
...and approaches for the moment. We “trade” purely based on the data.
This means that we use the data in terms of price and time. Let's start with the time data. DR Lens contains all data that has occurred for the set scenario (asset, day,...) in the last few years.
This means that we use the data in terms of price and time. Let's start with the time data. DR Lens contains all data that has occurred for the set scenario (asset, day,...) in the last few years.
Consequently, you can also see when the max retracements occurred, i.e. at what time.
The further time progresses in a session, the more max retracements have already happened by then (in recent years).
The further time progresses in a session, the more max retracements have already happened by then (in recent years).
At any given time, 50% of all max retracements have been before and the other 50% have been after.
Example:
Completely unrealistic, but let's assume for the moment that in our scenario the max retracements would have been completely balanced over the last 20 years.
Example:
Completely unrealistic, but let's assume for the moment that in our scenario the max retracements would have been completely balanced over the last 20 years.
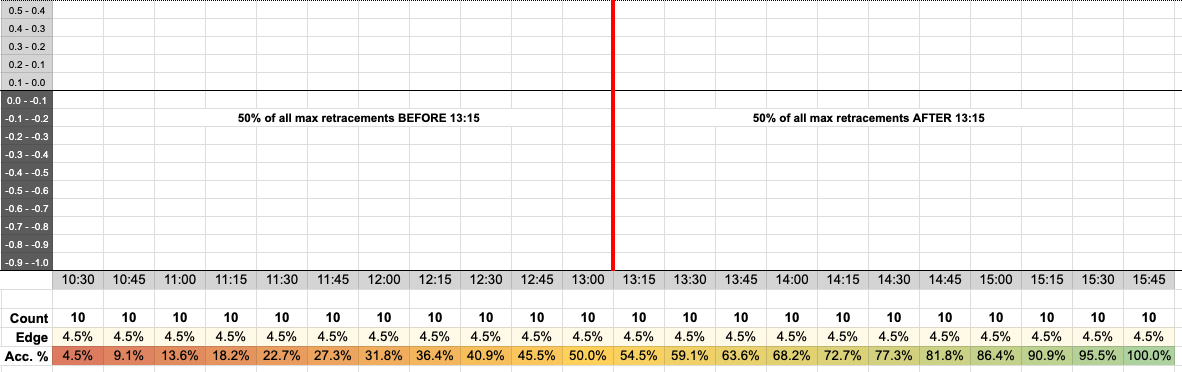
Since DR Lens divides the data into 15 minute steps, we'll do that here. In the picture you can see the times of the RDR session, starting at 10:30 a.m. and ending at 4:00 p.m. (last column 3:45 p.m. ending at 4:00 p.m.).
In recent years, exactly 10 max retracements have occurred every quarter of an hour within the session.
Imagine it's now exactly 1:15 p.m. Then we could say with absolute certainty that exactly half of all max retracements at this time have already been formed, right?
Imagine it's now exactly 1:15 p.m. Then we could say with absolute certainty that exactly half of all max retracements at this time have already been formed, right?
This time (also for other distributions) at which 50% of the retracements have already been formed is called the median time. Purely in terms of time, this means that at exactly 1:15 p.m. we have a 50% probability that the max retracement has already been formed.
If we place a trade now, this means that we have a 50% probability that the price will move in the direction we want (in this example we are assuming a long setup).
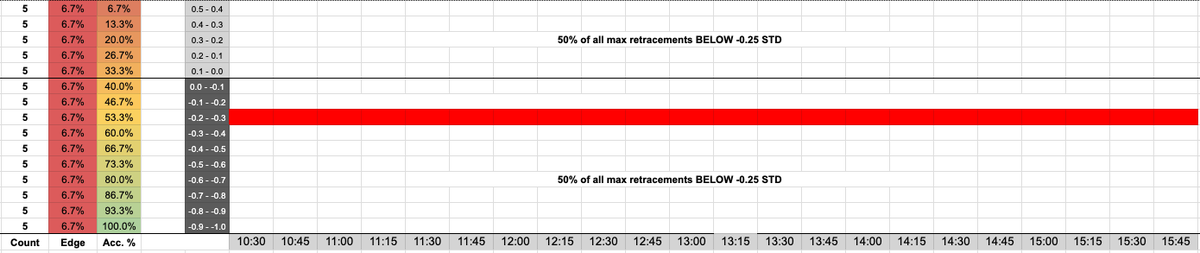
By the way, exactly the same applies to the retracement price level (ignoring time for now).
By the way, exactly the same applies to the retracement price level (ignoring time for now).
We assume that the price has retraced 5 times to each STD level. This means that there is of course a median here that is exactly -0.25 STD.
If you now expand time-based trading to include price data, you could assume the following.
If you now expand time-based trading to include price data, you could assume the following.
If the price comes back to the median retracement level, exactly at the median time, then I have a 50% probability that the trade will be profitable, right?
The answer is no.
The probability based on time is 50%, correct. The probability related to the price also. 50% of all...
The answer is no.
The probability based on time is 50%, correct. The probability related to the price also. 50% of all...
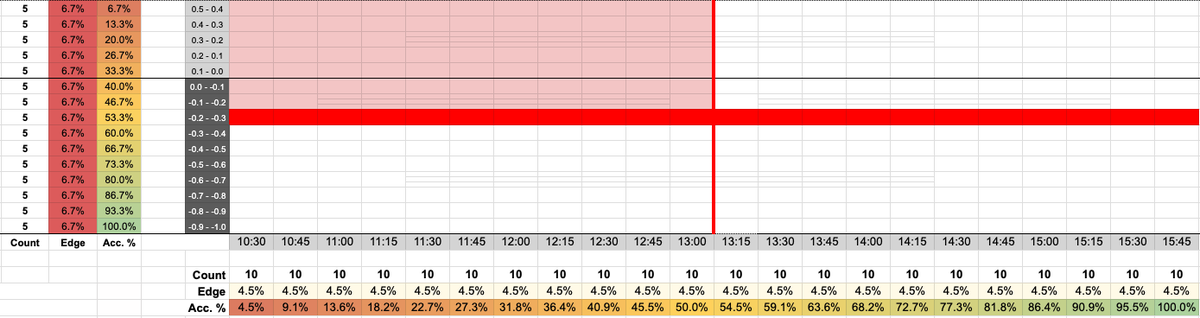
...max retracements have already been formed, and 50% of all max retracement price levels have already been reached. However, if you consider 2 events that are not dependent on each other, but are both supposed to occur, then the probabilities must be multiplied.
50% * 50% = 25%
50% * 50% = 25%
In other words: 50% OF 50%
Or in relative probabilities: 0.5 * 0.5 = 0.25
Visually shown, at this point in time and at this price level, we have "first" processed the quarter marked in red at the top left.
So, 50% of both is NOT 50% in total.
Or in relative probabilities: 0.5 * 0.5 = 0.25
Visually shown, at this point in time and at this price level, we have "first" processed the quarter marked in red at the top left.
So, 50% of both is NOT 50% in total.
In reality, the distribution of time and price data is of course not so linear.
Let's look at a random example. Now we add up the probabilities for time and price, as we did above, multiply the values and create a heatmap to illustrate the whole thing.
Let's look at a random example. Now we add up the probabilities for time and price, as we did above, multiply the values and create a heatmap to illustrate the whole thing.
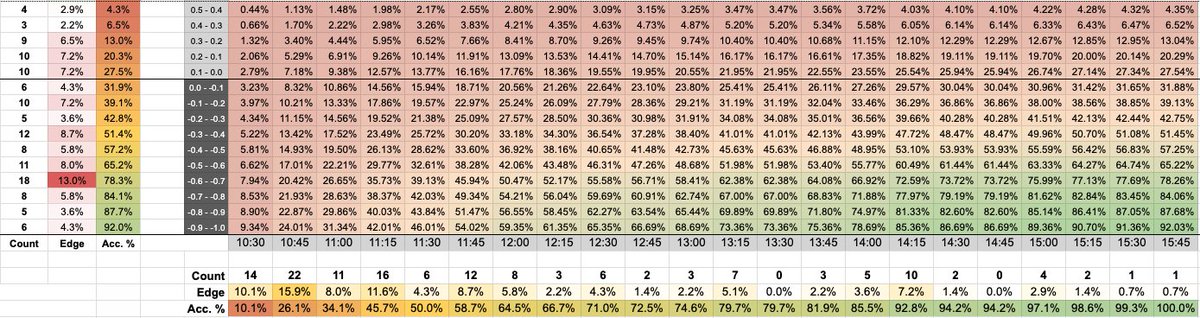
A good and "simple" way to trade DR initially (if you only use the Lens data) is to speculate on a retracement to a high probability price level in a high probability time cluster (usually at the beginning of the session, after the confirmation of course).
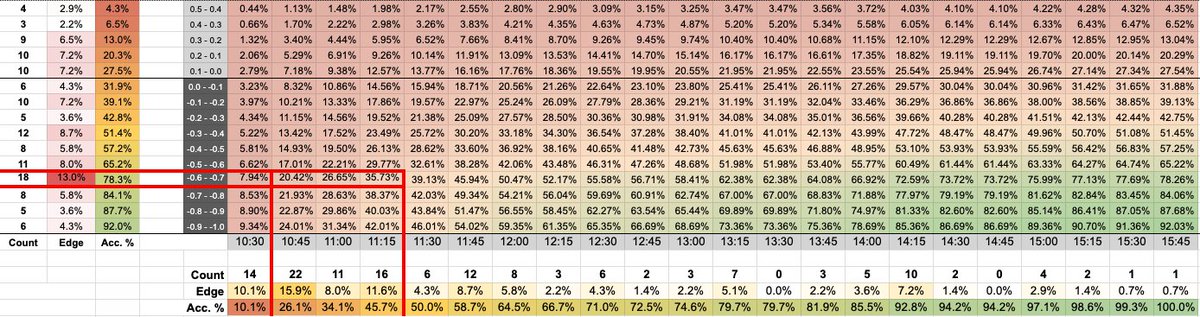
And now look at the probabilities we end up with here. Exactly, between 20 and 35%.
Sometimes you enter the trade a little later, or the price is retraced a little further. On average you will end up with some probability around 30%.
Sometimes you enter the trade a little later, or the price is retraced a little further. On average you will end up with some probability around 30%.
If you now trade (I emphasize this again) exclusively mechanically according to time and price, based on the data, then the "low" win rate can be explained. The probability of course increases with a larger retracement and a later point in time.
And yes, the most likely that the max retraction has already occurred is of course when we are lounging around at -0.9 - -1.0 STD at the end of the session, but I'm sure you agree that there is no point in taking a trade there.
What am I NOT trying to say here? There is no point in entering a trade as late as possible or as deeply as possible in the retracement. Orientation towards modes or high probability clusters still makes the most sense. I just wanted to provide an explanation for the...
...winrate, which seems to confuse some.
Since trades should always aim for AT LEAST an RR of 1:3, this purely data-based approach is still profitable. You see, even with the simplest means you can make a profit with DR. If you now integrate all the other mechanics and...
Since trades should always aim for AT LEAST an RR of 1:3, this purely data-based approach is still profitable. You see, even with the simplest means you can make a profit with DR. If you now integrate all the other mechanics and...
...confluences taught by @IamMas7er, then that doesn't change the probabilities (data is data), but it does change the profits you make with your winners. It's not always about avoiding losses, but rather about finding winners and making your trading more efficient.
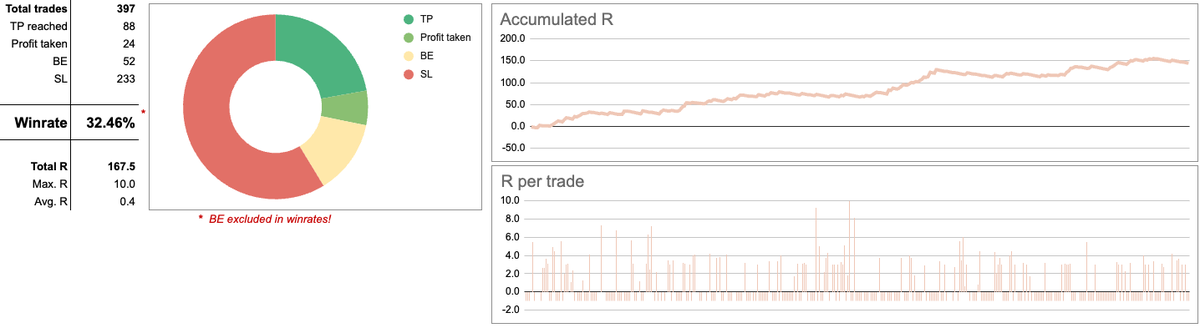
But yes, of course some losses can be avoided. Take the simple and mechanical basics as a basis, test it and see for yourself how profitable it is. In the picture you can see my backtesting results with purely time-based trading with 5 assets over 3 months.
And if you are familiar with these basics and know how to correctly assess the data and probabilities and use them to your advantage, then build on them and let yourself be taken to the next level.
Probabilites are great, but they are just numbers, they are not your limit!
Probabilites are great, but they are just numbers, they are not your limit!
Loading suggestions...