

Meet Mazagon Dock Shipbuilders.
It’s among the top gainers in the BSE 500.
A year ago, its PE ratio hinted it was a "steal deal." (See image)
Now, it boasts of a REMARKABLE 226% one-year return.
Let’s explore 5 strategies to pick such multi-bagger value stocks.
A 🧵
It’s among the top gainers in the BSE 500.
A year ago, its PE ratio hinted it was a "steal deal." (See image)
Now, it boasts of a REMARKABLE 226% one-year return.
Let’s explore 5 strategies to pick such multi-bagger value stocks.
A 🧵

We have shared 5 approaches to picking value stocks here:
Discount to the historical PE ratio
Discount to the historical PB ratio
Low PEG ratio
Market laggards approach
Piotroski F-Score
These include some examples as well.
Don’t consider them as stock recommendations.
Discount to the historical PE ratio
Discount to the historical PB ratio
Low PEG ratio
Market laggards approach
Piotroski F-Score
These include some examples as well.
Don’t consider them as stock recommendations.
First, let’s define our stock universe.
It’s not enough to spot a stock that is trading at a discount.
The stock should also be fundamentally sound.
After all, cheaper is not always valuable.
To ensure this, we applied 4 critical filters.
It’s not enough to spot a stock that is trading at a discount.
The stock should also be fundamentally sound.
After all, cheaper is not always valuable.
To ensure this, we applied 4 critical filters.
1. Market cap >= Rs 1,000 crore
2. Debt-to-equity ratio <= 1
3. 5-year average return on equity (ROE) >= 15%
4. 5-year growth of earnings per share (EPS) >= 12%
Out of all the listed stocks on BSE, 259 passed these criteria.
So, we have applied our value approaches to them.
2. Debt-to-equity ratio <= 1
3. 5-year average return on equity (ROE) >= 15%
4. 5-year growth of earnings per share (EPS) >= 12%
Out of all the listed stocks on BSE, 259 passed these criteria.
So, we have applied our value approaches to them.
1. DISCOUNT TO HISTORICAL P/E
If a stock is at a discount to its historical P/E, it signals value.
So, we filtered stocks that are at a discount of at least 25% from their 5-year median P/E.
Should you straight away go for these stocks? Not really.
If a stock is at a discount to its historical P/E, it signals value.
So, we filtered stocks that are at a discount of at least 25% from their 5-year median P/E.
Should you straight away go for these stocks? Not really.
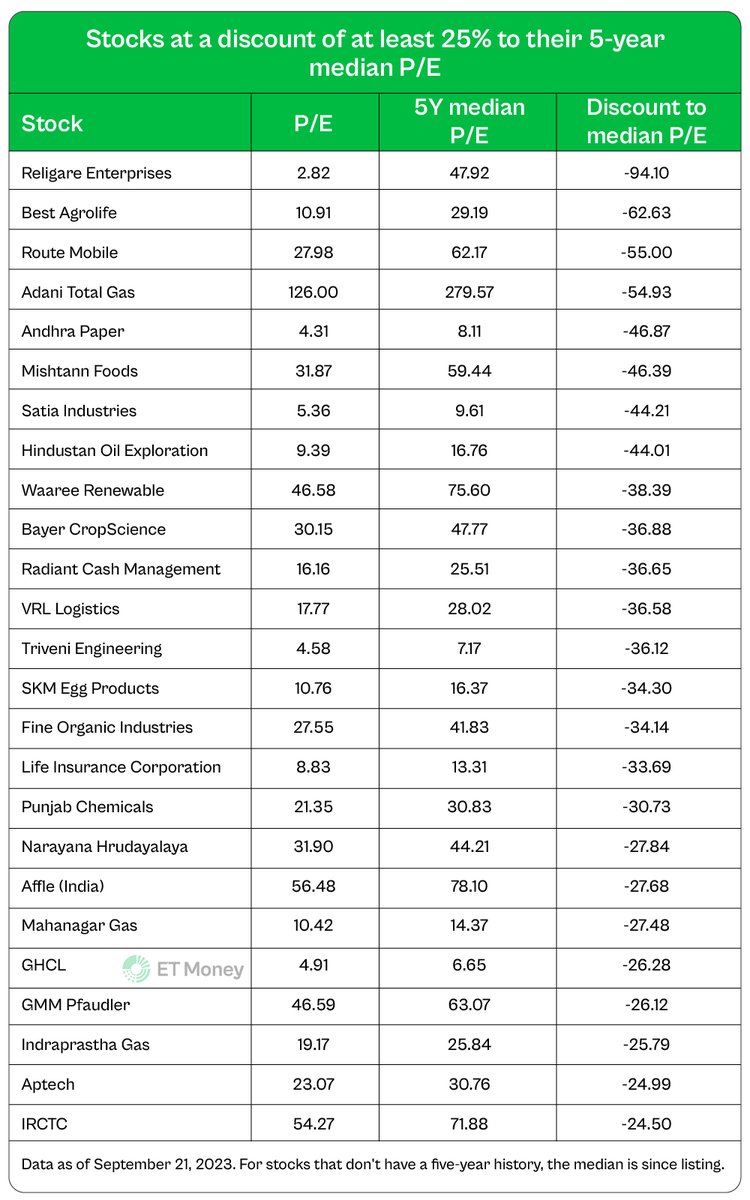
There are a few things you need to keep in mind.
A. This may not work in the case of some sectors like banking.
B. It’s not the best parameter for cyclical businesses
So, consider these factors before you jump to invest in the stocks.
A. This may not work in the case of some sectors like banking.
B. It’s not the best parameter for cyclical businesses
So, consider these factors before you jump to invest in the stocks.
2. Discount to historical PB
Like the PE ratio, the PB ratio is also a popular valuation measure.
A high discount from the median P/B can indicate a value buy.
So, we checked stocks currently trading at a discount of at least 25% from their 5-yr median PB.
See the list below.
Like the PE ratio, the PB ratio is also a popular valuation measure.
A high discount from the median P/B can indicate a value buy.
So, we checked stocks currently trading at a discount of at least 25% from their 5-yr median PB.
See the list below.
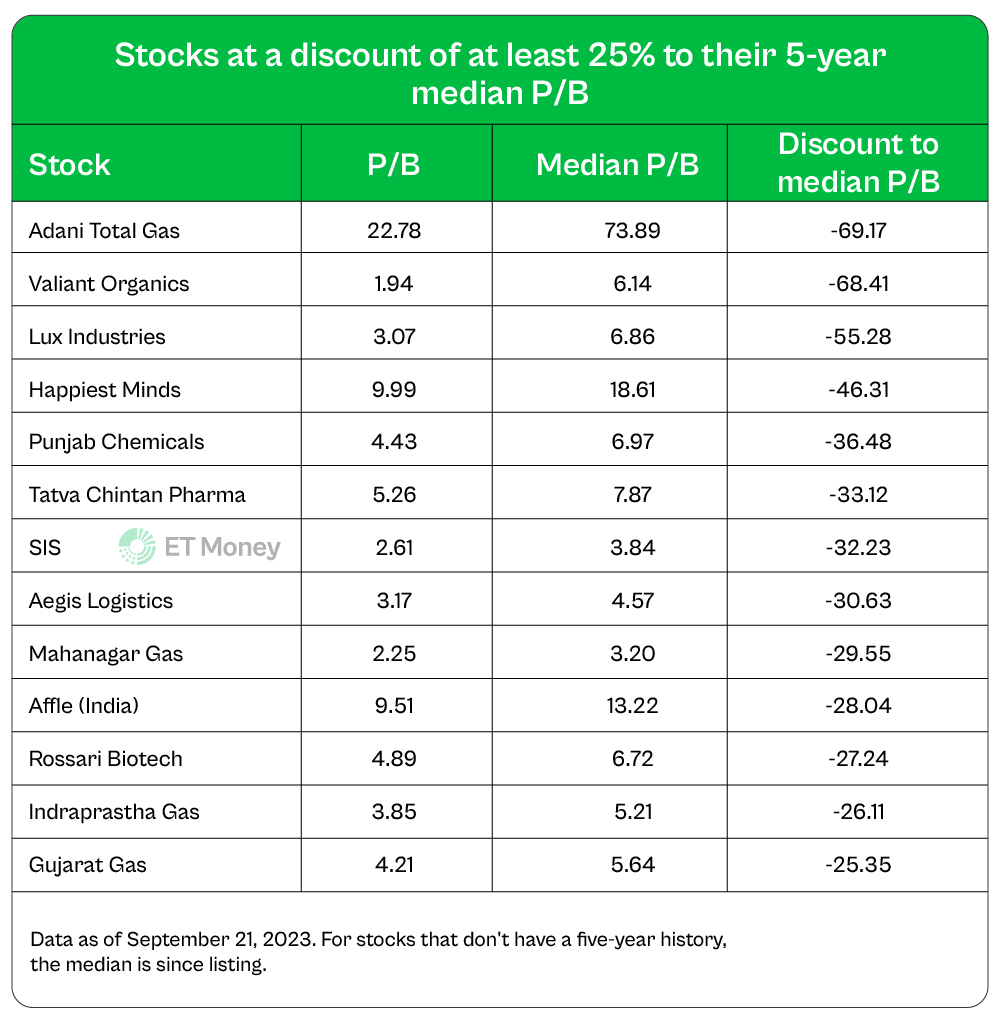
What do you need to keep in mind?
The P/B ratio is apt to analyze companies that have significant assets on their books.
It may not work for companies with high intangible assets like patents, intellectual property, goodwill, etc., on their balance sheet.
The P/B ratio is apt to analyze companies that have significant assets on their books.
It may not work for companies with high intangible assets like patents, intellectual property, goodwill, etc., on their balance sheet.
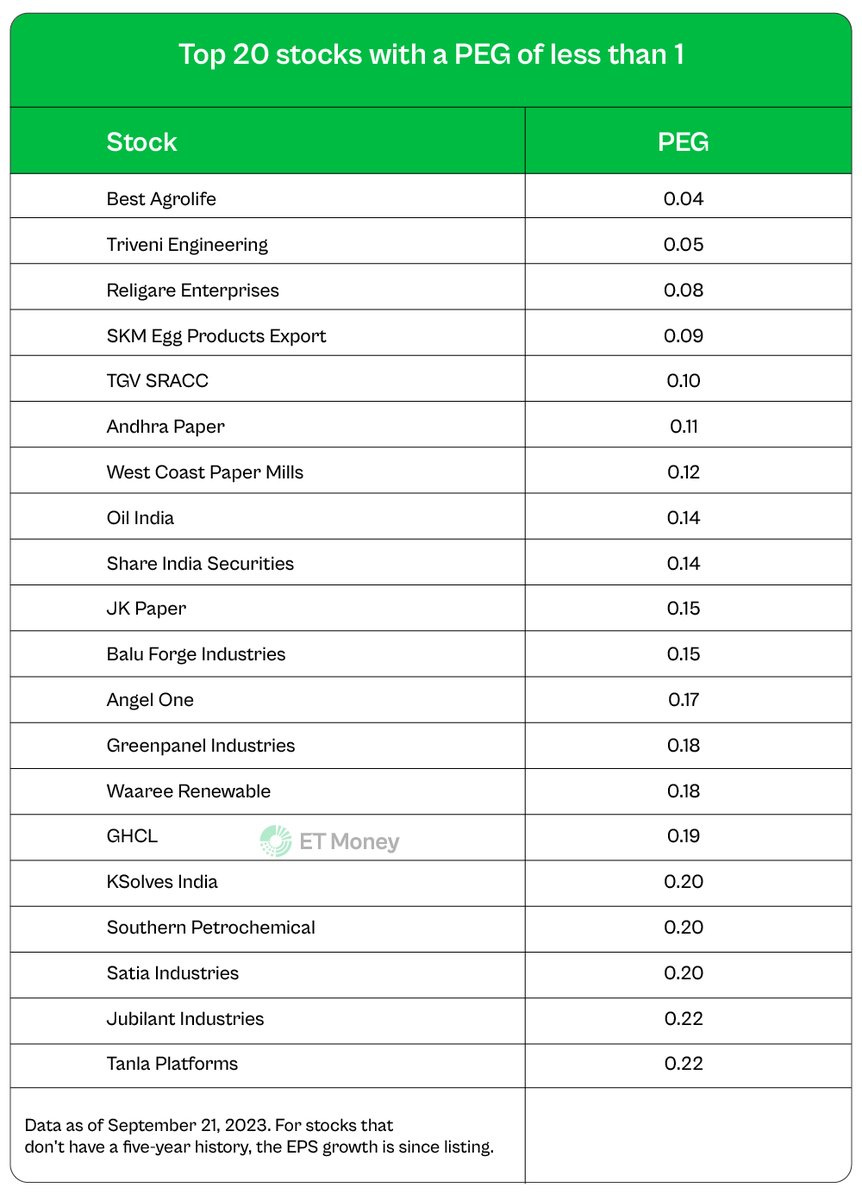
3. Low PEG ratio
Legendary investor Peter Lynch popularised the P/E to growth ratio (PEG).
PEG is found by dividing the P/E by a growth metric like earnings growth.
For example, if a company has a P/E of 25 & 5-year earnings growth of 25% per year, the PEG is 1.
Legendary investor Peter Lynch popularised the P/E to growth ratio (PEG).
PEG is found by dividing the P/E by a growth metric like earnings growth.
For example, if a company has a P/E of 25 & 5-year earnings growth of 25% per year, the PEG is 1.
A PEG ratio of less than 1 indicates a bargain.
It is especially useful in ascertaining value within growth stocks.
Why?
Growth stocks typically have high PE ratios.
So, if you go by the P/E alone, you may get the impression that the stock is expensive.
It is especially useful in ascertaining value within growth stocks.
Why?
Growth stocks typically have high PE ratios.
So, if you go by the P/E alone, you may get the impression that the stock is expensive.
However, if the high P/E is backed by high earnings growth, it may not be bad.
This is the underlying logic of the PEG ratio.
Of the 259 stocks we had shortlisted, 114 have a PEG of less than 1.
You can check the top 20 stocks in the table.
This is the underlying logic of the PEG ratio.
Of the 259 stocks we had shortlisted, 114 have a PEG of less than 1.
You can check the top 20 stocks in the table.
What to keep in mind?
Double-check that the growth numbers are realistic and reliable.
Ensure you're using the same timeframe for growth and the P/E ratio.
Keep in mind PEG doesn’t account for external factors like economic cycles and industry trends.
Double-check that the growth numbers are realistic and reliable.
Ensure you're using the same timeframe for growth and the P/E ratio.
Keep in mind PEG doesn’t account for external factors like economic cycles and industry trends.
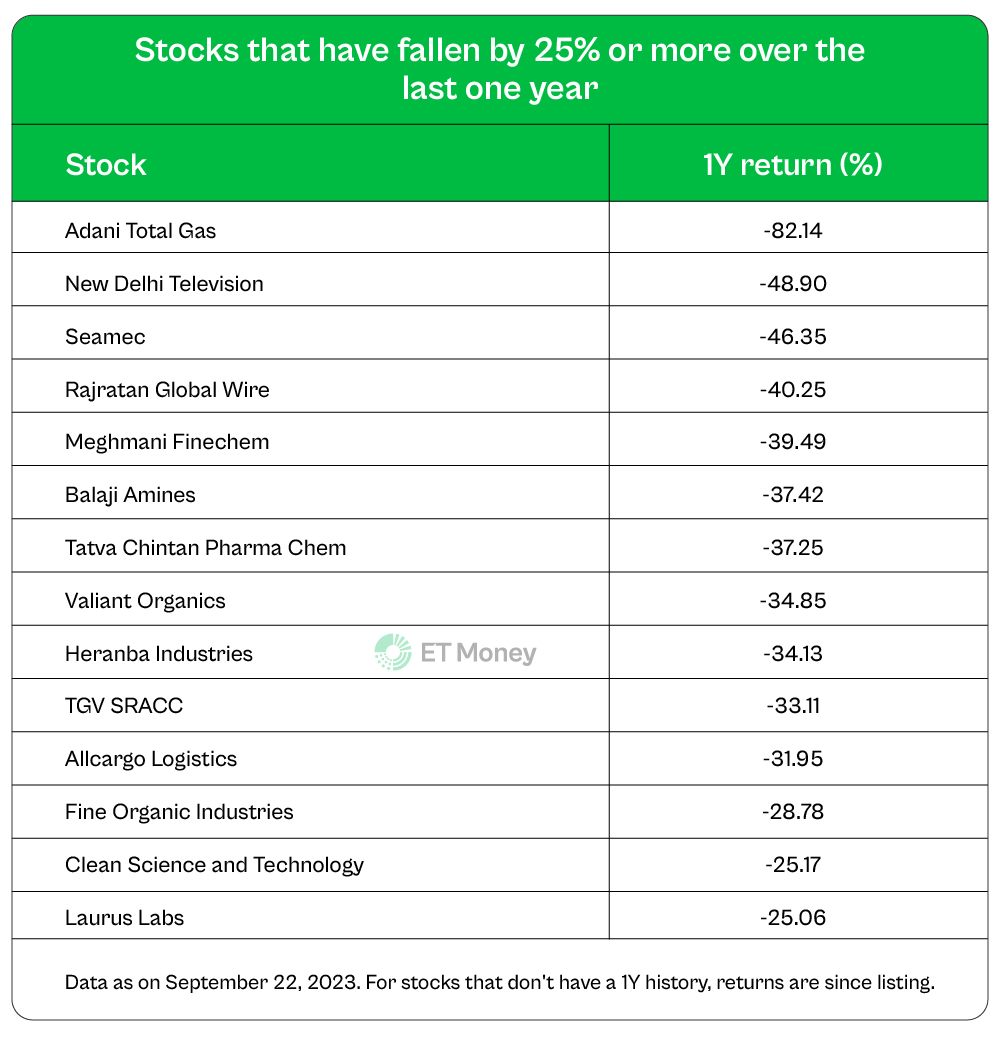
4. Market laggards
Laggards are stocks that underperformed the index.
For example, in the past year (until Sept 22, 2023), the SENSEX gave a 13% return.
Out of our 259-stock universe, 101 stocks underperformed.
Value investors may find potential gems among these.
Laggards are stocks that underperformed the index.
For example, in the past year (until Sept 22, 2023), the SENSEX gave a 13% return.
Out of our 259-stock universe, 101 stocks underperformed.
Value investors may find potential gems among these.
Naturally, there might be good reasons for their poor performance.
So, do consider those reasons.
But if a stock seems solid and still lags behind the index, it could be a promising value pick.
Check stocks that have declined by 25% or more in the past year.
So, do consider those reasons.
But if a stock seems solid and still lags behind the index, it could be a promising value pick.
Check stocks that have declined by 25% or more in the past year.
5. Piotroski F-Score
Created by Joseph Piotroski, a US accounting professor, the F-Score is a 9-point system to assess a company's recent financial performance.
It covers parameters like ROA, cash flow, leverage, gross margin, asset turnover, and so on.
Created by Joseph Piotroski, a US accounting professor, the F-Score is a 9-point system to assess a company's recent financial performance.
It covers parameters like ROA, cash flow, leverage, gross margin, asset turnover, and so on.
Because there are 9 metrics, the F-Score ranges from 0 to 9.
A score of 8 or 9 is considered strong.
We found that 56 stocks have an F-Score of 8 or 9.
The table below shows the top 20 companies by market cap with an F-Score of 8 or 9.
A score of 8 or 9 is considered strong.
We found that 56 stocks have an F-Score of 8 or 9.
The table below shows the top 20 companies by market cap with an F-Score of 8 or 9.

How to use these approaches?
You can mix these methods to create a hybrid one.
For example, combine discount to P/E and discount to P/B, then filter out stocks underperforming the Sensex.
Many online screeners can assist you in generating such lists.
You can mix these methods to create a hybrid one.
For example, combine discount to P/E and discount to P/B, then filter out stocks underperforming the Sensex.
Many online screeners can assist you in generating such lists.
Now, the list of stocks that you would get is just your starting point.
Next, do your research.
Go through each business to understand it.
Only then invest in them.
Next, do your research.
Go through each business to understand it.
Only then invest in them.
One very important thing: Be cautious of value traps.
There are stocks that may seem like good bargains but aren’t.
For example, companies going through a corporate governance crisis might appear undervalued, but they can decline further.
So, watch out for them.
There are stocks that may seem like good bargains but aren’t.
For example, companies going through a corporate governance crisis might appear undervalued, but they can decline further.
So, watch out for them.
We put a lot of effort into creating such informative threads.
So, if you find this useful, show some love. ❤️
Please like, share, and retweet the FIRST tweet.
x.com
So, if you find this useful, show some love. ❤️
Please like, share, and retweet the FIRST tweet.
x.com
Loading suggestions...