

1/6
The state of the stock market in five charts.
Friday's close, the S&P 500 (blue) correction is now 7.95% (red), the largest since the market bottom a year ago (October 12, 2022).
This correction is bigger than March, when everyone was hyperventilating about bank failures.
The state of the stock market in five charts.
Friday's close, the S&P 500 (blue) correction is now 7.95% (red), the largest since the market bottom a year ago (October 12, 2022).
This correction is bigger than March, when everyone was hyperventilating about bank failures.

2/6
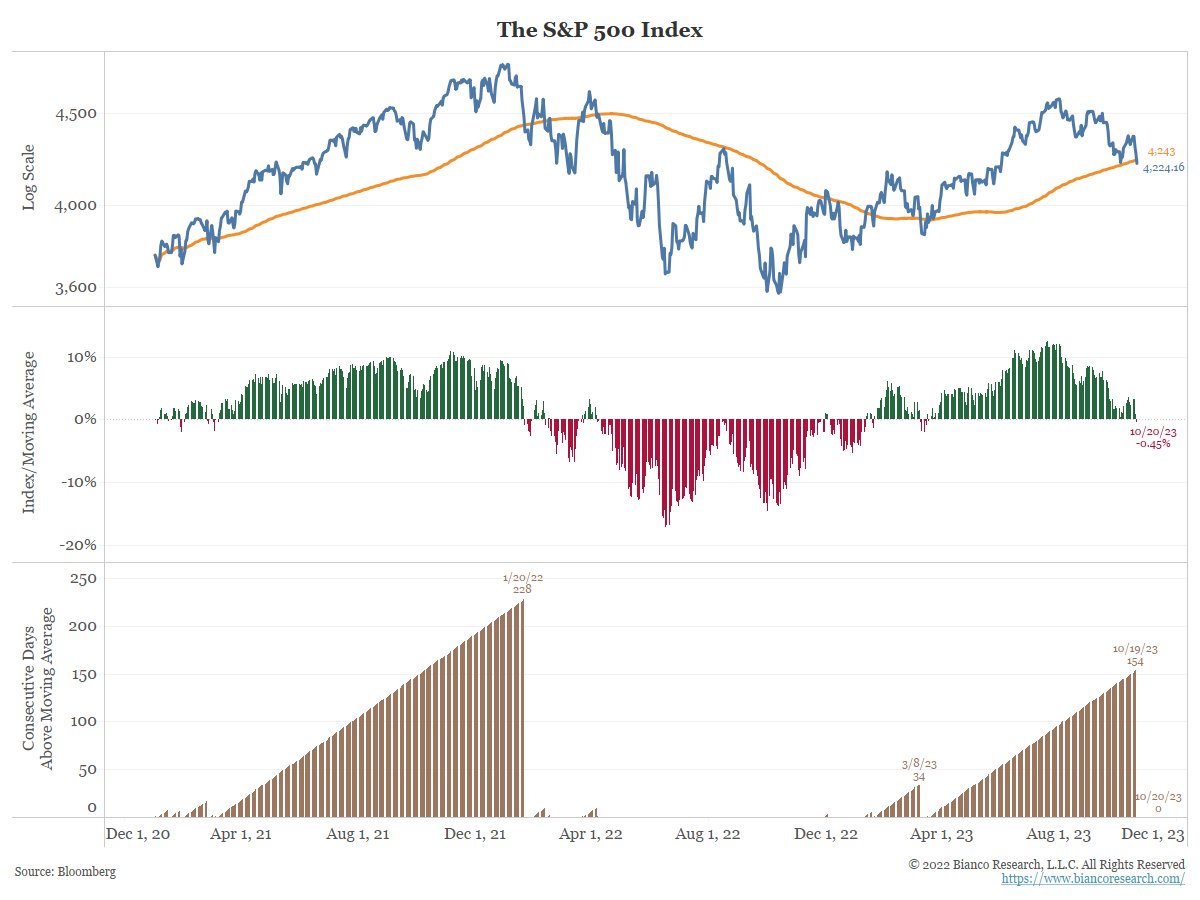
The S&P 500 (blue) closed below its 200-day moving (orange) average for the first time in 154 days.
Technicians look at this as the primary trend of the market.
Right now, this metric says the primary trend is down.
The S&P 500 (blue) closed below its 200-day moving (orange) average for the first time in 154 days.
Technicians look at this as the primary trend of the market.
Right now, this metric says the primary trend is down.
3/6
What kind of year is this?
Mid- (brown), small- (orange), and micro-cap (green) stocks are now down on the year.
Small-cap and micro-cap are at their lowest levels of 2023.
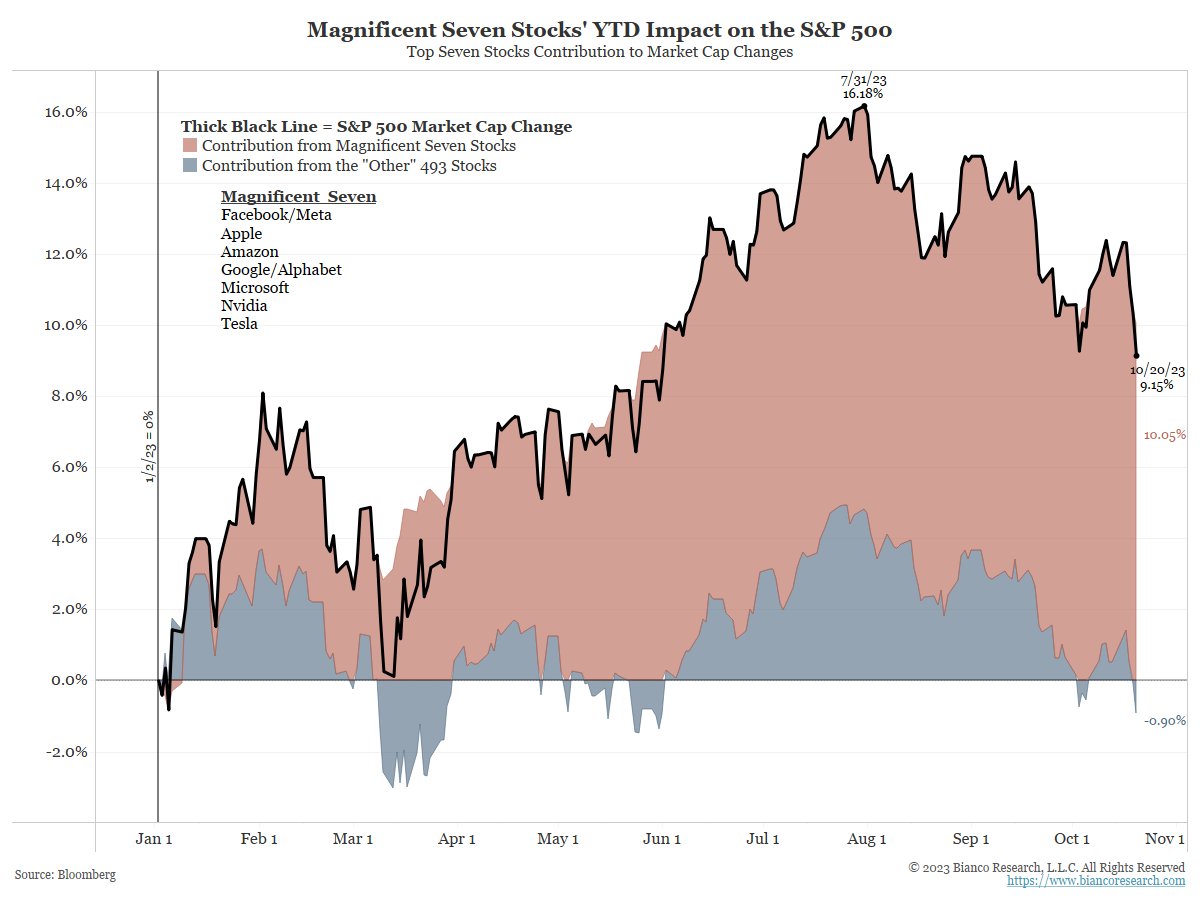
The S&P 500 (black) is up 10% for the year but ....
What kind of year is this?
Mid- (brown), small- (orange), and micro-cap (green) stocks are now down on the year.
Small-cap and micro-cap are at their lowest levels of 2023.
The S&P 500 (black) is up 10% for the year but ....

4/6
... take out the Magnificent Seven stocks (red); the "S&P 493" (blue) is down for the year and the lowest since the bank failures in March.
... take out the Magnificent Seven stocks (red); the "S&P 493" (blue) is down for the year and the lowest since the bank failures in March.
5/6
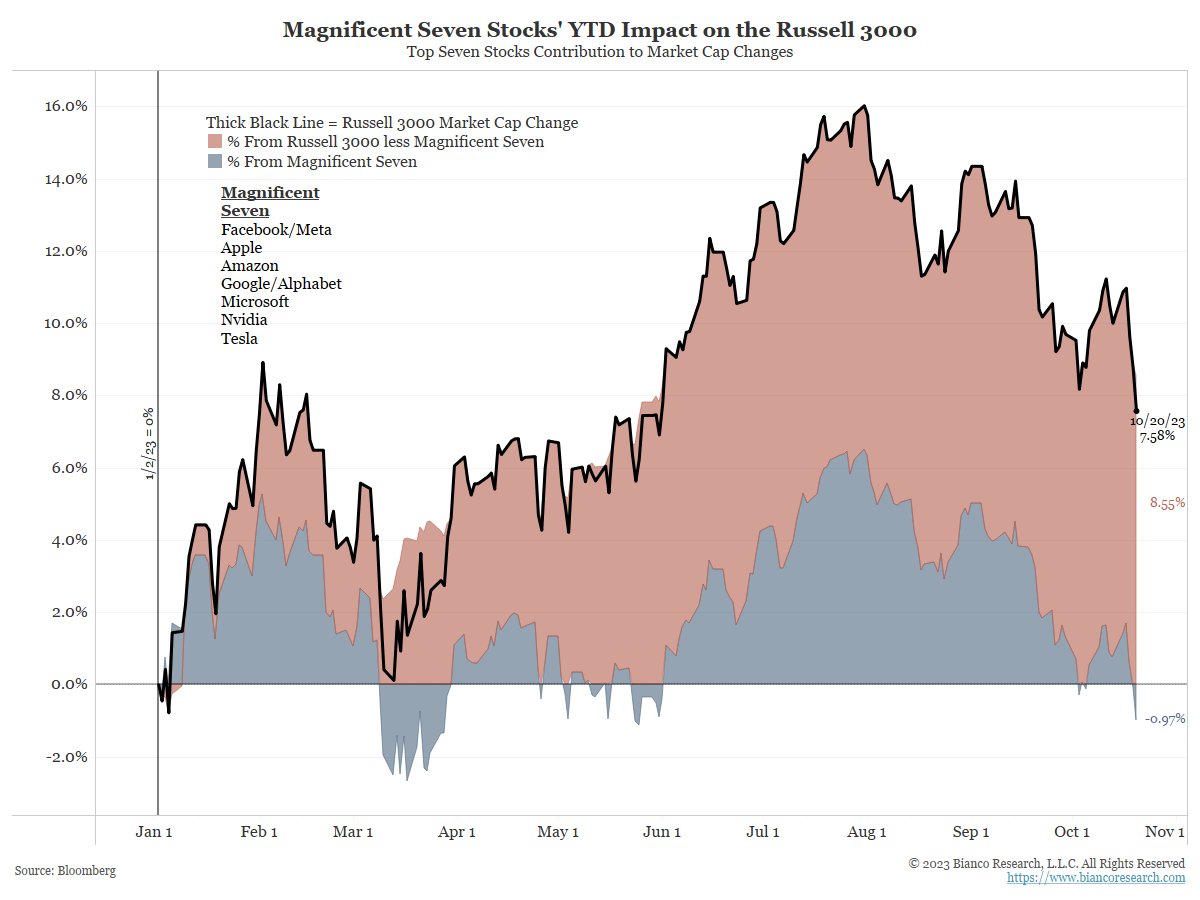
Add up large-, mid-, and small-cap stocks, and you get the Russell 3000 stock index.
Take out the Magnificent Seven (red); the "other 2993" stocks are down on the year (blue).
Add up large-, mid-, and small-cap stocks, and you get the Russell 3000 stock index.
Take out the Magnificent Seven (red); the "other 2993" stocks are down on the year (blue).
6/6
Last year was a 25% bear market. The belief is it ended on Oct 12, 2022.
A year later, the mkt cannot rally, save 7 stocks. It has yet to make a new high, the basic definition of a bull mkt.
This looks more like a big bear market correction than the 2nd year of a bull mkt.
Last year was a 25% bear market. The belief is it ended on Oct 12, 2022.
A year later, the mkt cannot rally, save 7 stocks. It has yet to make a new high, the basic definition of a bull mkt.
This looks more like a big bear market correction than the 2nd year of a bull mkt.
Russell 3000 chart above had "flipped" labels.
Corrected here
Corrected here
Loading suggestions...