

I went from losing money day trading to making $1,000’s a day.
What helped me become profitable is understanding 𝗺𝗮𝗿𝗸𝗲𝘁 𝘀𝘁𝗿𝘂𝗰𝘁𝘂𝗿𝗲 𝗽𝗿𝗶𝗰𝗲 𝗮𝗰𝘁𝗶𝗼𝗻 and 𝗹𝗶𝗾𝘂𝗶𝗱𝗶𝘁𝘆 to enter and exit trades
Here is how to find and read them 👇
$SPY $SPX
What helped me become profitable is understanding 𝗺𝗮𝗿𝗸𝗲𝘁 𝘀𝘁𝗿𝘂𝗰𝘁𝘂𝗿𝗲 𝗽𝗿𝗶𝗰𝗲 𝗮𝗰𝘁𝗶𝗼𝗻 and 𝗹𝗶𝗾𝘂𝗶𝗱𝗶𝘁𝘆 to enter and exit trades
Here is how to find and read them 👇
$SPY $SPX
1. 𝗠𝗔𝗥𝗞𝗘𝗧 𝗦𝗧𝗥𝗨𝗖𝗧𝗨𝗥𝗘𝗦
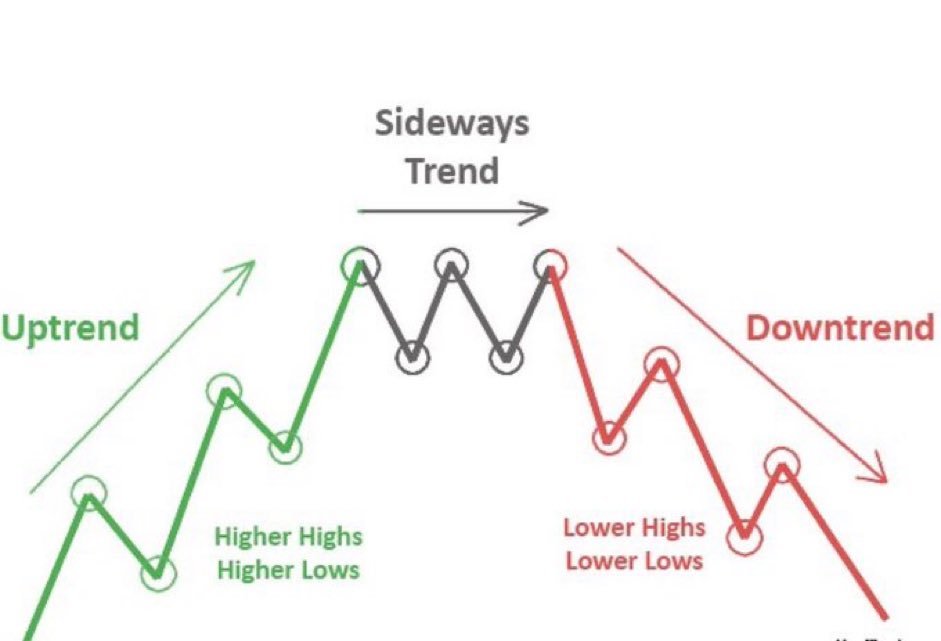
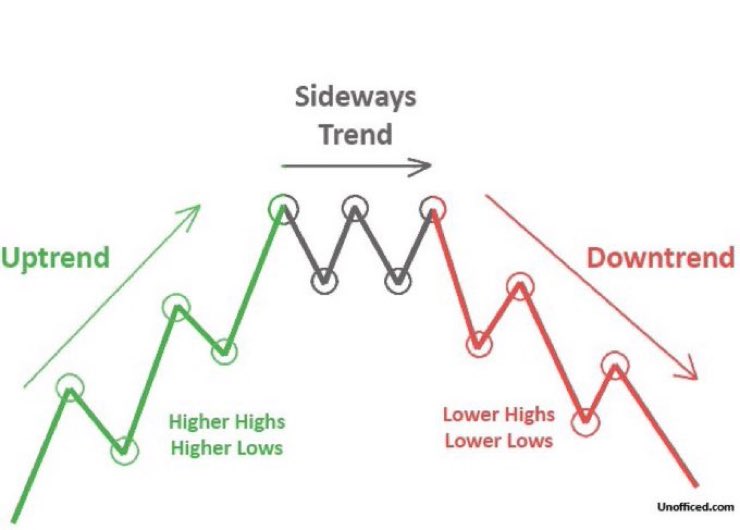
First we need to understand and identify the three market structures
1. Up trend
2. Down trend
3. Consolidation/Range/Sideways
First we need to understand and identify the three market structures
1. Up trend
2. Down trend
3. Consolidation/Range/Sideways
2. 𝗜𝗗𝗘𝗡𝗧𝗜𝗙𝗬𝗜𝗡𝗚 𝗧𝗥𝗘𝗡𝗗𝗦
Uptrends - Are identified by Higher highs and higher lows
Downtrends - Are identified by Lower high and Lower lows
Sideways - Is identified by the lows and highs almost if not equal forming a box
Uptrends - Are identified by Higher highs and higher lows
Downtrends - Are identified by Lower high and Lower lows
Sideways - Is identified by the lows and highs almost if not equal forming a box

3. 𝗧𝗜𝗠𝗘 𝗙𝗥𝗔𝗠𝗘𝗦 𝗧𝗢 𝗨𝗦𝗘
MACRO TRENDS
- DAILY WEEKLY MONTHLY
MICRO TRENDS
- 4HR 1HR 30Min 15Min 5Min
Micro trends will help you identify a intraday trend for good entries and exits
Macro trends will help you identify the overall trend to keep you in the trade
MACRO TRENDS
- DAILY WEEKLY MONTHLY
MICRO TRENDS
- 4HR 1HR 30Min 15Min 5Min
Micro trends will help you identify a intraday trend for good entries and exits
Macro trends will help you identify the overall trend to keep you in the trade
𝗧𝗜𝗠𝗘𝗙𝗥𝗔𝗠𝗘𝗦 𝗖𝗢𝗡𝗧.
Don’t get stuck on the smaller timeframes like the 5 min
One thing that has helped me find liquidity, not panic sell and swing trades is looking at the higher timeframes
Always zoom out and look at the bigger picture and macro trends
Don’t get stuck on the smaller timeframes like the 5 min
One thing that has helped me find liquidity, not panic sell and swing trades is looking at the higher timeframes
Always zoom out and look at the bigger picture and macro trends
4. 𝗕𝗢𝗦 𝗩𝗦 𝗖𝗛𝗢𝗖𝗛
Now that we have identified how to find trends let’s look at how to trade them
We have two concepts to know
BOS - Break of Structure
CHOCH - Change of Character
Now that we have identified how to find trends let’s look at how to trade them
We have two concepts to know
BOS - Break of Structure
CHOCH - Change of Character
𝗕𝗢𝗦 𝗩𝗦 𝗖𝗛𝗢𝗖𝗛 𝗖𝗢𝗡𝗧.
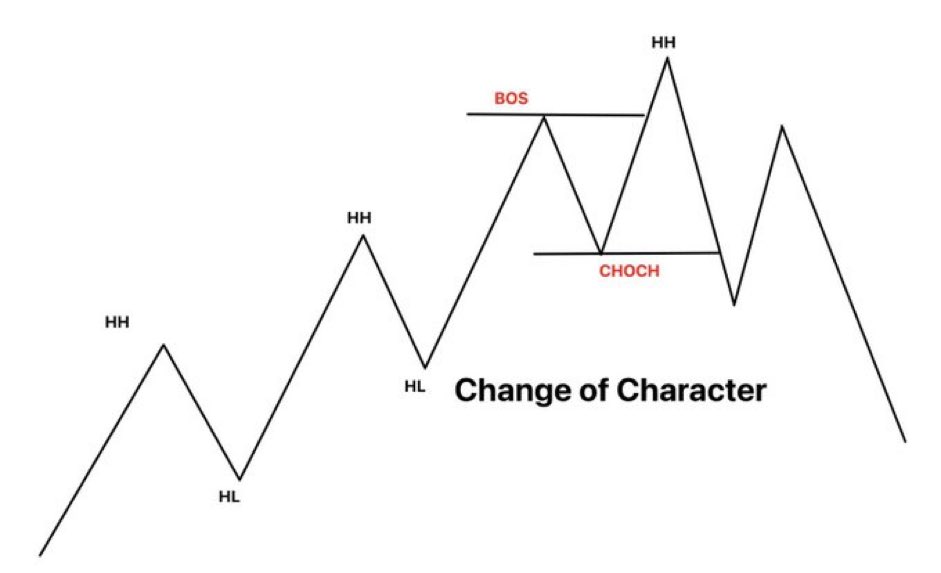
BOS - it means the break of a lower low in the case of a bearish trend, while during the bullish trend, it means the break of a higher high.
CHOCH - Break of lower high or higher low: after the break of structure, the price will reverse to change the trend. Then it will break the recent LHs or HLs. In the case of a bullish trend, the price will break the higher lows, while during a bearish trend, the price will break the lower highs.
Trend change: after the above steps, the price will change its trend. This is known as a 𝗰𝗵𝗮𝗻𝗴𝗲 𝗼𝗳 𝗰𝗵𝗮𝗿𝗮𝗰𝘁𝗲𝗿 in the market. For example, if the last character of the market was bullish, then it has been changed to bearish.
5. 𝗥𝗘𝗔𝗟 𝗟𝗜𝗙𝗘 𝗘𝗫𝗔𝗠𝗣𝗟𝗘
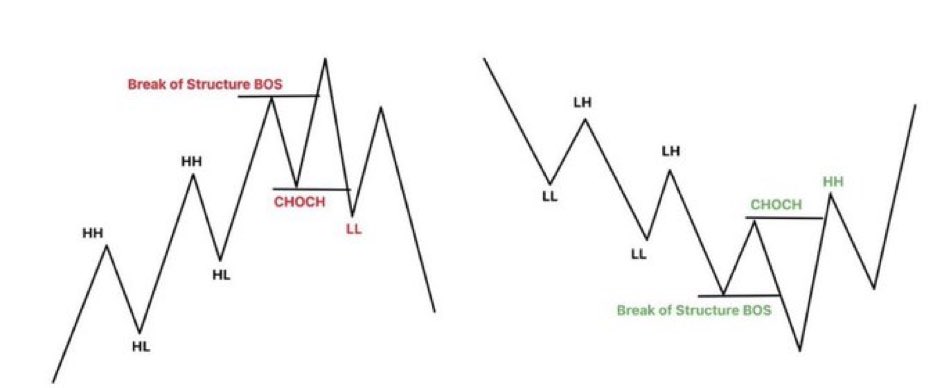
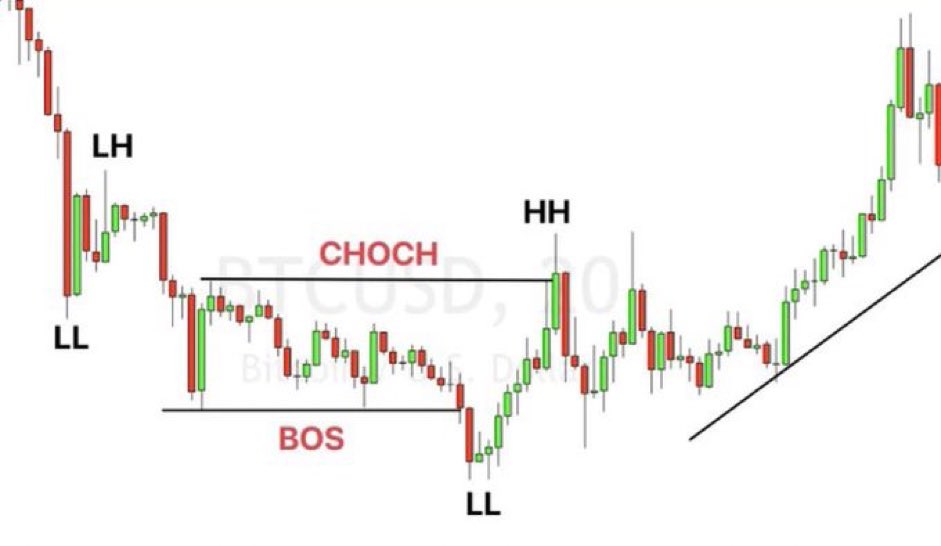
Here is an example of the BOS and CHOCH pattern. After a series of bearish trend (LL LH), the price breaks the lower low into a Higher high. This signifies a BOS into a CHOCH which should give a trend reversal.
Here is an example of the BOS and CHOCH pattern. After a series of bearish trend (LL LH), the price breaks the lower low into a Higher high. This signifies a BOS into a CHOCH which should give a trend reversal.
6. 𝗛𝗢𝗪 𝗧𝗢 𝗙𝗜𝗡𝗗 𝗟𝗜𝗤𝗨𝗜𝗗𝗜𝗧𝗬 𝗧𝗢 𝗧𝗔𝗞𝗘 𝗧𝗥𝗔𝗗𝗘
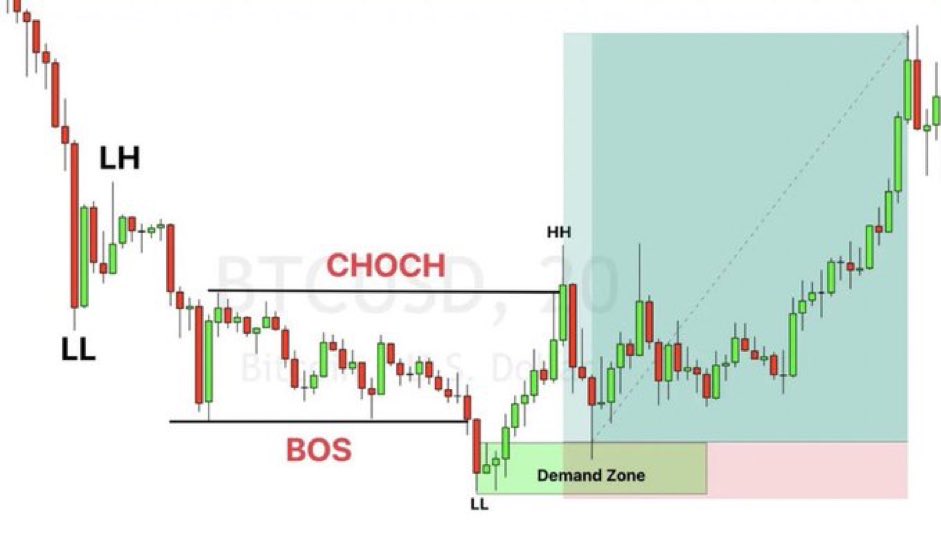
Enter a trade: When a Choch pattern forms, mark a supply/demand zone based on the recent trend. Wait for the price to retrace to the zone and then enter trade in the direction of the trend reversal.
Add the stop loss level: Put the stop loss a few points below the demand zone. If it breaks below it would invalidate the trade since it creates a Lower low
Take profit: Exit the trade when a counter-trend choch pattern forms on the chart again.
7. 𝗪𝗛𝗔𝗧 𝗪𝗘 𝗟𝗘𝗔𝗥𝗡𝗘𝗗
- Find trends
- Understand Price action and Market Structure
- Find liquidity to take trades
- Timeframes to use
- BOS vs CHOCH
- Find trends
- Understand Price action and Market Structure
- Find liquidity to take trades
- Timeframes to use
- BOS vs CHOCH
All that I ask is that you RT and LIKE for others to learn 📚
Follow @realjgbanks for more tips $SPY
Follow @realjgbanks for more tips $SPY
Loading suggestions...