

We're on the verge of another face melting bull market.
Technical analysis has helped me reach financial freedom in crypto bull markets.
It took me 5 years to learn and I will teach it to you in 5 minutes.
Please, read this guide if you plan on trading.
Disclaimer: I've simplified concepts to teach you technical analysis quickly.
For a free detailed trading course check out my telegram (link in bio)
Step 1: Understand the Trend
I'm going to teach you to read market structure + trend.
Moving averages are the easiest tool for this.
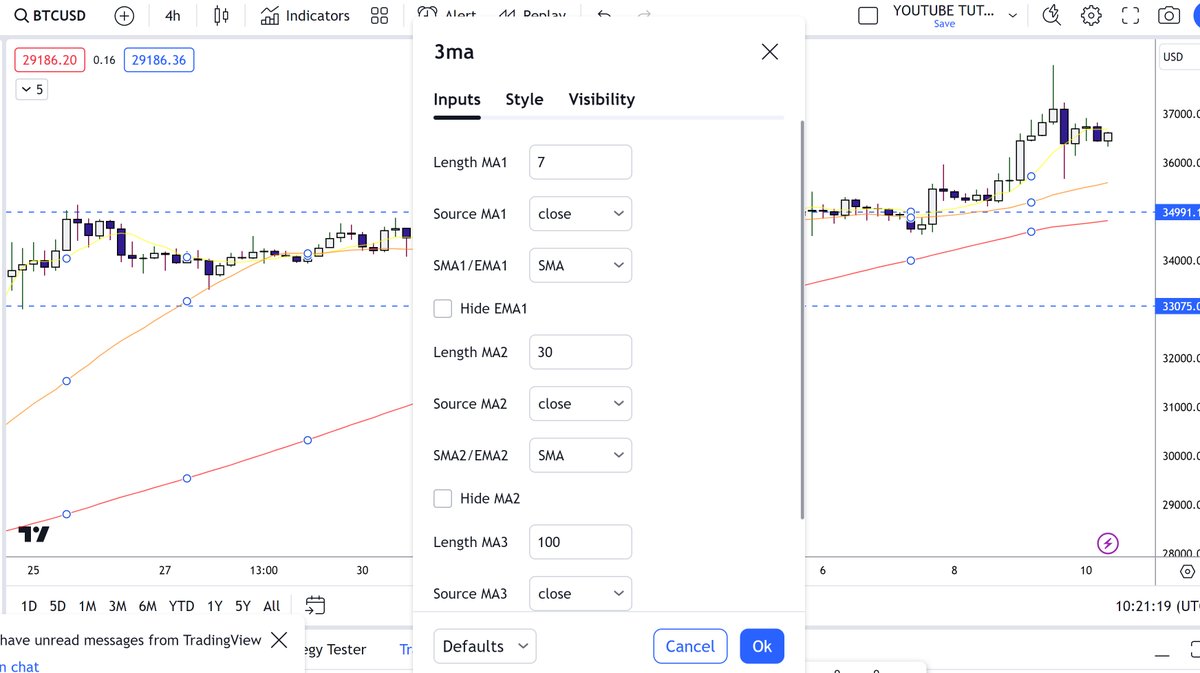
Set up Tradingview
Lower Time Frame: 7ma
Medium Time Frame: 30ma
High Time Frame: 100ma
Use MAs to identify the trend.
If you are using the free version and have limited indicators search for an indicator called "3ma" and put your settings like this.
Trend Cheat Sheet 1
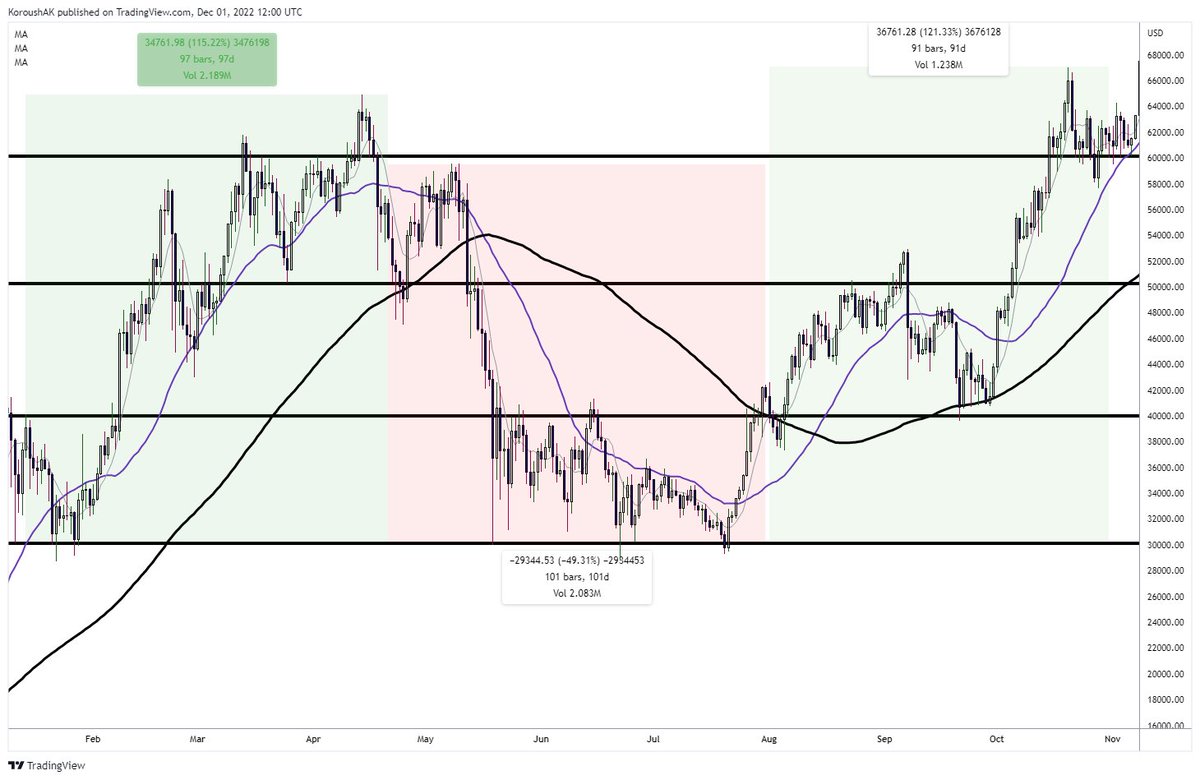
Uptrend: All MAs fan out with 7ma at top and 100ma at the bottom
Neutral-Uptrend: 7ma & 30ma crossing with 100ma at bottom
Neutral Trend: All MAs crossing
Neutral-Downtrend: 7ma and 30ma crossing with 100ma at top
Downtrend: All MAs fan out with 7ma at bottom and 100ma at top
Trend Cheat Sheet 2
Uptrend: Support is stronger and resistance is weaker
Neutral-Uptrend: Support is stronger
Neutral: Support and Resistance are equally strong
Neutral-Downtrend: Resistance is stronger
Downtrend: Resistance is stronger and support is weaker
Step 2: Identify Key Levels
For this, you need support and resistance.
Support: An area where there is demand for an asset. People buy here usually.
Resistance: An area where there is supply for an asset. People sell here usually.
Key levels can;
Hold: Buyers keep price above support. Sellers keep price below resistance.
Break: Buyers fail to keep price above support. Sellers fail to keep price below resistance.
Trap: Buyers/sellers fail to keep price above/below support/resistance temporarily.
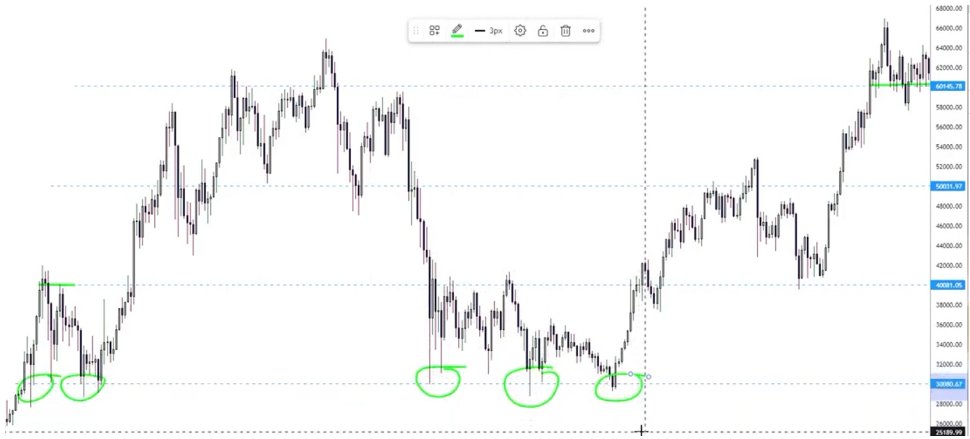
How to find support and resistance.
1. Round numbers are likely to act as key levels
2. If a level holds as support/resistance more than twice mark it
3. Support breaks it turns into resistance, if resistance breaks it turns into support
Look how well just the key round numbers work on $BTC
Step 3: Put it all together
1 - Identify key levels and trend
2- Apply all the rules and cheat sheets you've gotten today to perform you analysis.
And that's minimum viable technical analysis.
If you want to dive deeper and make the most of the next bull market.
Next learn learn risk management, strategy development and trade journaling.
Good luck.
Technical analysis has helped me reach financial freedom in crypto bull markets.
It took me 5 years to learn and I will teach it to you in 5 minutes.
Please, read this guide if you plan on trading.
Disclaimer: I've simplified concepts to teach you technical analysis quickly.
For a free detailed trading course check out my telegram (link in bio)
Step 1: Understand the Trend
I'm going to teach you to read market structure + trend.
Moving averages are the easiest tool for this.
Set up Tradingview
Lower Time Frame: 7ma
Medium Time Frame: 30ma
High Time Frame: 100ma
Use MAs to identify the trend.
If you are using the free version and have limited indicators search for an indicator called "3ma" and put your settings like this.
Trend Cheat Sheet 1
Uptrend: All MAs fan out with 7ma at top and 100ma at the bottom
Neutral-Uptrend: 7ma & 30ma crossing with 100ma at bottom
Neutral Trend: All MAs crossing
Neutral-Downtrend: 7ma and 30ma crossing with 100ma at top
Downtrend: All MAs fan out with 7ma at bottom and 100ma at top
Trend Cheat Sheet 2
Uptrend: Support is stronger and resistance is weaker
Neutral-Uptrend: Support is stronger
Neutral: Support and Resistance are equally strong
Neutral-Downtrend: Resistance is stronger
Downtrend: Resistance is stronger and support is weaker
Step 2: Identify Key Levels
For this, you need support and resistance.
Support: An area where there is demand for an asset. People buy here usually.
Resistance: An area where there is supply for an asset. People sell here usually.
Key levels can;
Hold: Buyers keep price above support. Sellers keep price below resistance.
Break: Buyers fail to keep price above support. Sellers fail to keep price below resistance.
Trap: Buyers/sellers fail to keep price above/below support/resistance temporarily.
How to find support and resistance.
1. Round numbers are likely to act as key levels
2. If a level holds as support/resistance more than twice mark it
3. Support breaks it turns into resistance, if resistance breaks it turns into support
Look how well just the key round numbers work on $BTC
Step 3: Put it all together
1 - Identify key levels and trend
2- Apply all the rules and cheat sheets you've gotten today to perform you analysis.
And that's minimum viable technical analysis.
If you want to dive deeper and make the most of the next bull market.
Next learn learn risk management, strategy development and trade journaling.
Good luck.
Here's a more detailed full trading course that most people would charge $1000 for.
I've given it to you for free.
t.me
I've given it to you for free.
t.me
Loading suggestions...