

📚 ONE OF THE MOST POWERFUL BULL MARKET INDICATORS -- EXPLAINED (Part II)
This tool helped me sell my coins at the heights of the previous bull market, but it's also very helpful to buy the right dips.
Let's dive in!
👇🏽
This tool helped me sell my coins at the heights of the previous bull market, but it's also very helpful to buy the right dips.
Let's dive in!
👇🏽

In part I of this series I discussed the basics of moving averages, and how they helped me sell at the right time.
In case you missed it, I've linked it below:
x.com
In case you missed it, I've linked it below:
x.com
Today we dive into using moving averages for trade entries and exits.
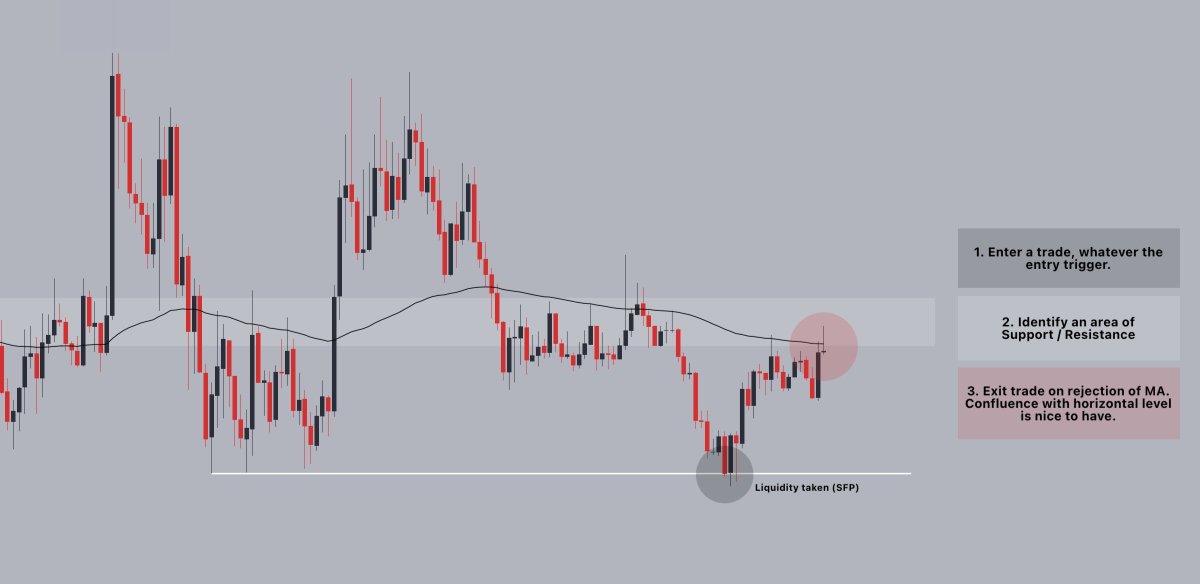
To enter trades, I find confluence between MAs and horizontal levels -- for example in the chart below.
When price retests an area that makes sense both horizontally, and MA-wise, it's usually a good entry.
To enter trades, I find confluence between MAs and horizontal levels -- for example in the chart below.
When price retests an area that makes sense both horizontally, and MA-wise, it's usually a good entry.

This works well in the early-stage bull market, but when it starts moving faster, you'll likely have to rely on moving averages alone.
For Bitcoin, I use the 21-week moving average. On the lower timeframes and altcoins, I find a combination of the 25, 50 & 200 ema works well.
For Bitcoin, I use the 21-week moving average. On the lower timeframes and altcoins, I find a combination of the 25, 50 & 200 ema works well.
For trade exits, selling into MAs works (preferably in confluence with horizontal levels) works well too.
I find this works best in downtrends, but it's also how I exited the market in 2021, when price broke below the 50d MA & retested it from below.
I find this works best in downtrends, but it's also how I exited the market in 2021, when price broke below the 50d MA & retested it from below.
Using MAs for exits and entries works best when there is a strong trend present -- but it's much less accurate in a sideways market.
Mean reversion strategies are more successful in such environments - but thats beyond today's scope.
Mean reversion strategies are more successful in such environments - but thats beyond today's scope.
All in all, MA's are a great indicator in the trading toolbox.
Don't blindly trade when price reaches an MA, but look at how the price reacts to the area as well. For example, wicks through a moving can tell you it is being respected.
Don't blindly trade when price reaches an MA, but look at how the price reacts to the area as well. For example, wicks through a moving can tell you it is being respected.
That's all for today.
Please consider leaving a like on the main tweet if you found this helpful, and let me know if there are other topics you want me to discuss.
Cheers!
Please consider leaving a like on the main tweet if you found this helpful, and let me know if there are other topics you want me to discuss.
Cheers!
Loading suggestions...